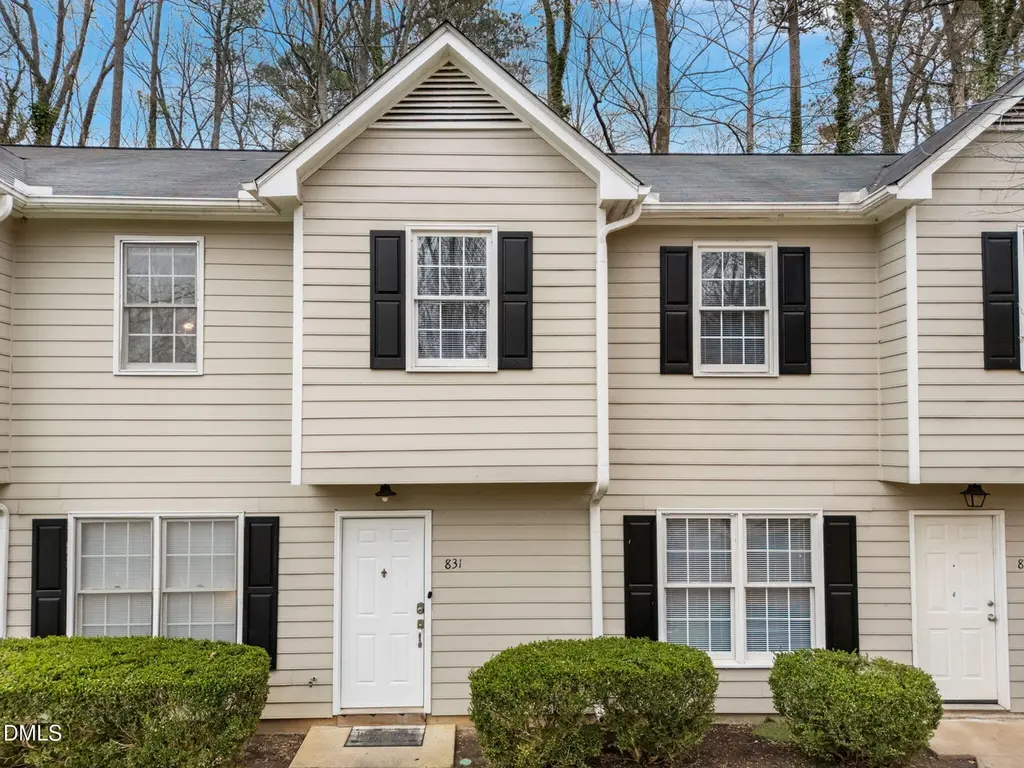
831 Dalewood Dr · Raleigh, NC
Flood risk 1/10 · Minimal
- FEMA flood zone
- X (unshaded)
- Chance of flooding over 30 yrs
- 0.0%
- Est. flood insurance / yr
- $507 – $1,088
Fire risk 1/10 · Minimal
- Est. fire insurance / yr
- $906 – $1,684
Heat risk 6/10 · Moderate
- Hot days now (above 106°F)
- 7 days/yr
- Hot days in 30 yrs
- 16 days/yr
Wind risk 6/10 · Moderate
- Chance of severe wind over 30 yrs
- 60.0%
Air-quality risk 3/10 · Minor
- Unhealthy air days now
- 2 days/yr
- Unhealthy air days in 30 yrs
- 2 days/yr
Risk factors via First Street. Map © Google.
Why this score? — see what drove the D grade
The composite is a weighted blend of 9 inputs, each scored 0–100. Each bar is that input's sub-score; the figure is the points it added to the 100-point composite (weight × sub-score).
- Cash flow +13.0/30.0
- ARV discount +9.0/15.0
- Schools +4.9/10.0
- 1% rule +4.2/10.0
- Livability +4.2/5.0
- DSCR +3.9/10.0
- Rent growth +2.6/5.0
- Condition / age +2.5/5.0
- Appreciation +0.0/10.0
$192,999
🖨 Deal sheet (PDF) 📄 Offer letter ✓ Due diligence
Listing remarks
Welcome to 831 Dalewood Dr -- a beautifully maintained 3-bedroom, 2-bath townhome offering the ideal combination of comfort, convenience, and value in one of Raleigh's most accessible locations. Fresh interior paint throughout enhances the home's bright, airy feel, creating a truly move-in ready opportunity. Inside, you'll find a light-filled living space with large windows that bring in abundant natural light and create a warm, inviting atmosphere perfect for both everyday living and entertaining. The open-concept layout flows seamlessly into the dining area and spacious kitchen, where granite countertops, ample cabinetry, and functional workspace make cooking and gathering effortless. Cei
Key facts
- Large windows
- Ample cabinetry
- Fresh interior paint
Tags
Property features AI
Finance
- Other: Zoning: R-6
- HOA & community: HOA (Park Glen HOA) with monthly fee; HOA fee covers grounds maintenance
Exterior
- Parking: 2 open assigned parking spaces
- Utilities: Public water; Public sewer; Electric service
- Home design: Townhouse; Two levels; Entry facing unspecified direction
- Construction: HardiPlank and Masonite siding; Shingle roof; Slab foundation; Built as a townhouse
- Exterior features: Public maintained road
Interior
- Kitchen: Dishwasher; Electric range; Refrigerator
- Bedrooms: 3 bedrooms
- Flooring: Carpet; Vinyl
- Bathrooms: 2 full bathrooms; 1 half bathroom
- Heating & cooling: Forced air heating; Heat pump; Central air conditioning
- Interior features: Ceiling fans; Granite counters
Neighborhood map
What this means for you Summary
Snapshot
- This is a 3-bed/1.5-bath townhouse listed at $193k.
Deal economics
- At list price, monthly cash flow is $-10 ($-120/yr) — negative.
- To cash-flow at today's rent, offer at most $191k (0.9% below list).
- To meet the 1% rule (rent ≥ 1% of price), the offer needs to be $178k (7.9% below list).
- Recommended offer: $178k (7.9% below list) — sets the bar for 1% rule.
- Cap rate 6.2% vs local median 2.7% in Raleigh — top-decile yield for the area; either an underpriced asset or a hidden risk that comps aren't pricing in. Stress-test before assuming the spread holds.
Location & tenants
- Location reads 83/100 on livability (#10 in NC, #1,028 nationally) — a professional / high-income tenant draw. Strengths: amenities A+, commute A+, housing A+; Watch: crime F.
- Wake County Schools (suburban): math 52% / reading 60% proficiency, ranked #35 of 178 in NC (top 20%) — acceptable for families but not a draw, mixed tenant base, ~2y average lease.
- Zoned schools: Leesville Road Elementary (math 68% / reading 66%, grade B+, #120 of 1,410 statewide, top 9%, 603 students, 30% FRL); Leesville Road Middle (math 59% / reading 57%, grade B, #59 of 475 statewide, top 13%, 791 students, 37% FRL); Leesville Road High (math 72% / reading 67%, grade B, #121 of 535 statewide, top 24%, 2,613 students, 22% FRL) — zoned schools at 30% FRL track the district average.
- Market conditions: Rents flat; 594 active listings in the ZIP; 32 comparable units currently listed for rent nearby; rentals at typical pace (median 22d on market — plan ~3-4 weeks tenant-placement turnaround); 15,249 units permitted in Wake County in 2024 (5,568 in 5+ unit buildings).
- This rent runs 31% of the median local income ($68k/yr) — at the standard rent-burdened threshold; future hikes will face affordability resistance.
Forward outlook
- Local home prices are declining (-3.0%/yr); year-one equity from $1k of loan paydown is wiped out by about $6k of value loss. Plan a longer hold.
- Wake County population projected at +51% by 2050 — long-run rental-demand tailwind backs the buy-and-hold thesis.
Negotiation context
- It's been on market 28 days — a 2% lower offer ($190k) is reasonable based on typical stale-listing flexibility.
- 2 sale attempts with the ask held roughly flat each time — persistent listings suggest the price (not the market) is what's stuck; bring a comps-based counter.
- Current owner paid $50k; list at $193k implies a 286% gain — meaningful room to come down on a strong offer.
Risks & watch-outs
- Climate carrying-cost: major wind risk, 60% chance of damaging wind over 30y; extreme-heat days projected 7→16/yr by 2055 (HVAC capex compounding) — expect insurance premiums to compound above CPI over the hold.
Questions for the listing agent
- What do current leases actually rent for vs. the listed asking? Can we see a recent rent roll and the last 12 months of T-12 income?
- What does the HOA fee cover, when was the last increase, and are there any pending special assessments or reserve-fund shortfalls?
- Is there a deadline driving the sale (1031 exchange, divorce, estate, relocation)? That informs how much negotiation room exists.
- Schools are B-rated — typically a magnet for longer-tenancy family renters. What's the average tenant stay here, and is there a school-zone premium baked into asking?
- Crime grade is F in this area — have there been break-ins, vandalism, or insurance claims at this property in the last 3 years? What carrier currently insures it and at what premium?
- The area grade is low — what's the realistic commute time and amenity access for the typical tenant pool here? Any planned neighborhood developments (good or bad) we should know about?
- What's the average days-on-market for RENTAL listings here right now (not sales)? A rising rental-DOM trend means longer vacancies and softer asking-rent achievability than the comps imply.
- What's the recent tenant-quality profile in this submarket — average credit score on applications, eviction rate, late-payment / NSF rate, and stable-employment percentage? A property-management company in the area should have these aggregated.
- How much new for-sale + rental construction is in the pipeline within 1–3 miles? Heavy new supply typically softens prices + rents 12–24 months out; constrained supply supports both.
Investment metrics
- 1% rule
- 0.92% ✗
- Cap rate
- 6.23%
- Cash-on-cash
- -0.22%
- DSCR
- 0.99
- GRM
- 9.1
CMA / ARV
- ARV (on-the-fly)
- $199,800
- Comps found
- 3
Show comp detail 3 sales within ~0.75 mi
| Address | Dist | Beds/Ba | Sqft | Sold | Price | $/sf | Match |
|---|---|---|---|---|---|---|---|
| 861 Dalewood Dr | 0.07mi | 2/1.5 (-1) | 1,047 (-6%) | 13mo | $188,000 | $180 | 71 |
| 859 Dalewood Dr | 0.06mi | 2/1.5 (-1) | 1,024 (-8%) | 15mo | $193,000 | $188 | 66 |
| 1341 Park Glen Dr #204 | 0.17mi | 2/2.0 (-1) | 1,012 (-9%) | 9mo | $130,000 | $128 | 63 |
Match score weights: distance 35% · size 25% · config 20% · recency 20%. Top-matched comps best support the ARV.
Projected returns pro-forma
-3.0% appreciation · 0.2% rent growth · sell at horizon
- IRR
- -20.0%
- Equity multiple
- 0.32×
- Total profit
- $-36,702
- Equity at exit
- $28,777
- IRR
- -21.1%
- Equity multiple
- 0.05×
- Total profit
- $-51,360
- Equity at exit
- $16,687
Cash invested: $54,040 (down + closing). Projections, not guarantees.
Landlord ↔ Tenant lean methodology
- Overall (STATE)
- 85 Strongly Landlord-Friendly
- State North Carolina
- 85 Strongly Landlord-Friendly · R+3
- County
- — inherits STATE
- City
- — inherits STATE
ZIP-level market 27610
- Rents YoY
- 0.2%
- Active inventory
- 594
- Price-to-rent
- 9.1×
Monthly cashflow live
- Estimated rent
- $1,777 high interval (Pro) →
- Mortgage (P&I)
- −$1,012
- Tax from tax record
- −$151 /mo · $1,812/yr
- Insurance
- −$80
- HOA
- −$170
- Vacancy / Maint / Mgmt
- −$373
- Net cashflow
- $-10
Break-even live
Sensitivity live
| Price | -10% $99 | -5% $45 | +0% $-10 | +5% $-65 | +10% $-119 |
|---|---|---|---|---|---|
| Rent | -10% $-150 | -5% $-80 | +0% $-10 | +5% $60 | +10% $130 |
| Rate | -1.0pp $87 | -0.5pp $39 | base $-10 | +0.5pp $-60 | +1.0pp $-111 |
UW: 25.0% down · 7.5% · 30yr · 1.5% tax · 5.0% vac · 8.0% maint · 8.0% mgmt
Financing live
Cash to close
- Down payment
- $48,250
- Closing costs
- $5,790
- Reserves months
- —
- Total cash needed
- —
Loan-product check · same deal, 3 products live
Conventional
25% down · 7.5% · 30yr
- Down + closing
- —
- Monthly P&I
- —
- Monthly cashflow
- —
- DSCR
- —
- Eligible?
- —
Personal DTI + credit; lowest rate.
DSCR
20% down · 8.5% · 30yr
- Down + closing
- —
- Monthly P&I
- —
- Monthly cashflow
- —
- DSCR
- —
- Eligible?
- —
No personal income docs; deal must DSCR.
Hard money
10% down · 12.0% · 12mo
- Down + closing
- —
- Monthly P&I
- —
- Monthly cashflow
- —
- DSCR
- —
- Eligible?
- —
Short-term bridge; refi at stabilization.
Rent comps 32 comps
| Address | Beds | Baths | Sqft | Rent | $/sqft | DOM | Units | Dist |
|---|---|---|---|---|---|---|---|---|
| 817 Dalewood Dr Raleigh, NC | 3.0 | 2.0 | 1110 | $1,595 | $1.44 | 16d | 1 | 0.03mi |
| 1330 Park Glen Dr #104 Raleigh, NC | 2.0 | 2.0 | 1012 | $1,295 | $1.28 | 19d | 1 | 0.12mi |
| 1950 N Raleigh Blvd Unit C Raleigh, NC | 2.0 | 2.0 | 1050 | $1,249 | $1.19 | 22d | 1 | 0.17mi |
| 1341 Park Glen Dr #101 Raleigh, NC | 2.0 | 2.0 | 912 | $1,250 | $1.37 | 25d | 1 | 0.17mi |
| 530 Banks St Raleigh, NC | 3.0 | 1.5 | 1241 | $2,399 | $1.93 | 25d | 1 | 0.26mi |
| 1129 Marlborough Rd Raleigh, NC | 3.0 | 2.0 | 1101 | $2,050 | $1.86 | 25d | 1 | 0.37mi |
| 2110 Birkhall St Raleigh, NC | 2.0 | 1.0–2.0 | 929 | $2,200 | $2.37 | 3d | 93 | 0.39mi |
| 2317 Glascock St Raleigh, NC | 2.0 | 1.0 | 820 | $1,395 | $1.70 | 25d | 1 | 0.50mi |
| 2200 Glascock St Apt G Raleigh, NC | 2.0 | 1.5 | 1100 | $1,200 | $1.09 | 25d | 1 | 0.55mi |
| 2325 K Wesley Way Raleigh, NC | 3.0 | 2.0 | 1136 | $2,099 | $1.85 | 4d | 1 | 0.66mi |
| 1805 Bennett St Raleigh, NC | 2.0 | 1.0 | 1200 | $2,300 | $1.92 | 25d | 1 | 0.69mi |
| 712 Hartford Rd Raleigh, NC | 2.0 | 1.0 | 900 | $1,450 | $1.61 | 5d | 1 | 0.72mi |
| 2080 Brentmoor Dr Raleigh, NC | 2.0 | 2.0 | 1055 | $1,625 | $1.54 | 23d | 1 | 0.77mi |
| 1806 Midwood Dr Apt C Raleigh, NC | 2.0 | 1.0 | 950 | $1,550 | $1.63 | 23d | 1 | 0.78mi |
| 1806 Midwood Dr Apt D Raleigh, NC | 2.0 | 1.0 | 950 | $1,475 | $1.55 | 23d | 1 | 0.78mi |
| 1806 Midwood Dr Raleigh, NC | 2.0 | 1.0 | 950 | $1,550 | $1.63 | 5d | 1 | 0.78mi |
| 2221 Iron Works Dr Raleigh, NC | 2.0 | 1.0–2.0 | 800 | $2,572 | $3.21 | 4d | 10 | 0.99mi |
| 2221 Iron Works Dr Raleigh, NC | 2.0 | 1.0–2.0 | 803 | $2,967 | $3.69 | 5d | 30 | 0.99mi |
| 900 Canenaugh Dr #108 Raleigh, NC | 2.0 | 2.0 | 1000 | $1,550 | $1.55 | 19d | 1 | 1.16mi |
| 460 Dickens Dr Raleigh, NC | 3.0 | 2.0 | 1422 | $1,950 | $1.37 | 12d | 1 | 1.21mi |
| 212 N Peartree Ln Raleigh, NC | 3.0 | 1.5 | 1379 | $1,545 | $1.12 | 22d | 1 | 1.27mi |
| 2621 Oldgate Dr Raleigh, NC | 2.0 | 2.0 | 1177 | $1,595 | $1.36 | 25d | 1 | 1.28mi |
| 2305 Hill St Raleigh, NC | 2.0 | 2.0 | 1035 | $1,550 | $1.50 | 25d | 1 | 1.30mi |
| 2421 Hill St Raleigh, NC | 3.0 | 2.0 | 1033 | $1,700 | $1.65 | 12d | 1 | 1.35mi |
| 2404 Hill St Raleigh, NC | 3.0 | 2.0 | 1033 | $1,700 | $1.65 | 12d | 1 | 1.36mi |
| 2922 Glenridge Dr Raleigh, NC | 2.0 | 1.5 | 1104 | $1,450 | $1.31 | 25d | 1 | 1.38mi |
| 2922 Glenridge Dr Unit A Raleigh, NC | 2.0 | 1.5 | 1104 | $1,450 | $1.31 | 21d | 1 | 1.38mi |
| 2911 Mid-Century Dr Raleigh, NC | 3.0 | 1.0–2.0 | 1038 | $2,319 | $2.23 | 3d | 37 | 1.39mi |
| 3211 Pridwen Cir Raleigh, NC | 1.0–3.0 | 1.0–2.0 | 1103 | $1,594 | $1.45 | 3d | 17 | 1.41mi |
| 2934 Glenridge Dr Raleigh, NC | 3.0 | 1.5 | 1023 | $2,000 | $1.96 | 14d | 1 | 1.43mi |
| 305 N State St Raleigh, NC | 2.0 | 1.0 | 816 | $1,350 | $1.65 | 14d | 1 | 1.49mi |
| 1309 E Jones St Unit 1309 Raleigh, NC | 2.0 | 1.0 | 1200 | $1,395 | $1.16 | 25d | 1 | 1.50mi |
HOA detail
- Monthly dues
- $170 · $2,040/yr
Listing history 21 events
-
2026-06-19status $192,999 Pending 28 DOM
-
2026-06-18days on market $192,999 Active 28 DOM
-
2026-06-17days on market $192,999 Active 27 DOM
-
2026-06-16days on market $192,999 Active 26 DOM
-
2026-06-15days on market $192,999 Active 25 DOM
-
2026-06-13days on market $192,999 Active 23 DOM
-
2026-06-13days on market $192,999 Active 22 DOM
-
2026-06-09days on market $192,999 Active 19 DOM
-
2026-06-08days on market $192,999 Active 18 DOM
-
2026-06-07days on market $192,999 Active 17 DOM
-
2026-06-05days on market $192,999 Active 14 DOM
-
2026-06-03days on market $192,999 Active 13 DOM
-
2026-06-02days on market $192,999 Active 12 DOM
-
2026-06-01days on market $192,999 Active 11 DOM
-
2026-05-31days on market $192,999 Active 10 DOM
-
2026-05-21$192,999 Active
-
2026-05-20historical
-
2026-03-27price $192,999
-
2026-03-13$214,900 Active
-
2013-11-06soldstatus $50,000
-
1993-04-27soldstatus $56,500
ⓘ Source: listings_history table (triggers on properties + properties_extension) + one-shot
backfill from property_details.listing_events for pre-trigger history.
Tax reassessment forecast NC · Resets to sale price
- Current annual tax
- $1,812 · $151/mo
- Projected year-2 tax
- $1,812 · $151/mo
- Expected delta
- $0/yr ($0/mo · 0.0%)
ⓘ Screening estimate from a state-policy table — verify with the county assessor before closing.
Climate risk First Street
- Flood 1/10 Low FEMA zone X (unshaded) · 0% chance over 30 yrs
- Wildfire 1/10 Low
- Heat 6/10 Major 7 d/yr ≥106°F today · 16 d/yr by 30 yrs out
- Wind 6/10 Major 60% chance of damaging wind over 30 yrs
- Air quality 3/10 Moderate 2 unhealthy d/yr today · 2 by 30 yrs out
Nearby sold comps map
Loading sold comps map…
Walkable amenities ~0.75 mi
Loading nearby amenities…
Taxation est. · year 1
- Rental income
- $21,319
- − Mortgage interest
- −$10,811
- − Property taxes
- −$1,812
- − Insurance
- −$965
- − Repairs & maintenance
- −$1,706
- − Management
- −$1,706
- − HOA
- −$2,040
- − Depreciation
- −$5,615
- Taxable loss
- −$3,334
- Est. tax savings @ 24.0%
- +$800
- After-tax cash flow
- $681/yr
For passive investors: Depreciation is non-cash, so a rental often shows a tax loss while cash-flowing — sheltering income. Rental losses are passive: they offset passive income freely, and up to $25,000/yr can offset ordinary (W-2) income if you actively participate and your MAGI is under $100k (phasing out to $0 by $150k); unused losses carry forward. On sale, claimed depreciation is recaptured at up to 25%, and gains may owe capital-gains tax (a 1031 exchange can defer both). Figures are a year-1 estimate at your 24.0% rate — not tax advice; consult a CPA.
Schools (NCES district)
- District
- Wake County Schools
- NCES district ID
- 3704720
- Math proficiency
- 52% ▲ 2.00%
- Reading proficiency
- 60% ▲ 4.00%
- Median HH income
- $67,509
- Composite
- 49.41/100
- National rank
- #2010
- State rank
- #35 of 178 in NC
Livability — Raleigh
- Score
- 83/100
- State rank
- #10
- US rank
- #1028
Category grades
Schools grade is shown separately in the Schools card above.
Census & demographics
- Census place
- Raleigh, NC
- County
- Wake County · 1,216,256 people
- City population
- 569,344
- Metro
- Raleigh-Cary, NC
- Population (ZIP)
- 81,419
- Household income
- $67,932
- Rent vs Own
- Severe rent burden
- 3499.0
Population outlook (Wake County) Hauer SSP2
- Today (2025)
- 1,293,152 people
- By 2030
- 1,428,223 · +10.4%
- By 2040
- 1,698,188 · +31.3%
- By 2050
- 1,955,807 · +51.2%
- By 2075
- 2,520,273 · +94.9%
- By 2100
- 2,893,335 · +123.7%
Race, ethnicity, and origin ACS 2023
- Neighborhood character
- Diverse neighborhood (Simpson 0.59)
- Race & ethnicity
- Black 59% Hispanic / Latino 20% White 15% Two or more races 8% Asian 1%
- Hispanic origin (detail)
- Mexican 10% Puerto Rican 1% Dominican 1%
- Common ancestry
- Lithuanian 1% Slovak 1% Serbian 1%
- Foreign-born
- 14% · Canada
- Languages at home
- 77% English-only · Spanish 18% Arabic 1% French/Haitian/Cajun 1%
Political lean MEDSL · Wake
- 2024 margin
- Strong D (+25.5) · D 61.9% · R 36.4% · Other 1.7%
- 2008→2024 swing
- +11.1pp toward D · 2008: 14.4pp · 2024: 25.5pp
- All cycles
- 2024: D+25.5 2020: D+26.4 2016: D+20.5 2012: D+10.2 2008: D+14.4
Not yet ingested
- Civics
- —
Market trends
- HPI YoY
- ▼ -131.88%
- Current HPI
- 237.704
- Rent YoY
- ▲ 0.20%
- Metro
- Raleigh-Cary, NC
- State GDP YoY
- ▲ 3.28%
- F500 in state
- 26
Industry mix (Fortune 500 HQ in NC)
| Industry | F500 HQs | Revenue |
|---|---|---|
| Financial Services | 2 | $213B |
|
||
| Retail | 2 | $95B |
|
||
| Industrial Conglomerate | 1 | $38B |
|
||
| Metals / Steel | 1 | $35B |
|
||
| Utilities | 1 | $30B |
|
||
| Industrial Machinery | 1 | $19B |
|
||
Price history
+241.6% since first listed6 events — show timeline
- 2026-05-21 Listed $192,999 TMLS
- 2026-05-20 Listing Removed — TMLS
- 2026-03-27 Price Changed $192,999 TMLS
- 2026-03-13 Listed $214,900 TMLS
- 2013-11-06 Sold (Public Records) $50,000 Public Records
- 1993-04-27 Sold (Public Records) $56,500 Public Records
Property tax history
+7.3%/yrLatest (2025): $1,812 · +0.4% YoY. Source: county tax records.
Cash-flow waterfall
monthlySold comps — $/sqft
last 12 mo · ≤1 miLoading sold comps…