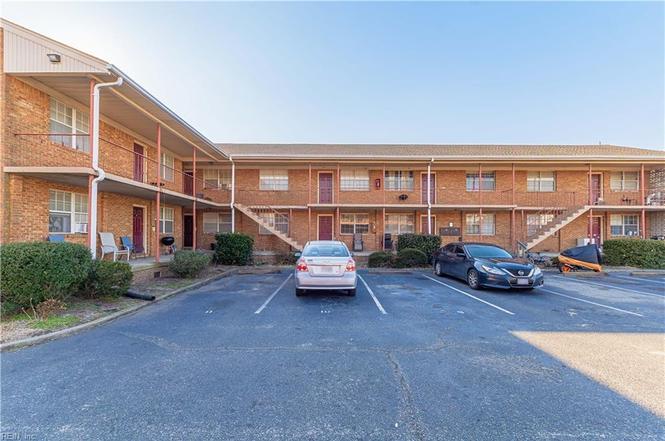
 22-Plex
1211 W Ocean View Ave · Norfolk, VA
Flood risk 9/10 · Severe
- FEMA flood zone
- AE
- Chance of flooding over 30 yrs
- 0.99%
- Est. flood insurance / yr
- $1,737 – $8,500
Fire risk 1/10 · Minimal
- Est. fire insurance / yr
- $666 – $1,236
Heat risk 9/10 · Severe
- Hot days now (above 105°F)
- 7 days/yr
- Hot days in 30 yrs
- 16 days/yr
Wind risk 8/10 · Major
- Chance of severe wind over 30 yrs
- 80.0%
Air-quality risk 2/10 · Minimal
- Unhealthy air days now
- 2 days/yr
- Unhealthy air days in 30 yrs
- 2 days/yr
Risk factors via First Street. Map © Google.
Why this score? — see what drove the B grade
The composite is a weighted blend of 9 inputs, each scored 0–100. Each bar is that input's sub-score; the figure is the points it added to the 100-point composite (weight × sub-score).
- Cash flow +29.8/30.0
- DSCR +10.0/10.0
- 1% rule +7.9/10.0
- ARV discount +7.5/15.0
- Rent growth +5.0/5.0
- Livability +4.2/5.0
- Schools +3.5/10.0
- Condition / age +2.5/5.0
- Appreciation +0.0/10.0
$2,200,000
🖨 Deal sheet (PDF) 📄 Offer letter ✓ Due diligence
Multi-family units
County records classify this as Multi-Family (5+ Unit). Listing-text estimate: 22 units. confirmed
5+ unit building — per-unit beds/baths from public records are typically unavailable; the breakdown below (if shown) is an estimate from the listing text.
Listing remarks
Rare opportunity to own a 22-unit apartment complex in a sought-after beachside location. Offering 16 spacious 2-bedroom, 1-bath units and 6 comfortable 1-bedroom, 1-bath units, this property benefits from proximity to the beach, shopping centers, dining, and major highway routes. Excellent opportunity for investors seeking strong rental appeal in a prime coastal area.
Key facts
- Shopping centers
- Beachside location
- Dining
Tags
Neighborhood map
What this means for you Summary
Snapshot
- This is a 16×2bd/1.0ba + 6×1bd/1.0ba units multifamily listed at $2.20M.
Deal economics
- At list price, monthly cash flow is $8k ($92k/yr) — positive. Per door: $347/mo.
- The deal already cash-flows at list — no discount required.
- Meets the 1% rule at list price ($28k rent vs $2.20M).
- Recommended offer: $2.17M (1.5% below list) — sets the bar for market timing.
- Cap rate 10.7% vs local median 4.0% in Norfolk — top-decile yield for the area; either an underpriced asset or a hidden risk that comps aren't pricing in. Stress-test before assuming the spread holds.
Location & tenants
- Location reads 83/100 on livability (#43 in VA, #1,026 nationally) — a professional / high-income tenant draw. Strengths: amenities A+, commute A+, health & safety A+; Watch: employment C-, crime F.
- Norfolk City Public School District (urban): math 27% / reading 56% proficiency, ranked #118 of 131 in VA (top 90%) — families likely to look elsewhere, expect single-tenant / working-renter base with shorter leases.
- Zoned schools: Ocean View Elementary (math 20% / reading 53%, grade F, #953 of 1,108 statewide, top 86%, 456 students, 98% FRL); Northside Middle (math 25% / reading 58%, grade F, #299 of 342 statewide, top 88%, 763 students, 92% FRL); Granby High (math 33% / reading 80%, grade C, #270 of 319 statewide, top 86%, 1,837 students, 94% FRL) — zoned schools average 95% FRL vs 59% district-wide (36 pts higher); higher-poverty schools than district average — tighter screening recommended.
- Market conditions: Rents rising fast (+12.1%/yr); 108 active listings in the ZIP; 438 units permitted in Norfolk city in 2024 (273 in 5+ unit buildings).
- At $28,412/mo this rent would consume 582% of the median local household income ($59k/yr) (locally 2299% of renters already pay >50% of income on rent) — very limited rent-growth headroom before tenants either downsize or default.
Forward outlook
- Local home prices are declining (-3.0%/yr); year-one equity from $15k of loan paydown is wiped out by about $66k of value loss. Plan a longer hold.
- At projected returns (-3.0% appreciation + 8.0% rent growth), your $616k cash investment doubles in ~6 years — after that, you're playing with house money.
Negotiation context
- It's been on market 30 days — a 2% lower offer ($2.17M) is reasonable based on typical stale-listing flexibility.
- 2 sale attempts with the ask held roughly flat each time — persistent listings suggest the price (not the market) is what's stuck; bring a comps-based counter.
Risks & watch-outs
- Watch-outs: flood insurance adds $427/mo.
- Climate carrying-cost: in FEMA flood zone AE (mandatory federal flood insurance); severe wind risk, 80% chance of damaging wind over 30y; extreme-heat days projected 7→16/yr by 2055 (HVAC capex compounding) — expect insurance premiums to compound above CPI over the hold.
Questions for the listing agent
- Can we see the unit-by-unit rent roll, current vacancy, and any below-market leases? What's the average tenancy length?
- What capital expenditures (roof, boiler, parking lot, exteriors) have been made in the last 5 years, and what's planned in the next 2?
- Built in 1973 — when were the roof, HVAC, electrical panel, plumbing, and water heater last replaced?
- What's the actual annual flood-insurance premium (NFIP or private), and is the property in a SFHA with mandatory coverage?
- Is there a deadline driving the sale (1031 exchange, divorce, estate, relocation)? That informs how much negotiation room exists.
- Schools are A-rated — typically a magnet for longer-tenancy family renters. What's the average tenant stay here, and is there a school-zone premium baked into asking?
- Crime grade is F in this area — have there been break-ins, vandalism, or insurance claims at this property in the last 3 years? What carrier currently insures it and at what premium?
- What's the average days-on-market for RENTAL listings here right now (not sales)? A rising rental-DOM trend means longer vacancies and softer asking-rent achievability than the comps imply.
- What's the recent tenant-quality profile in this submarket — average credit score on applications, eviction rate, late-payment / NSF rate, and stable-employment percentage? A property-management company in the area should have these aggregated.
- How much new apartment / multifamily construction is in the pipeline within 1–3 miles? Heavy new supply (>2% of stock underway) typically softens rents 12–24 months out; light construction supports rent growth.
Investment metrics
- 1% rule
- 1.29% ✓
- Cap rate
- 10.69%
- Cash-on-cash
- 15.71%
- DSCR
- 1.70
- GRM
- 6.5
CMA / ARV
No comps found within radius.
Projected returns pro-forma
-3.0% appreciation · 8.0% rent growth · sell at horizon
- IRR
- 10.9%
- Equity multiple
- 1.45×
- Total profit
- $280,169
- Equity at exit
- $328,027
- IRR
- 23.6%
- Equity multiple
- 3.52×
- Total profit
- $1,554,346
- Equity at exit
- $190,216
Cash invested: $616,000 (down + closing). Projections, not guarantees.
Landlord ↔ Tenant lean methodology
- Overall (STATE)
- 55 Moderately Landlord-Leaning
- State Virginia
- 55 Moderately Landlord-Leaning · D+2
- County
- — inherits STATE
- City
- — inherits STATE
ZIP-level market 23505
- Home prices YoY
- -19.6%
- Rents YoY
- 12.1%
- Active inventory
- 108
- Price-to-rent
- 136.6×
Monthly cashflow live
- Estimated rent
- $28,412 medium interval (Pro) →
- Mortgage (P&I)
- −$11,537
- Tax from tax record
- −$1,929 /mo · $23,154/yr
- Insurance
- −$917
- Flood insurance flood zone
- −$427 /mo · $5,118/yr
- HOA
- −$0
- Vacancy / Maint / Mgmt
- −$5,967
- Net cashflow
- $7,636
Break-even live
Sensitivity live
| Price | -10% $8,881 | -5% $8,258 | +0% $7,636 | +5% $7,013 | +10% $6,390 |
|---|---|---|---|---|---|
| Rent | -10% $5,391 | -5% $6,513 | +0% $7,636 | +5% $8,758 | +10% $9,880 |
| Rate | -1.0pp $8,744 | -0.5pp $8,195 | base $7,636 | +0.5pp $7,066 | +1.0pp $6,486 |
22-unit breakdown (identical units grouped — click to expand)
| Units | Beds | Baths | Est. rent |
|---|---|---|---|
| 16× units | 2 | 1 | $21,472 |
| #1 | 2 | 1 | $1,342 |
| #2 | 2 | 1 | $1,342 |
| #3 | 2 | 1 | $1,342 |
| #4 | 2 | 1 | $1,342 |
| #5 | 2 | 1 | $1,342 |
| #6 | 2 | 1 | $1,342 |
| #7 | 2 | 1 | $1,342 |
| #8 | 2 | 1 | $1,342 |
| #9 | 2 | 1 | $1,342 |
| #10 | 2 | 1 | $1,342 |
| #11 | 2 | 1 | $1,342 |
| #12 | 2 | 1 | $1,342 |
| #13 | 2 | 1 | $1,342 |
| #14 | 2 | 1 | $1,342 |
| #15 | 2 | 1 | $1,342 |
| #16 | 2 | 1 | $1,342 |
| 6× units | 1 | 1 | $6,942 |
| #17 | 1 | 1 | $1,157 |
| #18 | 1 | 1 | $1,157 |
| #19 | 1 | 1 | $1,157 |
| #20 | 1 | 1 | $1,157 |
| #21 | 1 | 1 | $1,157 |
| #22 | 1 | 1 | $1,157 |
| Total (22 units) | $28,412 | ||
UW: 25.0% down · 7.5% · 30yr · 1.5% tax · 5.0% vac · 8.0% maint · 8.0% mgmt
Financing live
Cash to close
- Down payment
- $550,000
- Closing costs
- $66,000
- Reserves months
- —
- Total cash needed
- —
Loan-product check · same deal, 3 products live
Conventional
25% down · 7.5% · 30yr
- Down + closing
- —
- Monthly P&I
- —
- Monthly cashflow
- —
- DSCR
- —
- Eligible?
- —
Personal DTI + credit; lowest rate.
DSCR
20% down · 8.5% · 30yr
- Down + closing
- —
- Monthly P&I
- —
- Monthly cashflow
- —
- DSCR
- —
- Eligible?
- —
No personal income docs; deal must DSCR.
Hard money
10% down · 12.0% · 12mo
- Down + closing
- —
- Monthly P&I
- —
- Monthly cashflow
- —
- DSCR
- —
- Eligible?
- —
Short-term bridge; refi at stabilization.
Listing history 5 events
-
2026-04-25status Under Contract
-
2026-04-15historical Active Under Contract
-
2026-04-02status Active
-
2026-02-25status Under Contract
-
2026-02-18$2,200,000 Active
ⓘ Source: listings_history table (triggers on properties + properties_extension) + one-shot
backfill from property_details.listing_events for pre-trigger history.
Tax reassessment forecast VA · Resets to sale price
- Current annual tax
- $23,154 · $1,929/mo
- Projected year-2 tax
- $23,154 · $1,929/mo
- Expected delta
- $0/yr ($0/mo · 0.0%)
ⓘ Screening estimate from a state-policy table — verify with the county assessor before closing.
Climate risk First Street
- Flood 9/10 Extreme FEMA zone AE · 99% chance over 30 yrs
- Wildfire 1/10 Low
- Heat 9/10 Extreme 7 d/yr ≥105°F today · 16 d/yr by 30 yrs out
- Wind 8/10 Severe 80% chance of damaging wind over 30 yrs
- Air quality 2/10 Low 2 unhealthy d/yr today · 2 by 30 yrs out
Nearby sold comps map
Loading sold comps map…
Walkable amenities ~0.75 mi
Loading nearby amenities…
Taxation est. · year 1
- Rental income
- $340,944
- − Mortgage interest
- −$123,234
- − Property taxes
- −$23,154
- − Insurance
- −$16,118
- − Repairs & maintenance
- −$27,276
- − Management
- −$27,276
- − Depreciation
- −$64,000
- Taxable income
- $59,887
- Est. tax owed @ 24.0%
- −$14,373
- After-tax cash flow
- $77,256/yr
For passive investors: Depreciation is non-cash, so a rental often shows a tax loss while cash-flowing — sheltering income. Rental losses are passive: they offset passive income freely, and up to $25,000/yr can offset ordinary (W-2) income if you actively participate and your MAGI is under $100k (phasing out to $0 by $150k); unused losses carry forward. On sale, claimed depreciation is recaptured at up to 25%, and gains may owe capital-gains tax (a 1031 exchange can defer both). Figures are a year-1 estimate at your 24.0% rate — not tax advice; consult a CPA.
Schools (NCES district)
- District
- Norfolk City Public School District
- NCES district ID
- 5102670
- Math proficiency
- 27% ▼ -44.00%
- Reading proficiency
- 56% ▼ -10.00%
- Median HH income
- $44,358
- Composite
- 35.08/100
- National rank
- #5026
- State rank
- #118 of 131 in VA
Livability — Norfolk
- Score
- 83/100
- State rank
- #43
- US rank
- #1026
Category grades
Schools grade is shown separately in the Schools card above.
Census & demographics
- Census place
- Norfolk, VA
- County
- Norfolk City · 214,042 people
- City population
- 214,042
- Metro
- Virginia Beach-Norfolk-Newport News, VA-NC
- Population (ZIP)
- 28,247
- Household income
- $58,579
- Rent vs Own
- Severe rent burden
- 2299.0
Population outlook (Norfolk County) Hauer SSP2
- Today (2025)
- 249,032 people
- By 2030
- 252,347 · +1.3%
- By 2040
- 253,644 · +1.9%
- By 2050
- 251,913 · +1.2%
- By 2075
- 245,281 · -1.5%
- By 2100
- 219,548 · -11.8%
Race, ethnicity, and origin ACS 2023
- Neighborhood character
- Diverse neighborhood (Simpson 0.67)
- Race & ethnicity
- White 44% Black 34% Hispanic / Latino 12% Two or more races 8% Asian 4%
- Hispanic origin (detail)
- Mexican 4% Puerto Rican 3%
- Common ancestry
- Romanian 2% Slovak 2% Italian 2%
- Foreign-born
- 9% · Canada, United Kingdom, South Korea
- Languages at home
- 87% English-only · Spanish 6% Tagalog/Filipino 1% French/Haitian/Cajun 1%
Political lean MEDSL · Norfolk
- 2024 margin
- Solid D (+41.5) · D 70.0% · R 28.5% · Other 1.6%
- 2008→2024 swing
- -1.4pp toward R · 2008: 43.0pp · 2024: 41.5pp
- All cycles
- 2024: D+41.5 2020: D+45.6 2016: D+42.0 2012: D+44.0 2008: D+43.0
Not yet ingested
- Civics
- —
Market trends
- HPI YoY
- ▼ -71.86%
- Current HPI
- 294.9807
- Rent YoY
- ▲ 12.08%
- Metro
- Virginia Beach-Norfolk-Newport News, VA-NC
- State GDP YoY
- ▲ 2.40%
- F500 in state
- 50
Industry mix (Fortune 500 HQ in VA)
| Industry | F500 HQs | Revenue |
|---|---|---|
| Aerospace / Defense | 4 | $236B |
|
||
| Technology / Defense | 3 | $32B |
|
||
| Financial Services | 2 | $176B |
|
||
| Utilities | 2 | $27B |
|
||
| Insurance | 2 | $25B |
|
||
| Technology | 2 | $15B |
|
||
Price history
5 events — show timeline
- 2026-04-25 Pending — REINMLS
- 2026-04-15 Contingent — REINMLS
- 2026-04-02 Relisted — REINMLS
- 2026-02-25 Pending — REINMLS
- 2026-02-18 Listed $2,200,000 REINMLS
Property tax history
+5.5%/yrLatest (2025): $23,154 · +17.7% YoY. Source: county tax records.
Cash-flow waterfall
monthlySold comps — $/sqft
last 12 mo · ≤1 miLoading sold comps…