170 Iron Gate Cir · Port Orange, FL
Flood risk 1/10 · Minimal
- FEMA flood zone
- X (unshaded)
- Chance of flooding over 30 yrs
- 0.0%
- Est. flood insurance / yr
- $507 – $1,088
Fire risk 1/10 · Minimal
- Est. fire insurance / yr
- $947 – $1,759
Heat risk 9/10 · Severe
- Hot days now (above 106°F)
- 7 days/yr
- Hot days in 30 yrs
- 20 days/yr
Wind risk 10/10 · Severe
- Chance of severe wind over 30 yrs
- 99.0%
Air-quality risk 2/10 · Minimal
- Unhealthy air days now
- 1 days/yr
- Unhealthy air days in 30 yrs
- 1 days/yr
Risk factors via First Street. Map © Google.
Why this score? — see what drove the C+ grade
The composite is a weighted blend of 9 inputs, each scored 0–100. Each bar is that input's sub-score; the figure is the points it added to the 100-point composite (weight × sub-score).
- Cash flow +26.3/30.0
- DSCR +8.9/10.0
- ARV discount +7.5/15.0
- 1% rule +6.5/10.0
- Livability +4.0/5.0
- Schools +3.9/10.0
- Condition / age +2.5/5.0
- Rent growth +1.8/5.0
- Appreciation +0.0/10.0
$139,900
🖨 Deal sheet (PDF) 📄 Offer letter ✓ Due diligence
Listing remarks MLS
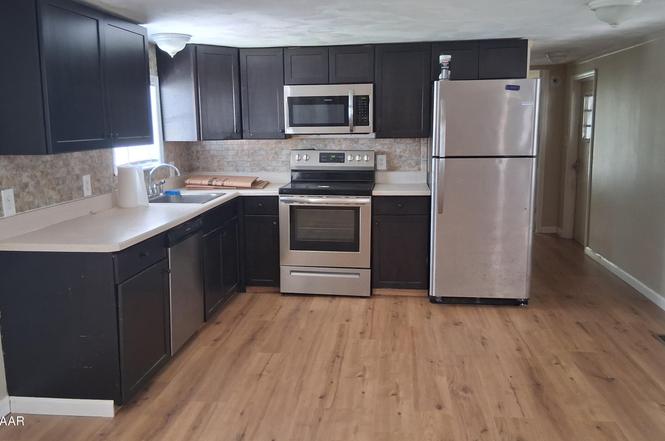
Bank owned single wide mobile home. Renovatd with new flooring, appliances, hot water heater and air conditioner, paint, and some trim. Nice car port, screened front porch and storage area and covered sitting room on carport side. Well kept community of manufactured homes on their own fee simple lots owned by the owners. Homesite ownership included in purchase. This home could be a nice rental or snowbird/vacation home or home for a small family. Within and eighth of a mile to middle school and is located in a nice, established area of Port Orange.
Key facts
- Utility shed
- Newer roof
- Open layout
Tags
Property features AI
Exterior
- Parking: Off-street parking; Other parking
- Utilities: Public water; Public sewer; 100 Amp electrical service; Cable available; Electricity connected; Water connected; Sewer connected
- Home design: Mobile home; Single-story; Residential single family use
- Construction: Vinyl siding; Other construction materials; Metal roof; Pillar/post/pier and stone foundation; Built as a mobile home
- Exterior features: Chain link fence; Public maintained road; City street frontage; Lot approximately 0.11 acres (50 ft x 100 ft)
Interior
- Kitchen: Refrigerator; Microwave; Electric range
- Bedrooms: 2 total rooms
- Flooring: Laminate flooring; Vinyl flooring
- Bathrooms: 2 full bathrooms
- Heating & cooling: Central heating; Electric heating; Heat pump; Central air; Ceiling fans
- Interior features: Ceiling fans; Eat-in kitchen
- Laundry & utility: Washer hookup; Electric dryer hookup; Electric water heater
Neighborhood map
What this means for you Summary
Snapshot
- This is a 2-bed/2.0-bath manufactured listed at $140k.
Deal economics
- At list price, monthly cash flow is $362 ($4k/yr) — positive.
- The deal already cash-flows at list — no discount required.
- Meets the 1% rule at list price ($2k rent vs $140k).
Location & tenants
- Location reads 80/100 on livability (#131 in FL, #1,957 nationally) — a professional / high-income tenant draw. Strengths: housing A+, health & safety A+, cost of living A; Watch: amenities D+, commute D+.
- Volusia (suburban): math 44% / reading 49% proficiency, ranked #47 of 73 in FL (top 64%) — families likely to look elsewhere, expect single-tenant / working-renter base with shorter leases.
- Zoned schools: Sugar Mill Elementary School (math 59% / reading 58%, grade B-, #735 of 2,144 statewide, top 35%, 623 students, 64% FRL); Silver Sands Middle School (math 50% / reading 52%, grade C, #237 of 571 statewide, top 43%, 1,165 students, 54% FRL); Atlantic High School (math 24% / reading 46%, grade F, #379 of 667 statewide, top 58%, 1,266 students, 52% FRL).
- Market conditions: Rents soft (-2.7%/yr); 248 active listings in the ZIP; 19 comparable units currently listed for rent nearby; rentals at typical pace (median 16d on market — plan ~3-4 weeks tenant-placement turnaround); 3,402 units permitted in Volusia County in 2024 (681 in 5+ unit buildings).
Forward outlook
- Local home prices are declining (-3.0%/yr); year-one equity from $967 of loan paydown is wiped out by about $4k of value loss. Plan a longer hold.
- Volusia County population projected at +19% by 2050 — long-run rental-demand tailwind backs the buy-and-hold thesis.
Negotiation context
- Only 6 days on market — expect competitive offers; lowballing is unlikely to land.
- 8 sale attempts since 11y ago with the ask held roughly flat each time — persistent listings suggest the price (not the market) is what's stuck; bring a comps-based counter.
Risks & watch-outs
- Climate carrying-cost: severe wind risk, 99% chance of damaging wind over 30y; extreme-heat days projected 7→20/yr by 2055 (HVAC capex compounding) — expect insurance premiums to compound above CPI over the hold.
Questions for the listing agent
- Is there a deadline driving the sale (1031 exchange, divorce, estate, relocation)? That informs how much negotiation room exists.
- Schools are B-rated — typically a magnet for longer-tenancy family renters. What's the average tenant stay here, and is there a school-zone premium baked into asking?
- What's the average days-on-market for RENTAL listings here right now (not sales)? A rising rental-DOM trend means longer vacancies and softer asking-rent achievability than the comps imply.
- What's the recent tenant-quality profile in this submarket — average credit score on applications, eviction rate, late-payment / NSF rate, and stable-employment percentage? A property-management company in the area should have these aggregated.
- How much new for-sale + rental construction is in the pipeline within 1–3 miles? Heavy new supply typically softens prices + rents 12–24 months out; constrained supply supports both.
Investment metrics
- 1% rule
- 1.15% ✓
- Cap rate
- 9.40%
- Cash-on-cash
- 11.08%
- DSCR
- 1.49
- GRM
- 7.3
CMA / ARV
No comps found within radius.
Projected returns pro-forma
-3.0% appreciation · 0.0% rent growth · sell at horizon
- IRR
- -3.0%
- Equity multiple
- 0.89×
- Total profit
- $-4,335
- Equity at exit
- $20,860
- IRR
- 3.1%
- Equity multiple
- 1.20×
- Total profit
- $7,692
- Equity at exit
- $12,096
Cash invested: $39,172 (down + closing). Projections, not guarantees.
Landlord ↔ Tenant lean methodology
- Overall (STATE)
- 87 Strongly Landlord-Friendly
- State Florida
- 87 Strongly Landlord-Friendly · R+3
- County
- — inherits STATE
- City
- — inherits STATE
ZIP-level market 32129
- Rents YoY
- -2.7%
- Active inventory
- 248
- Price-to-rent
- 7.3×
Monthly cashflow live
- Estimated rent
- $1,602 high interval (Pro) →
- Mortgage (P&I)
- −$734
- Tax from tax record
- −$112 /mo · $1,345/yr
- Insurance
- −$58
- HOA
- −$0
- Vacancy / Maint / Mgmt
- −$336
- Net cashflow
- $362
Break-even live
Sensitivity live
| Price | -10% $441 | -5% $401 | +0% $362 | +5% $322 | +10% $283 |
|---|---|---|---|---|---|
| Rent | -10% $235 | -5% $299 | +0% $362 | +5% $425 | +10% $488 |
| Rate | -1.0pp $432 | -0.5pp $397 | base $362 | +0.5pp $326 | +1.0pp $289 |
UW: 25.0% down · 7.5% · 30yr · 1.5% tax · 5.0% vac · 8.0% maint · 8.0% mgmt
Financing live
Cash to close
- Down payment
- $34,975
- Closing costs
- $4,197
- Reserves months
- —
- Total cash needed
- —
Loan-product check · same deal, 3 products live
Conventional
25% down · 7.5% · 30yr
- Down + closing
- —
- Monthly P&I
- —
- Monthly cashflow
- —
- DSCR
- —
- Eligible?
- —
Personal DTI + credit; lowest rate.
DSCR
20% down · 8.5% · 30yr
- Down + closing
- —
- Monthly P&I
- —
- Monthly cashflow
- —
- DSCR
- —
- Eligible?
- —
No personal income docs; deal must DSCR.
Hard money
10% down · 12.0% · 12mo
- Down + closing
- —
- Monthly P&I
- —
- Monthly cashflow
- —
- DSCR
- —
- Eligible?
- —
Short-term bridge; refi at stabilization.
Rent comps 19 comps
| Address | Beds | Baths | Sqft | Rent | $/sqft | DOM | Units | Dist |
|---|---|---|---|---|---|---|---|---|
| 1152 Old Hammock Rd Unit 1 Port Orange, FL | 1.0 | 1.0 | 600 | $1,295 | $2.16 | 25d | 1 | 0.24mi |
| 980 Canal View Blvd Port Orange, FL | 2.0 | 1.5 | 1024 | $1,448 | $1.41 | 25d | 2 | 0.52mi |
| 1025 Eagle Lake Trl Port Orange, FL | 1.0 | 1.0 | 576 | $1,185 | $2.06 | 25d | 2 | 0.56mi |
| 1206 Deer Springs Rd Port Orange, FL | 2.0 | 2.0 | 1064 | $1,625 | $1.53 | 16d | 1 | 0.62mi |
| 1010 N Swallow Tail Dr Port Orange, FL | 1.0–2.0 | 1.0–2.0 | 893 | $1,574 | $1.76 | 13d | 16 | 0.75mi |
| 958 Village Trl Port Orange, FL | 1.0–2.0 | 1.0–2.0 | 775 | $1,455 | $1.88 | 13d | 12 | 0.87mi |
| 1154 Ashland Ct Port Orange, FL | 3.0 | 2.0 | 1118 | $1,795 | $1.61 | 16d | 1 | 1.01mi |
| 3835 Clyde Morris Blvd Port Orange, FL | 1.0–3.0 | 1.0–2.0 | 1013 | $2,012 | $1.99 | 13d | 17 | 1.02mi |
| 5609 Victoria Gardens Blvd Port Orange, FL | 2.0 | 1.0–1.5 | 1050 | $1,600 | $1.52 | 25d | 7 | 1.04mi |
| 4801 Clyde Morris Blvd Port Orange, FL | 1.0 | 1.0 | 576 | $1,376 | $2.39 | 25d | 5 | 1.04mi |
| 12 Downing Dr Port Orange, FL | 2.0 | 2.0 | 921 | $1,599 | $1.74 | 16d | 1 | 1.06mi |
| 940 Village Trl Unit 4-306 Port Orange, FL | 2.0 | 2.0 | 1006 | $2,000 | $1.99 | 16d | 1 | 1.10mi |
| 4211 New Haven Ct Port Orange, FL | 2.0 | 2.0 | 902 | $2,000 | $2.22 | 25d | 1 | 1.15mi |
| 1270 Reed Canal Rd Port Orange, FL | 1.0–3.0 | 1.0–2.0 | 1001 | $1,746 | $1.74 | 13d | 29 | 1.33mi |
| 1645 Dunlawton Ave Port Orange, FL | 1.0–2.0 | 1.0–2.0 | 894 | $1,593 | $1.78 | 13d | 26 | 1.35mi |
| 3780 Clyde Morris Blvd Port Orange, FL | 2.0–3.0 | 2.0 | 1050 | $1,369 | $1.30 | 13d | 12 | 1.36mi |
| 3900 Yorktowne Blvd Port Orange, FL | 1.0–3.0 | 1.0–2.0 | 1031 | $1,606 | $1.56 | 13d | 19 | 1.37mi |
| 1401 Reed Canal Rd Port Orange, FL | 1.0–3.0 | 1.0–2.0 | 1045 | $1,856 | $1.78 | 16d | 25 | 1.37mi |
| 3307 Oak Trail Run #7 Port Orange, FL | 2.0 | 2.0 | 910 | $1,650 | $1.81 | 25d | 1 | 1.44mi |
Listing history 5 events
-
2026-06-22days on market $139,900 Active 6 DOM
-
2026-06-18days on market $139,900 Active 3 DOM
-
2026-06-17days on market $139,900 Active 2 DOM
-
2026-06-15remarks 699-char remark
-
2026-06-15$139,900 Active 1 DOM
ⓘ Source: listings_history table (triggers on properties + properties_extension) + one-shot
backfill from property_details.listing_events for pre-trigger history.
Tax reassessment forecast FL · Resets to sale price
- Current annual tax
- $1,345 · $112/mo
- Projected year-2 tax
- $1,345 · $112/mo
- Expected delta
- $0/yr ($0/mo · 0.0%)
ⓘ Screening estimate from a state-policy table — verify with the county assessor before closing.
Climate risk First Street
- Flood 1/10 Low FEMA zone X (unshaded) · 0% chance over 30 yrs
- Wildfire 1/10 Low
- Heat 9/10 Extreme 7 d/yr ≥106°F today · 20 d/yr by 30 yrs out
- Wind 10/10 Extreme 99% chance of damaging wind over 30 yrs
- Air quality 2/10 Low 1 unhealthy d/yr today · 1 by 30 yrs out
Nearby sold comps map
Loading sold comps map…
Walkable amenities ~0.75 mi
Loading nearby amenities…
Taxation est. · year 1
- Rental income
- $19,228
- − Mortgage interest
- −$7,837
- − Property taxes
- −$1,345
- − Insurance
- −$700
- − Repairs & maintenance
- −$1,538
- − Management
- −$1,538
- − Depreciation
- −$4,070
- Taxable income
- $2,201
- Est. tax owed @ 24.0%
- −$528
- After-tax cash flow
- $3,814/yr
For passive investors: Depreciation is non-cash, so a rental often shows a tax loss while cash-flowing — sheltering income. Rental losses are passive: they offset passive income freely, and up to $25,000/yr can offset ordinary (W-2) income if you actively participate and your MAGI is under $100k (phasing out to $0 by $150k); unused losses carry forward. On sale, claimed depreciation is recaptured at up to 25%, and gains may owe capital-gains tax (a 1031 exchange can defer both). Figures are a year-1 estimate at your 24.0% rate — not tax advice; consult a CPA.
Schools (NCES district)
- District
- Volusia
- NCES district ID
- 1201920
- Math proficiency
- 44% ▼ -9.00%
- Reading proficiency
- 49% ▼ -3.00%
- Median HH income
- $42,946
- Composite
- 39.2/100
- National rank
- #4019
- State rank
- #47 of 73 in FL
Livability — Port Orange
- Score
- 80/100
- State rank
- #131
- US rank
- #1957
Category grades
Schools grade is shown separately in the Schools card above.
Census & demographics
- Census place
- Port Orange, FL
- County
- Volusia County · 556,871 people
- City population
- 75,051
- Metro
- Deltona-Daytona Beach-Ormond Beach, FL
- Population (ZIP)
- 23,195
- Household income
- $67,924
- Rent vs Own
- Severe rent burden
- 602.0
Population outlook (Volusia County) Hauer SSP2
- Today (2025)
- 572,749 people
- By 2030
- 598,695 · +4.5%
- By 2040
- 644,880 · +12.6%
- By 2050
- 681,451 · +19.0%
- By 2075
- 759,957 · +32.7%
- By 2100
- 778,902 · +36.0%
Race, ethnicity, and origin ACS 2023
- Neighborhood character
- Predominantly White (80%)
- Race & ethnicity
- White 80% Hispanic / Latino 7% Two or more races 6% Black 6% Asian 3%
- Hispanic origin (detail)
- Mexican 2% Puerto Rican 3%
- Common ancestry
- Lithuanian 4% Iranian 3% Romanian 3%
- Foreign-born
- 9% · Canada, South Korea, China
- Languages at home
- 87% English-only · Spanish 4% German/W. Germanic 3% Arabic 1%
Political lean MEDSL · Volusia
- 2024 margin
- Strong R (+21.8) · D 38.7% · R 60.5%
- 2008→2024 swing
- -27.4pp toward R · 2008: 5.7pp · 2024: -21.8pp
- All cycles
- 2024: R+21.8 2020: R+14.1 2016: R+13.1 2012: R+1.2 2008: D+5.7
Not yet ingested
- Civics
- —
Market trends
- HPI YoY
- ▼ -234.13%
- Current HPI
- 310.0285
- Rent YoY
- ▼ -2.71%
- Metro
- Deltona-Daytona Beach-Ormond Beach, FL
- State GDP YoY
- ▲ 3.28%
- F500 in state
- 36
Industry mix (Fortune 500 HQ in FL)
| Industry | F500 HQs | Revenue |
|---|---|---|
| Industrial Technology | 2 | $29B |
|
||
| Insurance | 2 | $17B |
|
||
| Retail | 1 | $60B |
|
||
| Technology Distribution | 1 | $58B |
|
||
| Homebuilding | 1 | $35B |
|
||
| Technology Manufacturing | 1 | $35B |
|
||
Price history
+311.5% since first listed27 events — show timeline
- 2026-06-13 Listed $139,900 Daytona MLS
- 2022-05-24 Sold (MLS) $135,000 Daytona MLS
- 2022-05-20 Sold (MLS) $135,000 Stellar MLS as Distributed by MLS Grid
- 2022-05-11 Contingent — Daytona MLS
- 2022-05-10 Pending — Stellar MLS as Distributed by MLS Grid
- 2022-04-18 Listed $150,000 Daytona MLS
- 2022-04-06 Listed $150,000 Stellar MLS as Distributed by MLS Grid
- 2019-08-28 Sold (Public Records) $85,000 Public Records
- 2019-08-26 Sold (MLS) $85,000 Daytona MLS
- 2019-07-25 Contingent — Daytona MLS
- 2019-07-08 Relisted — Daytona MLS
- 2019-06-28 Contingent — Daytona MLS
- 2019-06-21 Price Changed $85,000 Daytona MLS
- 2019-06-21 Listed $80,000 Daytona MLS
- 2019-04-22 Listing Removed — Stellar MLS as Distributed by MLS Grid
- 2018-12-04 Listed $85,000 Stellar MLS as Distributed by MLS Grid
- 2018-05-02 Sold (Public Records) $78,000 Public Records
- 2018-04-27 Sold (MLS) $78,000 Daytona MLS
- 2018-04-09 Pending — Daytona MLS
- 2018-04-05 Contingent — Daytona MLS
- 2018-03-23 Listed $87,900 Daytona MLS
- 2015-02-06 Listing Removed — Daytona MLS
- 2015-02-06 Sold (MLS) $17,650 Daytona MLS
- 2015-01-31 Pending — Daytona MLS
- 2015-01-28 Price Changed $24,900 Daytona MLS
- 2015-01-10 Listed $29,900 Daytona MLS
- 1995-10-24 Sold (Public Records) $34,000 Public Records
Property tax history
+7.9%/yrLatest (2025): $1,345 · +0.9% YoY. Source: county tax records.
Cash-flow waterfall
monthlySold comps — $/sqft
last 12 mo · ≤1 miLoading sold comps…