 🏢 Co-op
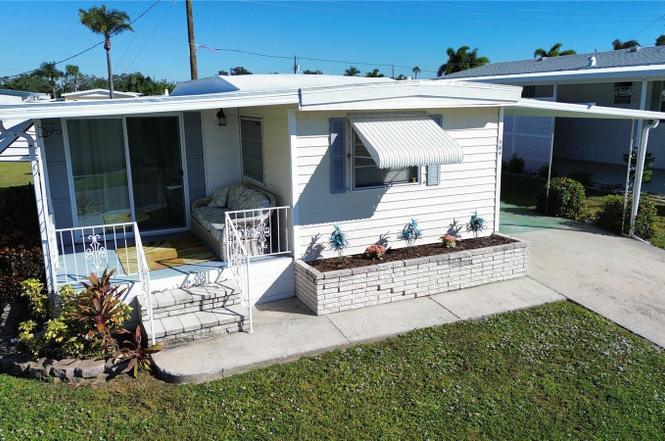
504 49th C Avenue Dr E · South Bradenton, FL
Flood risk 1/10 · Minimal
- FEMA flood zone
- X (unshaded)
- Chance of flooding over 30 yrs
- 0.0%
- Est. flood insurance / yr
- $507 – $1,088
Fire risk 1/10 · Minimal
- Est. fire insurance / yr
- $947 – $1,759
Heat risk 10/10 · Severe
- Hot days now (above 107°F)
- 6 days/yr
- Hot days in 30 yrs
- 25 days/yr
Wind risk 10/10 · Severe
- Chance of severe wind over 30 yrs
- 99.0%
Air-quality risk 3/10 · Minor
- Unhealthy air days now
- 2 days/yr
- Unhealthy air days in 30 yrs
- 2 days/yr
Risk factors via First Street. Map © Google.
Why this score? — see what drove the C grade
The composite is a weighted blend of 9 inputs, each scored 0–100. Each bar is that input's sub-score; the figure is the points it added to the 100-point composite (weight × sub-score).
- Cash flow +25.1/30.0
- 1% rule +10.0/10.0
- DSCR +8.2/10.0
- Schools +4.4/10.0
- Livability +3.9/5.0
- Condition / age +2.5/5.0
- Rent growth +2.3/5.0
- ARV discount +0.0/15.0
- Appreciation +0.0/10.0
$114,500
🖨 Deal sheet 📄 Offer letter ✓ Due diligence
Listing remarks
Now at a new, improved price. Your Florida lifestyle just became even more affordable. This beautifully updated 2 bedroom, 2 bathroom turnkey furnished mobile home in the highly sought after Golf Lakes Cooperative Community is now priced to sell. With major upgrades already completed, this home offers exceptional value in one of the area’s most desirable 55 plus communities. Recent improvements include a new roof in 2024 with transferable warranty, new kitchen cabinets with soft close doors and drawers and a lazy Susan, new hot water heater in 2023, and a new guest bath vanity with updated countertops in both the kitchen and guest bath. Every detail has been thoughtfully refreshed so
Key facts
- Covered carport
- New hot water heater
- Screened lanai
Tags
Property features AI
Finance
- Other: Turnkey furnished; Total acreage: under 1/4 acre (approx. 0.09 acres); Paved road frontage; Water view: Pond
- Financial info: Lease restrictions apply
- HOA & community: Has HOA; monthly fee $337.90 (quarterly association fee $1,013.71); Association requires approval and fees are required; Association amenities: Clubhouse, Fitness Center, Gated community, Golf Course access, Laundry, Pickleball courts, Pool, Recreational facilities, Shuffleboard, Tennis courts; Community features: Buyer approval required, Clubhouse, Fitness Center, Golf carts allowed, Golf, Pool, Sidewalks, Tennis courts; Senior community; On-site property manager; Pets not allowed
Exterior
- Parking: Covered parking; Carport (1 space)
- Utilities: Public water; Public sewer; Cable connected; Electricity connected; Sewer connected; Water connected
- Home design: Mobile home (Single Wide); One story; Faces south; Residential property
- Construction: Vinyl siding; Membrane roof; Estimated living area 880 sq ft
- Exterior features: Awning(s); Sliding doors; Exterior storage; Other exterior features
Interior
- Kitchen: Dishwasher; Microwave; Range; Refrigerator; Stone counters; Eat-in kitchen
- Bedrooms: 2 bedrooms (one-level home)
- Flooring: Carpet
- Bathrooms: 2 full bathrooms
- Heating & cooling: Central heating; Central air conditioning
- Interior features: Eat-in kitchen; Open floor plan; Split bedroom layout; Stone countertops; Thermostat; Window treatments
- Laundry & utility: Washer; Dryer; Electric water heater; Laundry features: Other
Neighborhood map
What this means for you Summary
Snapshot
- This is a 2-bed/1.5-bath manufactured listed at $114k.
Deal economics
- At list price, monthly cash flow is $253 ($3k/yr) — positive.
- The deal already cash-flows at list — no discount required.
- Meets the 1% rule at list price ($2k rent vs $114k).
- Recommended offer: $101k (12.0% below list) — sets the bar for market timing.
- Cap rate 8.9% vs local median 4.1% in South Bradenton — top-decile yield for the area; either an underpriced asset or a hidden risk that comps aren't pricing in. Stress-test before assuming the spread holds.
Location & tenants
- Location reads 77/100 on livability (#195 in FL, #3,092 nationally) — a middle-class / working-renter tenant base. Strengths: cost of living A+, housing A+, health & safety A+; Watch: amenities C-, crime D+, commute F.
- Manatee (suburban): math 54% / reading 50% proficiency, ranked #26 of 73 in FL (top 36%) — acceptable for families but not a draw, mixed tenant base, ~2y average lease.
- Market conditions: Rents soft (-1.0%/yr); 384 active listings in the ZIP; 12 comparable units currently listed for rent nearby; rentals at typical pace (median 24d on market — plan ~3-4 weeks tenant-placement turnaround); 7,472 units permitted in Manatee County in 2024 (1,782 in 5+ unit buildings).
Forward outlook
- Local home prices are declining (-3.0%/yr); year-one equity from $792 of loan paydown is wiped out by about $3k of value loss. Plan a longer hold.
- Manatee County population projected at +43% by 2050 — long-run rental-demand tailwind backs the buy-and-hold thesis.
Negotiation context
- It's been on market 224 days — a 12% lower offer ($101k) is reasonable based on typical stale-listing flexibility.
Risks & watch-outs
- Climate carrying-cost: severe wind risk, 99% chance of damaging wind over 30y; extreme-heat days projected 6→25/yr by 2055 (HVAC capex compounding) — expect insurance premiums to compound above CPI over the hold.
Questions for the listing agent
- It's been on market 224 days. Have you received any prior offers? Is the seller open to a 12% concession, seller financing, or rate buy-down credit?
- Built in 1969 — when were the roof, HVAC, electrical panel, plumbing, and water heater last replaced?
- What does the HOA fee cover, when was the last increase, and are there any pending special assessments or reserve-fund shortfalls?
- Why hasn't it sold? Are there any deal-killer items the seller is aware of (foundation, flood, title, zoning, code violations)?
- Is there a deadline driving the sale (1031 exchange, divorce, estate, relocation)? That informs how much negotiation room exists.
- Schools are B-rated — typically a magnet for longer-tenancy family renters. What's the average tenant stay here, and is there a school-zone premium baked into asking?
- Crime grade is D in this area — have there been break-ins, vandalism, or insurance claims at this property in the last 3 years? What carrier currently insures it and at what premium?
- What's the average days-on-market for RENTAL listings here right now (not sales)? A rising rental-DOM trend means longer vacancies and softer asking-rent achievability than the comps imply.
- What's the recent tenant-quality profile in this submarket — average credit score on applications, eviction rate, late-payment / NSF rate, and stable-employment percentage? A property-management company in the area should have these aggregated.
- How much new for-sale + rental construction is in the pipeline within 1–3 miles? Heavy new supply typically softens prices + rents 12–24 months out; constrained supply supports both.
Investment metrics
- 1% rule
- 1.52% ✓
- Cap rate
- 8.95%
- Cash-on-cash
- 9.49%
- DSCR
- 1.42
- GRM
- 5.5
CMA / ARV
- ARV (on-the-fly)
- $81,312
- Comps found
- 8
Show comp detail 8 sales within ~0.75 mi
| Address | Dist | Beds/Ba | Sqft | Sold | Price | $/sf | Match |
|---|---|---|---|---|---|---|---|
| 302 52nd Avenue Ter E | 0.36mi | 2/2.0 | 728 (+8%) | 1mo | $170,000 | $234 | 66 |
| 214 52nd Avenue Dr W | 0.49mi | 3/1.5 (+1) | 728 (+8%) | 3mo | $87,900 | $121 | 56 |
| 108 50th Avenue Dr W | 0.34mi | 1/1.0 (-1) | 612 (-9%) | 10mo | $30,000 | $49 | 54 |
| 808 53rd Ave E Unit 226L | 0.42mi | 2/1.5 | 768 (+14%) | 10mo | $128,750 | $168 | 49 |
| 403 51st Avenue Dr W | 0.50mi | 1/1.0 (-1) | 740 (+10%) | 8mo | $37,000 | $50 | 46 |
| 719 50th Avenue Ter W | 0.73mi | 2/1.5 | 770 (+15%) | 3mo | $95,000 | $123 | 39 |
| 718 50th Avenue Dr W | 0.72mi | 1/2.0 (-1) | 724 (+8%) | 10mo | $49,000 | $68 | 39 |
| 4111 Palmwood | 0.74mi | 1/2.0 (-1) | 572 (-15%) | 19mo | $16,500 | $29 | 18 |
Match score weights: distance 35% · size 25% · config 20% · recency 20%. Top-matched comps best support the ARV.
Projected returns pro-forma
-3.0% appreciation · 0.0% rent growth · sell at horizon
- IRR
- -6.4%
- Equity multiple
- 0.77×
- Total profit
- $-7,290
- Equity at exit
- $17,072
- IRR
- -2.5%
- Equity multiple
- 0.86×
- Total profit
- $-4,376
- Equity at exit
- $9,900
Cash invested: $32,060 (down + closing). Projections, not guarantees.
Landlord ↔ Tenant lean methodology
- Overall (STATE)
- 87 Strongly Landlord-Friendly
- State Florida
- 87 Strongly Landlord-Friendly · R+3
- County
- — inherits STATE
- City
- — inherits STATE
ZIP-level market 34203
- Home prices YoY
- -24.5%
- Rents YoY
- -1.0%
- Active inventory
- 384
- Price-to-rent
- 5.5×
Monthly cashflow live
- Estimated rent
- $1,744 high interval (Pro) →
- Mortgage (P&I)
- −$600
- Tax from tax record
- −$139 /mo · $1,673/yr
- Insurance
- −$48
- HOA
- −$337
- Vacancy / Maint / Mgmt
- −$366
- Net cashflow
- $253
Break-even live
UW: 25.0% down · 7.5% · 30yr · 1.5% tax · 5.0% vac · 8.0% maint · 8.0% mgmt
Financing live
Cash to close
- Down payment
- $28,625
- Closing costs
- $3,435
- Reserves months
- —
- Total cash needed
- —
Loan-product check · same deal, 3 products live
Conventional
25% down · 7.5% · 30yr
- Down + closing
- —
- Monthly P&I
- —
- Monthly cashflow
- —
- DSCR
- —
- Eligible?
- —
Personal DTI + credit; lowest rate.
DSCR
20% down · 8.5% · 30yr
- Down + closing
- —
- Monthly P&I
- —
- Monthly cashflow
- —
- DSCR
- —
- Eligible?
- —
No personal income docs; deal must DSCR.
Hard money
10% down · 12.0% · 12mo
- Down + closing
- —
- Monthly P&I
- —
- Monthly cashflow
- —
- DSCR
- —
- Eligible?
- —
Short-term bridge; refi at stabilization.
Rent comps 12 comps
| Address | Beds | Baths | Sqft | Rent | $/sqft | DOM | Units | Dist |
|---|---|---|---|---|---|---|---|---|
| 4903 2nd B St E Bradenton, FL | 2.0 | 2.0 | 624 | $2,400 | $3.85 | 23d | 1 | 0.25mi |
| 110 52nd Avenue Ter E Bradenton, FL | 2.0 | 1.5 | 684 | $1,450 | $2.12 | 23d | 1 | 0.42mi |
| 205 52nd Avenue Dr W Bradenton, FL | 1.0 | 1.0 | 528 | $1,200 | $2.27 | 23d | 1 | 0.47mi |
| 304 47th Avenue Dr W #112 Bradenton, FL | 1.0 | 1.0 | 725 | $1,200 | $1.66 | 23d | 1 | 0.61mi |
| 1345 301 Blvd E Bradenton, FL | 1.0–3.0 | 1.0–2.0 | 872 | $1,320 | $1.51 | 23d | 9 | 0.66mi |
| 4507 3rd Street Cir W #280 Bradenton, FL | 1.0 | 1.0 | 660 | $1,300 | $1.97 | 16d | 1 | 0.66mi |
| 707 50th Ave W Bradenton, FL | 2.0 | 1.0 | 730 | $1,150 | $1.58 | 23d | 1 | 0.71mi |
| 915 50th Avenue Plz W Bradenton, FL | 2.0 | 1.0 | 700 | $1,200 | $1.71 | 23d | 1 | 0.86mi |
| 350 34th Avenue Dr E Bradenton, FL | 1.0–3.0 | 1.0–2.0 | 893 | $1,335 | $1.49 | 1d | 6 | 1.09mi |
| 616 33rd Ave E Bradenton, FL | 2.0 | 2.0 | 750 | $1,600 | $2.13 | 23d | 1 | 1.21mi |
| 5531 16th St W Unit 5537 Bradenton, FL | 2.0 | 1.0 | 750 | $1,650 | $2.20 | 3d | 1 | 1.42mi |
| 1308 36th Ave W Bradenton, FL | 1.0 | 1.0 | 715 | $1,199 | $1.68 | 23d | 1 | 1.49mi |
HOA detail
- Monthly dues
- $337 · $4,044/yr
- Likely covers
- water
Listing history 23 events
-
2026-06-18days on market $114,500 Active 224 DOM
-
2026-06-17days on market $114,500 Active 223 DOM
-
2026-06-16days on market $114,500 Active 222 DOM
-
2026-06-15days on market $114,500 Active 221 DOM
-
2026-06-13days on market $114,500 Active 219 DOM
-
2026-06-13days on market $114,500 Active 218 DOM
-
2026-06-10days on market $114,500 Active 216 DOM
-
2026-06-09days on market $114,500 Active 215 DOM
-
2026-06-08days on market $114,500 Active 214 DOM
-
2026-06-08days on market $114,500 Active 213 DOM
-
2026-06-03days on market $114,500 Active 209 DOM
-
2026-06-02days on market $114,500 Active 208 DOM
-
2026-06-01days on market $114,500 Active 207 DOM
-
2026-05-31days on market $114,500 Active 206 DOM
-
2026-03-28price $114,500
-
2026-02-11price $119,000
-
2025-11-06$125,000 Active
-
2023-04-03soldstatus $125,000
-
2020-01-17soldstatus $50,000
-
2015-06-03soldstatus $50,000
-
1998-06-05soldstatus $51,900
-
1991-06-03soldstatus $35,000
-
1987-03-30soldstatus $14,000,000
ⓘ Source: listings_history table (triggers on properties + properties_extension) + one-shot
backfill from property_details.listing_events for pre-trigger history.
Tax reassessment forecast FL · Resets to sale price
- Current annual tax
- $1,673 · $139/mo
- Projected year-2 tax
- $1,673 · $139/mo
- Expected delta
- $0/yr ($0/mo · 0.0%)
ⓘ Screening estimate from a state-policy table — verify with the county assessor before closing.
Climate risk First Street
- Flood 1/10 Low FEMA zone X (unshaded) · 0% chance over 30 yrs
- Wildfire 1/10 Low
- Heat 10/10 Extreme 6 d/yr ≥107°F today · 25 d/yr by 30 yrs out
- Wind 10/10 Extreme 99% chance of damaging wind over 30 yrs
- Air quality 3/10 Moderate 2 unhealthy d/yr today · 2 by 30 yrs out
Nearby sold comps map
Loading sold comps map…
Walkable amenities ~0.75 mi
Loading nearby amenities…
Taxation est. · year 1
- Rental income
- $20,932
- − Mortgage interest
- −$6,414
- − Property taxes
- −$1,673
- − Insurance
- −$572
- − Repairs & maintenance
- −$1,675
- − Management
- −$1,675
- − HOA
- −$4,044
- − Depreciation
- −$3,331
- Taxable income
- $1,549
- Est. tax owed @ 24.0%
- −$372
- After-tax cash flow
- $2,670/yr
For passive investors: Depreciation is non-cash, so a rental often shows a tax loss while cash-flowing — sheltering income. Rental losses are passive: they offset passive income freely, and up to $25,000/yr can offset ordinary (W-2) income if you actively participate and your MAGI is under $100k (phasing out to $0 by $150k); unused losses carry forward. On sale, claimed depreciation is recaptured at up to 25%, and gains may owe capital-gains tax (a 1031 exchange can defer both). Figures are a year-1 estimate at your 24.0% rate — not tax advice; consult a CPA.
Schools (NCES district)
- District
- Manatee
- NCES district ID
- 1201230
- Math proficiency
- 54% ▼ -6.00%
- Reading proficiency
- 50% ▼ -2.00%
- Median HH income
- $49,607
- Composite
- 44.43/100
- National rank
- #2806
- State rank
- #26 of 73 in FL
Livability — South Bradenton
- Score
- 77/100
- State rank
- #195
- US rank
- #3092
Category grades
Schools grade is shown separately in the Schools card above.
Census & demographics
- County
- Manatee County · 416,364 people
- Metro
- North Port-Sarasota-Bradenton, FL
- Population (ZIP)
- 40,618
- Household income
- $70,761
- Rent vs Own
- Severe rent burden
- 1469.0
Population outlook (Manatee County) Hauer SSP2
- Today (2025)
- 447,342 people
- By 2030
- 488,911 · +9.3%
- By 2040
- 567,934 · +27.0%
- By 2050
- 637,995 · +42.6%
- By 2075
- 781,970 · +74.8%
- By 2100
- 848,272 · +89.6%
Race, ethnicity, and origin ACS 2023
- Neighborhood character
- Predominantly White (65%)
- Race & ethnicity
- White 65% Hispanic / Latino 19% Two or more races 12% Black 9% Asian 5%
- Hispanic origin (detail)
- Mexican 9% Puerto Rican 3% Cuban 2% Dominican 1%
- Common ancestry
- Lithuanian 3% Romanian 3% Slovak 2%
- Foreign-born
- 17% · Canada, Vietnam, Dominican Republic
- Languages at home
- 76% English-only · Spanish 16% Vietnamese 2% Other Indo-European 1%
Political lean MEDSL · Manatee
- 2024 margin
- Strong R (+23.5) · D 37.9% · R 61.4%
- 2008→2024 swing
- -16.5pp toward R · 2008: -7.0pp · 2024: -23.5pp
- All cycles
- 2024: R+23.5 2020: R+16.1 2016: R+17.1 2012: R+12.5 2008: R+7.0
Not yet ingested
- Civics
- —
Market trends
- HPI YoY
- ▼ -95.87%
- Current HPI
- 295.8871
- Rent YoY
- ▼ -0.97%
- Metro
- North Port-Sarasota-Bradenton, FL
- State GDP YoY
- ▲ 3.28%
- F500 in state
- 36
Industry mix (Fortune 500 HQ in FL)
| Industry | F500 HQs | Revenue |
|---|---|---|
| Industrial Technology | 2 | $29B |
|
||
| Insurance | 2 | $17B |
|
||
| Retail | 1 | $60B |
|
||
| Technology Distribution | 1 | $58B |
|
||
| Homebuilding | 1 | $35B |
|
||
| Technology Manufacturing | 1 | $35B |
|
||
Price history
-99.2% since first listed9 events — show timeline
- 2026-03-28 Price Changed $114,500 Stellar MLS as Distributed by MLS Grid
- 2026-02-11 Price Changed $119,000 Stellar MLS as Distributed by MLS Grid
- 2025-11-06 Listed $125,000 Stellar MLS as Distributed by MLS Grid
- 2023-04-03 Sold (Public Records) $125,000 Public Records
- 2020-01-17 Sold (Public Records) $50,000 Public Records
- 2015-06-03 Sold (Public Records) $50,000 Public Records
- 1998-06-05 Sold (Public Records) $51,900 Public Records
- 1991-06-03 Sold (Public Records) $35,000 Public Records
- 1987-03-30 Sold (Public Records) $14,000,000 Public Records
Property tax history
+10.0%/yrLatest (2025): $1,673 · -2.2% YoY. Source: county tax records.
Cash-flow waterfall
monthlySold comps — $/sqft
last 12 mo · ≤1 miLoading sold comps…