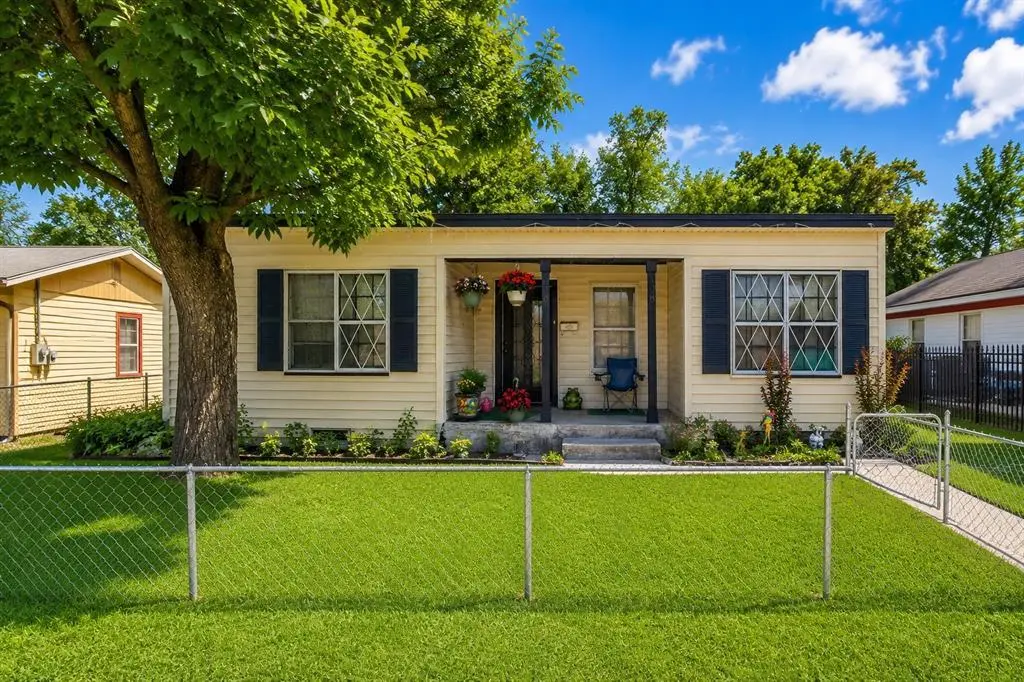
108 Laroe St · Terrell, TX
Flood risk 1/10 · Minimal
- FEMA flood zone
- X (unshaded)
- Chance of flooding over 30 yrs
- 0.0%
- Est. flood insurance / yr
- $507 – $1,088
Fire risk 6/10 · Moderate
- Est. fire insurance / yr
- $1,222 – $2,270
Heat risk 7/10 · Major
- Hot days now (above 109°F)
- 7 days/yr
- Hot days in 30 yrs
- 23 days/yr
Wind risk 6/10 · Moderate
- Chance of severe wind over 30 yrs
- 27.0%
Air-quality risk 2/10 · Minimal
- Unhealthy air days now
- 1 days/yr
- Unhealthy air days in 30 yrs
- 1 days/yr
Risk factors via First Street. Map © Google.
Why this score? — see what drove the B- grade
The composite is a weighted blend of 9 inputs, each scored 0–100. Each bar is that input's sub-score; the figure is the points it added to the 100-point composite (weight × sub-score).
- Cash flow +26.5/30.0
- ARV discount +15.0/15.0
- DSCR +9.0/10.0
- 1% rule +7.2/10.0
- Livability +3.4/5.0
- Rent growth +2.5/5.0
- Condition / age +2.5/5.0
- Schools +2.4/10.0
- Appreciation +0.0/10.0
$139,900
🖨 Deal sheet 📄 Offer letter ✓ Due diligence
Listing remarks
Welcome to this cozy and inviting cottage nestled in the heart of a peaceful small town. Full of character and warmth, this charming home offers a comfortable layout and a welcoming atmosphere that's perfect for first-time buyers, downsizers, or anyone seeking a simpler lifestyle. Enjoy quiet mornings on the porch, a manageable yard with room for gardening or entertaining, and the convenience of being just minutes from local shops, restaurants, parks, and community events. Combining small-town charm with everyday comfort, this delightful cottage is ready to welcome you home.
Key facts
- Manageable yard
- Comfortable layout
- Room for gardening
Tags
Property features AI
Finance
- Other: Parcel number 42733
- Financial info: Treat as clear loan type; No second mortgage indicated
- HOA & community: No homeowners association
Exterior
- Parking: Driveway
- Utilities: City water; City sewer; Not in a municipal utility district
- Home design: Single-family residence; Residential property; Property is attached; Built in 1947
- Construction: Year built 1947
- Exterior features: Lot under 0.5 acre (about 0.193 acres); Subdivision: Virginia Heights; Directions: From I20: Exit and head N on 34 or S Virginia St. Left on Laroe St. 108 Laroe on Left.
Interior
- Kitchen: Dishwasher; Disposal; Electric range
- Bedrooms: 3 bedrooms (all on the main level); Each bedroom about 10 x 10
- Bathrooms: 1 full bathroom; 1 half bathroom (2 total bathrooms)
- Interior features: One-level layout; 4 total rooms; Living area approximately 1222
Neighborhood map
What this means for you Summary
Snapshot
- This is a 3-bed/2.0-bath single-family listed at $140k.
Deal economics
- At list price, monthly cash flow is $369 ($4k/yr) — positive.
- The deal already cash-flows at list — no discount required.
- Meets the 1% rule at list price ($2k rent vs $140k).
- Recommended offer: $138k (1.5% below list) — sets the bar for market timing.
- Cap rate 9.5% vs local median 3.8% in Terrell — top-decile yield for the area; either an underpriced asset or a hidden risk that comps aren't pricing in. Stress-test before assuming the spread holds.
Location & tenants
- Location reads 67/100 on livability (#520 in TX) — a middle-class / working-renter tenant base. Strengths: cost of living A+, housing A+; Watch: amenities C-, employment D, commute F.
- Terrell ISD (town): math 25% / reading 30% proficiency, ranked #677 of 826 in TX (top 82%) — low school quality limits family demand, transient renter base, plan for 1-2y turnover; 68% free/reduced lunch — lower-income household profile, screen leases tightly.
- Zoned schools: W H Burnett El (329 students, 79% FRL).
- Market conditions: 372 active listings in the ZIP; 14 comparable units currently listed for rent nearby; rentals at typical pace (median 18d on market — plan ~3-4 weeks tenant-placement turnaround); 1,747 units permitted in Kaufman County in 2024 (180 in 5+ unit buildings).
Forward outlook
- Local home prices are declining (-3.0%/yr); year-one equity from $967 of loan paydown is wiped out by about $4k of value loss. Plan a longer hold.
- Kaufman County population projected at +43% by 2050 — long-run rental-demand tailwind backs the buy-and-hold thesis.
- At projected returns (-3.0% appreciation + 3.0% rent growth), your $39k cash investment doubles in ~10 years — after that, you're playing with house money.
Negotiation context
- It's been on market 15 days — a 2% lower offer ($138k) is reasonable based on typical stale-listing flexibility.
Risks & watch-outs
- Watch-outs: built in 1947 — expect roof / HVAC / electrical / plumbing capex.
- Climate carrying-cost: major wind risk, 27% chance of damaging wind over 30y; major wildfire risk; extreme-heat days projected 7→23/yr by 2055 (HVAC capex compounding) — expect insurance premiums to compound above CPI over the hold.
Questions for the listing agent
- Built in 1947 — when were the roof, HVAC, electrical panel, plumbing, and water heater last replaced?
- Is there a deadline driving the sale (1031 exchange, divorce, estate, relocation)? That informs how much negotiation room exists.
- Schools are F-rated, which usually means shorter tenancies and higher turnover. Who's the typical renter profile here, and what's been the actual vacancy rate?
- What's the average days-on-market for RENTAL listings here right now (not sales)? A rising rental-DOM trend means longer vacancies and softer asking-rent achievability than the comps imply.
- What's the recent tenant-quality profile in this submarket — average credit score on applications, eviction rate, late-payment / NSF rate, and stable-employment percentage? A property-management company in the area should have these aggregated.
- How much new for-sale + rental construction is in the pipeline within 1–3 miles? Heavy new supply typically softens prices + rents 12–24 months out; constrained supply supports both.
Investment metrics
- 1% rule
- 1.22% ✓
- Cap rate
- 9.46%
- Cash-on-cash
- 11.32%
- DSCR
- 1.50
- GRM
- 6.8
CMA / ARV
- ARV (on-the-fly)
- $221,182
- Comps found
- 12
Show comp detail 12 sales within ~0.75 mi
| Address | Dist | Beds/Ba | Sqft | Sold | Price | $/sf | Match |
|---|---|---|---|---|---|---|---|
| 904 N Virginia St | 0.17mi | 3/2.0 | 1,140 (-7%) | 1mo | $184,900 | $162 | 80 |
| 916 N Virginia St | 0.20mi | 3/2.0 | 1,176 (-4%) | 7mo | $239,500 | $204 | 78 |
| 1110 N Catherine St | 0.27mi | 3/2.0 | 1,312 (+7%) | 4mo | $199,000 | $152 | 72 |
| 307 E Mccoulskey St | 0.19mi | 3/1.5 | 1,100 (-10%) | 3mo | $199,000 | $181 | 70 |
| 313 Grace Ln | 0.66mi | 3/2.0 | 1,224 (+0%) | 0mo | $239,900 | $196 | 69 |
| 110 Spring Creek Ln | 0.62mi | 3/2.0 | 1,217 (-0%) | 4mo | $249,900 | $205 | 67 |
| 313 Wall St | 0.48mi | 3/1.5 | 1,242 (+2%) | 9mo | $215,000 | $173 | 65 |
| 201 Pecan St | 0.46mi | 2/1.0 (-1) | 1,215 (-1%) | 5mo | $229,900 | $189 | 64 |
| 238 Willow Creek Ln | 0.66mi | 3/2.0 | 1,306 (+7%) | 1mo | $245,000 | $188 | 57 |
| 101 Shady Creek Ln | 0.72mi | 3/2.0 | 1,349 (+10%) | 3mo | $240,000 | $178 | 47 |
| 909 E High St | 0.61mi | 3/1.0 | 1,044 (-15%) | 1mo | $145,000 | $139 | 42 |
| 808 E High St | 0.62mi | 2/1.0 (-1) | 1,056 (-14%) | 7mo | $149,900 | $142 | 34 |
Match score weights: distance 35% · size 25% · config 20% · recency 20%. Top-matched comps best support the ARV.
Projected returns pro-forma
-3.0% appreciation · 3.0% rent growth · sell at horizon
- IRR
- 0.6%
- Equity multiple
- 1.02×
- Total profit
- $896
- Equity at exit
- $20,860
- IRR
- 10.3%
- Equity multiple
- 1.80×
- Total profit
- $31,225
- Equity at exit
- $12,096
Cash invested: $39,172 (down + closing). Projections, not guarantees.
Landlord ↔ Tenant lean methodology
- Overall (STATE)
- 87 Strongly Landlord-Friendly
- State Texas
- 87 Strongly Landlord-Friendly · R+5
- County
- — inherits STATE
- City
- — inherits STATE
ZIP-level market 75160
- Home prices YoY
- -13.2%
- Active inventory
- 372
- Price-to-rent
- 6.8×
Monthly cashflow live
- Estimated rent
- $1,712 high interval (Pro) →
- Mortgage (P&I)
- −$734
- Tax from tax record
- −$191 /mo · $2,290/yr
- Insurance
- −$58
- HOA
- −$0
- Vacancy / Maint / Mgmt
- −$359
- Net cashflow
- $369
Break-even live
UW: 25.0% down · 7.5% · 30yr · 1.5% tax · 5.0% vac · 8.0% maint · 8.0% mgmt
Financing live
Cash to close
- Down payment
- $34,975
- Closing costs
- $4,197
- Reserves months
- —
- Total cash needed
- —
Loan-product check · same deal, 3 products live
Conventional
25% down · 7.5% · 30yr
- Down + closing
- —
- Monthly P&I
- —
- Monthly cashflow
- —
- DSCR
- —
- Eligible?
- —
Personal DTI + credit; lowest rate.
DSCR
20% down · 8.5% · 30yr
- Down + closing
- —
- Monthly P&I
- —
- Monthly cashflow
- —
- DSCR
- —
- Eligible?
- —
No personal income docs; deal must DSCR.
Hard money
10% down · 12.0% · 12mo
- Down + closing
- —
- Monthly P&I
- —
- Monthly cashflow
- —
- DSCR
- —
- Eligible?
- —
Short-term bridge; refi at stabilization.
Rent comps 14 comps
| Address | Beds | Baths | Sqft | Rent | $/sqft | DOM | Units | Dist |
|---|---|---|---|---|---|---|---|---|
| 920 N Virginia St Terrell, TX | 2.0 | 1.0 | 924 | $1,650 | $1.79 | 16d | 1 | 0.23mi |
| 904 N Frances St Unit A Terrell, TX | 2.0 | 1.0 | 732 | $1,350 | $1.84 | 10d | 1 | 0.35mi |
| 203 E Brin St Terrell, TX | 2.0 | 2.0 | 1472 | $1,500 | $1.02 | 17d | 1 | 0.47mi |
| 102 Rock Creek Ln Terrell, TX | 3.0 | 2.0 | 1262 | $1,850 | $1.47 | 24d | 1 | 0.55mi |
| 116 N Island Dr Terrell, TX | 3.0–5.0 | 2.0–2.5 | 1909 | $2,140 | $1.12 | 1d | 1 | 0.63mi |
| 114 Brushy Creek Ln Terrell, TX | 3.0 | 2.0 | 1357 | $1,695 | $1.25 | 7d | 1 | 0.70mi |
| 204 Pacific Ave Terrell, TX | 2.0 | 1.0 | 714 | $1,350 | $1.89 | 10d | 1 | 0.93mi |
| 400 Oak Dr Unit 2D Terrell, TX | 2.0 | 1.0 | 910 | $950 | $1.04 | 17d | 1 | 0.94mi |
| 507 Campbell St Terrell, TX | 3.0 | 2.0 | 1268 | $1,950 | $1.54 | 44d | 1 | 1.19mi |
| 301 Charles Ln Terrell, TX | 3.0 | 1.0 | 1008 | $1,600 | $1.59 | 17d | 1 | 1.42mi |
| 104 Freeman St Terrell, TX | 4.0 | 2.5 | 1500 | $2,000 | $1.33 | 43d | 1 | 1.44mi |
| 115 Charles Ln Terrell, TX | 3.0 | 1.0 | 986 | $1,300 | $1.32 | 43d | 1 | 1.47mi |
| 510 Frazier St Terrell, TX | 3.0 | 1.0 | 840 | $1,285 | $1.53 | 43d | 1 | 1.47mi |
| 514 Frazier St Terrell, TX | 2.0 | 1.0 | 850 | $1,300 | $1.53 | 43d | 1 | 1.49mi |
Listing history 11 events
-
2026-06-18days on market $139,900 Active 15 DOM
-
2026-06-17days on market $139,900 Active 14 DOM
-
2026-06-16days on market $139,900 Active 13 DOM
-
2026-06-15days on market $139,900 Active 12 DOM
-
2026-06-13days on market $139,900 Active 10 DOM
-
2026-06-13days on market $139,900 Active 9 DOM
-
2026-06-09days on market $139,900 Active 6 DOM
-
2026-06-08days on market $139,900 Active 5 DOM
-
2026-06-07days on market $139,900 Active 4 DOM
-
2026-06-04remarks 581-char remark
-
2026-06-04$139,900 Active 1 DOM
ⓘ Source: listings_history table (triggers on properties + properties_extension) + one-shot
backfill from property_details.listing_events for pre-trigger history.
Tax reassessment forecast TX · Resets to sale price
- Current annual tax
- $2,290 · $191/mo
- Projected year-2 tax
- $2,560 · $213/mo
- Expected delta
- +$271/yr (+$23/mo · 11.8%)
ⓘ Screening estimate from a state-policy table — verify with the county assessor before closing.
Climate risk First Street
- Flood 1/10 Low FEMA zone X (unshaded) · 0% chance over 30 yrs
- Wildfire 6/10 Major
- Heat 7/10 Severe 7 d/yr ≥109°F today · 23 d/yr by 30 yrs out
- Wind 6/10 Major 27% chance of damaging wind over 30 yrs
- Air quality 2/10 Low 1 unhealthy d/yr today · 1 by 30 yrs out
Nearby sold comps map
Loading sold comps map…
Walkable amenities ~0.75 mi
Loading nearby amenities…
Taxation est. · year 1
- Rental income
- $20,540
- − Mortgage interest
- −$7,837
- − Property taxes
- −$2,290
- − Insurance
- −$700
- − Repairs & maintenance
- −$1,643
- − Management
- −$1,643
- − Depreciation
- −$4,070
- Taxable income
- $2,358
- Est. tax owed @ 24.0%
- −$566
- After-tax cash flow
- $3,868/yr
For passive investors: Depreciation is non-cash, so a rental often shows a tax loss while cash-flowing — sheltering income. Rental losses are passive: they offset passive income freely, and up to $25,000/yr can offset ordinary (W-2) income if you actively participate and your MAGI is under $100k (phasing out to $0 by $150k); unused losses carry forward. On sale, claimed depreciation is recaptured at up to 25%, and gains may owe capital-gains tax (a 1031 exchange can defer both). Figures are a year-1 estimate at your 24.0% rate — not tax advice; consult a CPA.
Schools (NCES district)
- District
- Terrell ISD
- NCES district ID
- 4842450
- Math proficiency
- 25% ▼ -14.00%
- Reading proficiency
- 30% ▼ -5.00%
- Median HH income
- $44,265
- Composite
- 23.57/100
- National rank
- #7855
- State rank
- #677 of 826 in TX
Livability — Terrell
- Score
- 67/100
- State rank
- #520
- US rank
- #10213
Category grades
Schools grade is shown separately in the Schools card above.
Census & demographics
- Census place
- Terrell, TX
- County
- Kaufman County · 122,338 people
- City population
- 28,206
- Metro
- Dallas-Fort Worth-Arlington, TX
- Population (ZIP)
- 28,206
- Household income
- $71,801
- Rent vs Own
- Severe rent burden
- 845.0
Population outlook (Kaufman County) Hauer SSP2
- Today (2025)
- 138,716 people
- By 2030
- 150,815 · +8.7%
- By 2040
- 174,877 · +26.1%
- By 2050
- 198,020 · +42.8%
- By 2075
- 251,908 · +81.6%
- By 2100
- 285,325 · +105.7%
Race, ethnicity, and origin ACS 2023
- Neighborhood character
- Diverse neighborhood (Simpson 0.64)
- Race & ethnicity
- White 46% Hispanic / Latino 33% Two or more races 19% Black 18%
- Hispanic origin (detail)
- Mexican 30%
- Common ancestry
- Lithuanian 2% Slovak 1% Portuguese 1%
- Foreign-born
- 11% · Canada
- Languages at home
- 75% English-only · Spanish 24% Russian/Polish/Slavic 1%
Political lean MEDSL · Kaufman
- 2024 margin
- Strong R (+27.9) · D 35.6% · R 63.5%
- 2008→2024 swing
- +7.9pp toward D · 2008: -35.8pp · 2024: -27.9pp
- All cycles
- 2024: R+27.9 2020: R+33.9 2016: R+47.0 2012: R+44.4 2008: R+35.8
Not yet ingested
- Civics
- —
Market trends
- HPI YoY
- ▼ -42.39%
- Current HPI
- 278.507
- Rent YoY
- —
- Metro
- Dallas-Fort Worth-Arlington, TX
- State GDP YoY
- ▲ 3.95%
- F500 in state
- 110
Industry mix (Fortune 500 HQ in TX)
| Industry | F500 HQs | Revenue |
|---|---|---|
| Energy | 16 | $1,198B |
|
||
| Technology | 5 | $198B |
|
||
| Engineering / Construction | 4 | $72B |
|
||
| Energy Services | 3 | $60B |
|
||
| Utilities | 3 | $41B |
|
||
| Healthcare | 2 | $330B |
|
||
Price history
3 events — show timeline
- 2026-06-03 Listed $139,900 NTREIS
- 2013-07-25 Sold (Public Records) — Public Records
- 2013-07-25 Sold (Public Records) — Public Records
Property tax history
+3.6%/yrLatest (2025): $2,290 · +13.5% YoY. Source: county tax records.
Cash-flow waterfall
monthlySold comps — $/sqft
last 12 mo · ≤1 miLoading sold comps…