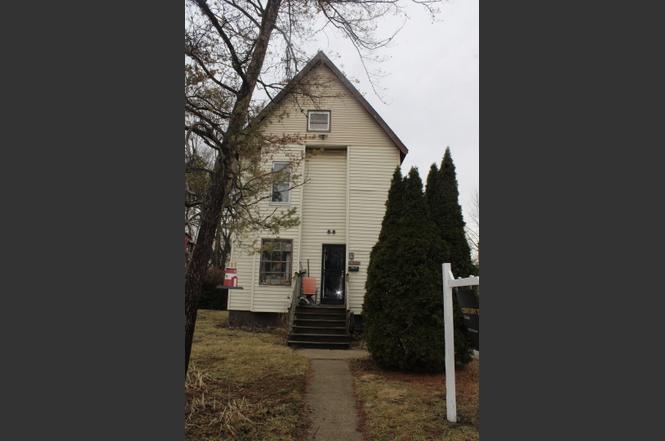
14438 Des Plaines St · Harvey, IL
Flood risk 1/10 · Minimal
- FEMA flood zone
- X (unshaded)
- Chance of flooding over 30 yrs
- 0.0%
- Est. flood insurance / yr
- $473 – $860
Fire risk 1/10 · Minimal
- Est. fire insurance / yr
- $804 – $1,492
Heat risk 3/10 · Minor
- Hot days now (above 101°F)
- 7 days/yr
- Hot days in 30 yrs
- 15 days/yr
Wind risk 2/10 · Minimal
- Chance of severe wind over 30 yrs
- —
Air-quality risk 4/10 · Minor
- Unhealthy air days now
- 4 days/yr
- Unhealthy air days in 30 yrs
- 5 days/yr
Risk factors via First Street. Map © Google.
Why this score? — see what drove the C+ grade
The composite is a weighted blend of 9 inputs, each scored 0–100. Each bar is that input's sub-score; the figure is the points it added to the 100-point composite (weight × sub-score).
- Cash flow +27.2/30.0
- Appreciation +10.0/10.0
- DSCR +9.5/10.0
- 1% rule +7.4/10.0
- Livability +3.4/5.0
- Rent growth +2.5/5.0
- Condition / age +2.5/5.0
- Schools +0.7/10.0
- ARV discount +0.0/15.0
$185,000
🖨 Deal sheet (PDF) 📄 Offer letter ✓ Due diligence
Listing remarks
A rare opportunity to own one of the tallest and most distinctive homes on the block. Built over 100 years ago and lovingly owner-occupied for the past 30 years, this two-story historic home blends timeless character with solid upkeep and major upside potential. Set on an exceptionally large triple-lot property (3 separate tax PINs), this home boasts a huge backyard perfect for entertaining, expansion, gardening, or future development. The spacious outdoor deck is in good condition and ready for gatherings, while the private driveway adds convenience. The roof is only about 3 years old and the furnace is new. Inside, you'll find vintage charm including a classic cast-iron clawfoot bathtub f
Key facts
- Private driveway
- Huge backyard
- Outdoor deck
Tags
Property features AI
Finance
- Other: Built before 1978; Parcel numbers on file
- HOA & community: No master association fee required
Exterior
- Parking: 2 parking spaces total; Concrete and gravel surfaces; Garage faces side
- Utilities: Public water; Public sewer
- Home design: Detached single-family home; 2 stories; Fee simple ownership; Home built over 100 years ago; Vinyl siding
- Construction: Vinyl siding construction
- Exterior features: Lot in the .25–.49 acre range; Lot dimensions recorded as 4375
Interior
- Kitchen: Kitchen on main level (10 x 12)
- Bedrooms: 3 bedrooms; Master bedroom on second level (12 x 14); Two additional bedrooms on second level (each 9 x 10); Attic on third level (20 x 30) — possible additional bedroom space
- Bathrooms: 1 full bath; 1 half bath
- Heating & cooling: Steam heating; Floor furnace
- Interior features: 7 total rooms; Pull-down stair attic; Unfinished full basement
- Laundry & utility: Laundry located in kitchen (main level)
Neighborhood map
What this means for you Summary
Snapshot
- This is a 4-bed/1.5-bath single-family listed at $185k.
Deal economics
- At list price, monthly cash flow is $529 ($6k/yr) — positive.
- The deal already cash-flows at list — no discount required.
- Meets the 1% rule at list price ($2k rent vs $185k).
- Recommended offer: $168k (9.0% below list) — sets the bar for market timing.
Location & tenants
- Location reads 67/100 on livability (#539 in IL) — a middle-class / working-renter tenant base. Strengths: commute A+, cost of living A+, housing A-; Watch: health & safety D+, crime F, amenities F.
- Thornton Twp Hsd 205 (suburban): math 7% / reading 8% proficiency, ranked #594 of 620 in IL (top 96%) — low school quality limits family demand, transient renter base, plan for 1-2y turnover.
- Zoned schools: Bryant Elem School (math 2% / reading 8%, grade F, #1,741 of 2,056 statewide, top 93%, 313 students, 0% FRL); Brooks Middle School (math 3% / reading 14%, grade F, #605 of 665 statewide, top 91%, 487 students, 0% FRL); Thornton Township High School (math 7% / reading 7%, grade F, #605 of 693 statewide, top 87%, 1,628 students, 0% FRL).
- Market conditions: 133 active listings in the ZIP; 4 comparable units currently listed for rent nearby; rentals at typical pace (median 26d on market — plan ~3-4 weeks tenant-placement turnaround); 6,272 units permitted in Cook County in 2024 (4,658 in 5+ unit buildings).
Forward outlook
- In year one you build about $20k of equity ($1k loan paydown + $18k appreciation (10.0% local appreciation)).
- At projected returns (10.0% appreciation + 3.0% rent growth), your $52k cash investment doubles in ~2 years — after that, you're playing with house money.
- By year 2, paydown + projected appreciation supports a ~$32k cash-out refi (75% LTV) — recoverable capital for the next deal without selling this one.
Negotiation context
- It's been on market 118 days — a 9% lower offer ($168k) is reasonable based on typical stale-listing flexibility.
- Current owner paid $58k; list at $185k implies a 219% gain — meaningful room to come down on a strong offer.
Risks & watch-outs
- Watch-outs: built in 1894 — expect roof / HVAC / electrical / plumbing capex.
Questions for the listing agent
- It's been on market 118 days. Have you received any prior offers? Is the seller open to a 9% concession, seller financing, or rate buy-down credit?
- Built in 1894 — when were the roof, HVAC, electrical panel, plumbing, and water heater last replaced?
- Why hasn't it sold? Are there any deal-killer items the seller is aware of (foundation, flood, title, zoning, code violations)?
- Is there a deadline driving the sale (1031 exchange, divorce, estate, relocation)? That informs how much negotiation room exists.
- Schools are F-rated, which usually means shorter tenancies and higher turnover. Who's the typical renter profile here, and what's been the actual vacancy rate?
- Crime grade is F in this area — have there been break-ins, vandalism, or insurance claims at this property in the last 3 years? What carrier currently insures it and at what premium?
- What's the average days-on-market for RENTAL listings here right now (not sales)? A rising rental-DOM trend means longer vacancies and softer asking-rent achievability than the comps imply.
- What's the recent tenant-quality profile in this submarket — average credit score on applications, eviction rate, late-payment / NSF rate, and stable-employment percentage? A property-management company in the area should have these aggregated.
- How much new for-sale + rental construction is in the pipeline within 1–3 miles? Heavy new supply typically softens prices + rents 12–24 months out; constrained supply supports both.
Investment metrics
- 1% rule
- 1.24% ✓
- Cap rate
- 9.73%
- Cash-on-cash
- 12.26%
- DSCR
- 1.55
- GRM
- 6.7
CMA / ARV
- ARV (on-the-fly)
- $135,168
- Comps found
- 12
Show comp detail 12 sales within ~0.75 mi
| Address | Dist | Beds/Ba | Sqft | Sold | Price | $/sf | Match |
|---|---|---|---|---|---|---|---|
| 750 W 144th St | 0.43mi | 4/1.5 | 1,513 (-2%) | 11mo | $200,000 | $132 | 68 |
| 111 E 144th Ct | 0.53mi | 3/1.5 (-1) | 1,491 (-3%) | 2mo | $105,000 | $70 | 63 |
| 665 W 144th St | 0.46mi | 3/2.0 (-1) | 1,600 (+4%) | 2mo | $218,000 | $136 | 63 |
| 308 W 145th Pl | 0.54mi | 3/1.5 (-1) | 1,488 (-3%) | 3mo | $91,000 | $61 | 62 |
| 14629 Kentucky Ave | 0.48mi | 4/2.0 | 1,504 (-2%) | 12mo | $136,000 | $90 | 62 |
| 14459 Center Ave | 0.35mi | 3/1.0 (-1) | 1,400 (-9%) | 4mo | $35,000 | $25 | 58 |
| 14524 S Lowe Ave | 0.25mi | 3/2.0 (-1) | 1,727 (+12%) | 9mo | $239,200 | $139 | 53 |
| 14411 S Parnell Ave | 0.46mi | 3/2.0 (-1) | 1,656 (+8%) | 8mo | $134,400 | $81 | 52 |
| 14600 Princeton Ave | 0.54mi | 3/2.5 (-1) | 1,700 (+11%) | 1mo | $122,850 | $72 | 47 |
| 14609 Lexington Ave | 0.58mi | 3/1.0 (-1) | 1,326 (-14%) | 3mo | $45,000 | $34 | 41 |
| 14533 Myrtle Ave | 0.68mi | 4/2.5 | 1,704 (+11%) | 8mo | $150,000 | $88 | 40 |
| 14223 S Eggleston Ave | 0.71mi | 5/3.0 (+1) | 1,350 (-12%) | 3mo | $234,900 | $174 | 33 |
Match score weights: distance 35% · size 25% · config 20% · recency 20%. Top-matched comps best support the ARV.
Projected returns pro-forma
10.0% appreciation · 3.0% rent growth · sell at horizon
- IRR
- 33.3%
- Equity multiple
- 3.60×
- Total profit
- $134,503
- Equity at exit
- $166,663
- IRR
- 28.7%
- Equity multiple
- 8.14×
- Total profit
- $369,645
- Equity at exit
- $359,414
Cash invested: $51,800 (down + closing). Projections, not guarantees.
Landlord ↔ Tenant lean methodology
- Overall (STATE)
- 43 Moderately Tenant-Leaning
- State Illinois
- 43 Moderately Tenant-Leaning · D+7
- County
- — inherits STATE
- City
- — inherits STATE
ZIP-level market 60426
- Home prices YoY
- 6.9%
- Active inventory
- 133
- Price-to-rent
- 6.7×
Monthly cashflow live
- Estimated rent
- $2,288 medium interval (Pro) →
- Mortgage (P&I)
- −$970
- Tax est. 1.5%
- −$231 /mo · $2,775/yr
- Insurance
- −$77
- HOA
- −$0
- Vacancy / Maint / Mgmt
- −$481
- Net cashflow
- $529
Break-even live
Sensitivity live
| Price | -10% $657 | -5% $593 | +0% $529 | +5% $465 | +10% $401 |
|---|---|---|---|---|---|
| Rent | -10% $349 | -5% $439 | +0% $529 | +5% $620 | +10% $710 |
| Rate | -1.0pp $622 | -0.5pp $576 | base $529 | +0.5pp $481 | +1.0pp $433 |
UW: 25.0% down · 7.5% · 30yr · 1.5% tax · 5.0% vac · 8.0% maint · 8.0% mgmt
Financing live
Cash to close
- Down payment
- $46,250
- Closing costs
- $5,550
- Reserves months
- —
- Total cash needed
- —
Loan-product check · same deal, 3 products live
Conventional
25% down · 7.5% · 30yr
- Down + closing
- —
- Monthly P&I
- —
- Monthly cashflow
- —
- DSCR
- —
- Eligible?
- —
Personal DTI + credit; lowest rate.
DSCR
20% down · 8.5% · 30yr
- Down + closing
- —
- Monthly P&I
- —
- Monthly cashflow
- —
- DSCR
- —
- Eligible?
- —
No personal income docs; deal must DSCR.
Hard money
10% down · 12.0% · 12mo
- Down + closing
- —
- Monthly P&I
- —
- Monthly cashflow
- —
- DSCR
- —
- Eligible?
- —
Short-term bridge; refi at stabilization.
Rent comps 4 comps
| Address | Beds | Baths | Sqft | Rent | $/sqft | DOM | Units | Dist |
|---|---|---|---|---|---|---|---|---|
| 14844 Wabash Ave Dolton, IL | 3.0 | 1.5 | 1277 | $2,320 | $1.82 | 26d | 1 | 0.94mi |
| 19 E 140th Ct Riverdale, IL | 3.0 | 2.0 | 2076 | $2,231 | $1.07 | 9d | 1 | 1.31mi |
| 13708 S Wentworth Ave Riverdale, IL | 3.0 | 1.5 | 1500 | $2,200 | $1.47 | 23d | 1 | 1.43mi |
| 14124 Manor Ave Dolton, IL | 3.0 | 2.0 | 1440 | $2,390 | $1.66 | 26d | 1 | 1.47mi |
Listing history 18 events
-
2026-06-21days on market $185,000 Active 118 DOM
-
2026-06-18days on market $185,000 Active 115 DOM
-
2026-06-17days on market $185,000 Active 114 DOM
-
2026-06-16days on market $185,000 Active 113 DOM
-
2026-06-15days on market $185,000 Active 112 DOM
-
2026-06-13days on market $185,000 Active 110 DOM
-
2026-06-13days on market $185,000 Active 109 DOM
-
2026-06-09days on market $185,000 Active 106 DOM
-
2026-06-08days on market $185,000 Active 105 DOM
-
2026-06-07days on market $185,000 Active 104 DOM
-
2026-06-04days on market $185,000 Active 101 DOM
-
2026-06-03days on market $185,000 Active 100 DOM
-
2026-06-02days on market $185,000 Active 99 DOM
-
2026-06-01days on market $185,000 Active 98 DOM
-
2026-05-31days on market $185,000 Active 97 DOM
-
2026-05-11price $185,000
-
2026-03-23price $200,000
-
2001-09-10soldstatus $58,000
ⓘ Source: listings_history table (triggers on properties + properties_extension) + one-shot
backfill from property_details.listing_events for pre-trigger history.
Climate risk First Street
- Flood 1/10 Low FEMA zone X (unshaded) · 0% chance over 30 yrs
- Wildfire 1/10 Low
- Heat 3/10 Moderate 7 d/yr ≥101°F today · 15 d/yr by 30 yrs out
- Wind 2/10 Low
- Air quality 4/10 Moderate 4 unhealthy d/yr today · 5 by 30 yrs out
Nearby sold comps map
Loading sold comps map…
Walkable amenities ~0.75 mi
Loading nearby amenities…
Taxation est. · year 1
- Rental income
- $27,460
- − Mortgage interest
- −$10,363
- − Property taxes
- −$2,775
- − Insurance
- −$925
- − Repairs & maintenance
- −$2,197
- − Management
- −$2,197
- − Depreciation
- −$5,382
- Taxable income
- $3,622
- Est. tax owed @ 24.0%
- −$869
- After-tax cash flow
- $5,482/yr
For passive investors: Depreciation is non-cash, so a rental often shows a tax loss while cash-flowing — sheltering income. Rental losses are passive: they offset passive income freely, and up to $25,000/yr can offset ordinary (W-2) income if you actively participate and your MAGI is under $100k (phasing out to $0 by $150k); unused losses carry forward. On sale, claimed depreciation is recaptured at up to 25%, and gains may owe capital-gains tax (a 1031 exchange can defer both). Figures are a year-1 estimate at your 24.0% rate — not tax advice; consult a CPA.
Schools (NCES district)
- District
- Thornton Twp Hsd 205
- NCES district ID
- 1738970
- Math proficiency
- 7% ▬ 0.00%
- Reading proficiency
- 8% ▼ -2.00%
- Median HH income
- $43,392
- Composite
- 6.92/100
- National rank
- #9976
- State rank
- #594 of 620 in IL
Livability — Harvey
- Score
- 67/100
- State rank
- #539
- US rank
- #11162
Category grades
Schools grade is shown separately in the Schools card above.
Census & demographics
- Census place
- Harvey, IL
- City population
- 23,066
- Population (ZIP)
- 23,066
Population outlook (Cook County) Hauer SSP2
- Today (2025)
- 5,347,519 people
- By 2030
- 5,357,703 · +0.2%
- By 2040
- 5,324,924 · -0.4%
- By 2050
- 5,230,762 · -2.2%
- By 2075
- 4,785,735 · -10.5%
- By 2100
- 4,188,836 · -21.7%
Race, ethnicity, and origin ACS 2023
- Neighborhood character
- Majority Black (59%)
- Race & ethnicity
- Black 59% Hispanic / Latino 33% Two or more races 12% White 3% Asian 2%
- Hispanic origin (detail)
- Mexican 31%
- Foreign-born
- 17% · Canada
- Languages at home
- 67% English-only · Spanish 30% Other Indo-European 2% French/Haitian/Cajun 1%
Political lean MEDSL · Cook
- 2024 margin
- Solid D (+42.0) · D 70.4% · R 28.4% · Other 1.2%
- 2008→2024 swing
- -11.4pp toward R · 2008: 53.4pp · 2024: 42.0pp
- All cycles
- 2024: D+42.0 2020: D+50.3 2016: D+53.0 2012: D+49.4 2008: D+53.4
Not yet ingested
- Civics
- —
Market trends
- HPI YoY
- ▲ 20.36%
- Current HPI
- 313.7895
- Rent YoY
- —
- Metro
- —
- State GDP YoY
- ▲ 1.59%
- F500 in state
- 60
Industry mix (Fortune 500 HQ in IL)
| Industry | F500 HQs | Revenue |
|---|---|---|
| Insurance | 4 | $201B |
|
||
| Consumer Goods | 4 | $87B |
|
||
| Industrial Machinery | 3 | $64B |
|
||
| Healthcare | 2 | $55B |
|
||
| Retail / Pharmacy | 1 | $148B |
|
||
| Agriculture / Food | 1 | $86B |
|
||
Price history
+219.0% since first listed3 events — show timeline
- 2026-05-11 Price Changed $185,000 MRED as Distributed by MLS Grid
- 2026-03-23 Price Changed $200,000 MRED as Distributed by MLS Grid
- 2001-09-10 Sold (Public Records) $58,000 Public Records
Property tax history
+1.9%/yrLatest (2023): $275 · -40.7% YoY. Source: county tax records.
Cash-flow waterfall
monthlySold comps — $/sqft
last 12 mo · ≤1 miLoading sold comps…