 🏢 Co-op
1776 S Palo Verde Unit E208 · Tucson, AZ
Flood risk 1/10 · Minimal
- FEMA flood zone
- X (unshaded)
- Chance of flooding over 30 yrs
- 0.0%
- Est. flood insurance / yr
- $507 – $1,088
Fire risk 2/10 · Minimal
- Est. fire insurance / yr
- $610 – $1,132
Heat risk 8/10 · Major
- Hot days now (above 105°F)
- 6 days/yr
- Hot days in 30 yrs
- 15 days/yr
Wind risk 1/10 · Minimal
- Chance of severe wind over 30 yrs
- —
Air-quality risk 1/10 · Minimal
- Unhealthy air days now
- 0 days/yr
- Unhealthy air days in 30 yrs
- 0 days/yr
Risk factors via First Street. Map © Google.
Why this score? — see what drove the C- grade
The composite is a weighted blend of 9 inputs, each scored 0–100. Each bar is that input's sub-score; the figure is the points it added to the 100-point composite (weight × sub-score).
- Cash flow +16.1/30.0
- 1% rule +10.0/10.0
- ARV discount +9.4/15.0
- DSCR +5.0/10.0
- Livability +3.7/5.0
- Rent growth +2.6/5.0
- Condition / age +2.5/5.0
- Schools +1.6/10.0
- Appreciation +0.0/10.0
$59,999
🖨 Deal sheet 📄 Offer letter ✓ Due diligence
Listing remarks MLS
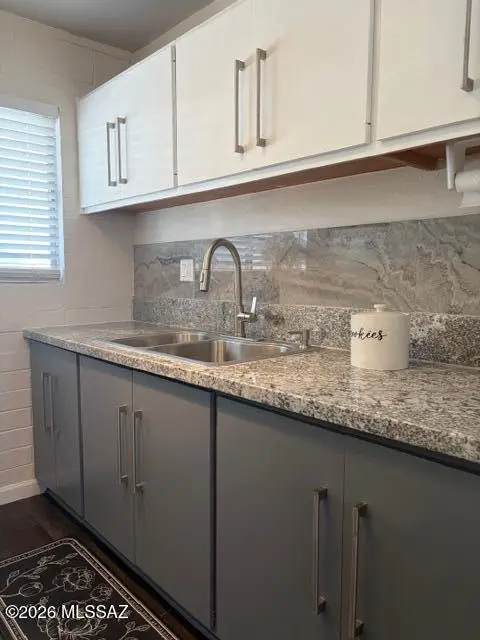
Central Tucson upstairs 1-bedroom, 1-bath co-op unit. The kitchen features new granite countertops, freshly painted cabinets, and all appliances convey. Interior updates include brand-new carpet, ceiling fans, and updated ceiling lighting. The enclosed patio has been incorporated to expand the bedroom, creating additional usable living space. This desirable end unit offers enhanced privacy with no neighboring units on any vertical side. Conveniently located near bus lines, restaurants, and shopping. Reid Park is just a few blocks away and offers a golf course, walking paths, dog park, and more. Only minutes from Downtown Tucson and the University of Arizona. Cash only. No rentals permitted.
Key facts
- Ceiling fans
- Brand-new carpet
- Enclosed patio
Tags
Neighborhood map
What this means for you Summary
Snapshot
- This is a 1-bed/1.0-bath condo listed at $60k.
Deal economics
- At list price, monthly cash flow is $31 ($369/yr) — positive.
- The deal already cash-flows at list — no discount required.
- Meets the 1% rule at list price ($940 rent vs $60k).
- Recommended offer: $55k (9.0% below list) — sets the bar for market timing.
- Cap rate 6.9% vs local median 3.7% in Tucson — top-decile yield for the area; either an underpriced asset or a hidden risk that comps aren't pricing in. Stress-test before assuming the spread holds.
Location & tenants
- Location reads 74/100 on livability (#17 in AZ, #4,502 nationally) — a middle-class / working-renter tenant base. Strengths: commute A+, cost of living A+, housing A+; Watch: health & safety C-, schools D+, crime F.
- Tucson Unified District (4403) (urban): math 14% / reading 23% proficiency, ranked #190 of 249 in AZ (top 76%) — low school quality limits family demand, transient renter base, plan for 1-2y turnover.
- Market conditions: Rents flat; 264 active listings in the ZIP; 30 comparable units currently listed for rent nearby; rentals lingering (median 44d on market — plan ~5-8 weeks vacancy on turnover, expect pricing pressure); 53% of comp listings sitting > 30 days — soft ceiling on asking rent; 5,268 units permitted in Pima County in 2024 (996 in 5+ unit buildings).
Forward outlook
- Local home prices are declining (-3.0%/yr); year-one equity from $415 of loan paydown is wiped out by about $2k of value loss. Plan a longer hold.
- Pima County population projected at +8% by 2050 — modest demand growth; plan on rents tracking national, not racing it.
Negotiation context
- It's been on market 97 days — a 9% lower offer ($55k) is reasonable based on typical stale-listing flexibility.
- 4 sale attempts since 19y ago; this cycle's ask has dropped $7k (10%) from the opening price — seller is motivated, your offer sets the floor, not the list.
- Current owner paid $30k; list at $60k implies a 100% gain — meaningful room to come down on a strong offer.
Risks & watch-outs
- Watch-outs: HOA is 32% of rent.
- Climate carrying-cost: extreme-heat days projected 6→15/yr by 2055 (HVAC capex compounding) — expect insurance premiums to compound above CPI over the hold.
Questions for the listing agent
- It's been on market 97 days. Have you received any prior offers? Is the seller open to a 9% concession, seller financing, or rate buy-down credit?
- Built in 1962 — when were the roof, HVAC, electrical panel, plumbing, and water heater last replaced?
- What does the HOA fee cover, when was the last increase, and are there any pending special assessments or reserve-fund shortfalls?
- Any open or pending special assessments — roof, HVAC, plumbing, elevator, façade? What's the per-unit balance and payoff schedule, and is the seller paying it off at close or rolling it to the buyer?
- Why hasn't it sold? Are there any deal-killer items the seller is aware of (foundation, flood, title, zoning, code violations)?
- Is there a deadline driving the sale (1031 exchange, divorce, estate, relocation)? That informs how much negotiation room exists.
- Schools are D-rated, which usually means shorter tenancies and higher turnover. Who's the typical renter profile here, and what's been the actual vacancy rate?
- Crime grade is F in this area — have there been break-ins, vandalism, or insurance claims at this property in the last 3 years? What carrier currently insures it and at what premium?
- What's the average days-on-market for RENTAL listings here right now (not sales)? A rising rental-DOM trend means longer vacancies and softer asking-rent achievability than the comps imply.
- What's the recent tenant-quality profile in this submarket — average credit score on applications, eviction rate, late-payment / NSF rate, and stable-employment percentage? A property-management company in the area should have these aggregated.
- How much new apartment / multifamily construction is in the pipeline within 1–3 miles? Heavy new supply (>2% of stock underway) typically softens rents 12–24 months out; light construction supports rent growth.
Investment metrics
- 1% rule
- 1.57% ✓
- Cap rate
- 6.91%
- Cash-on-cash
- 2.19%
- DSCR
- 1.10
- GRM
- 5.3
CMA / ARV
- ARV (median comp)
- $62,652
- List price
- $59,999
- Delta
- -4.23%
- Verdict
- FAIR
- Comps
- 20 within 1.0 mi
Projected returns pro-forma
-3.0% appreciation · 0.21% rent growth · sell at horizon
- IRR
- -17.9%
- Equity multiple
- 0.40×
- Total profit
- $-10,136
- Equity at exit
- $8,946
- IRR
- -23.5%
- Equity multiple
- 0.08×
- Total profit
- $-15,467
- Equity at exit
- $5,188
Cash invested: $16,800 (down + closing). Projections, not guarantees.
Landlord ↔ Tenant lean methodology
- Overall (STATE)
- 87 Strongly Landlord-Friendly
- State Arizona
- 87 Strongly Landlord-Friendly · R+3
- County
- — inherits STATE
- City
- — inherits STATE
ZIP-level market 85713
- Home prices YoY
- -24.5%
- Rents YoY
- 0.2%
- Active inventory
- 264
- Price-to-rent
- 5.3×
Monthly cashflow live
- Estimated rent
- $940 high interval (Pro) →
- Mortgage (P&I)
- −$315
- Tax est. 1.5%
- −$75 /mo · $900/yr
- Insurance
- −$25
- HOA
- −$297
- Vacancy / Maint / Mgmt
- −$197
- Net cashflow
- $31
Break-even live
UW: 25.0% down · 7.5% · 30yr · 1.5% tax · 5.0% vac · 8.0% maint · 8.0% mgmt
Financing live
Cash to close
- Down payment
- $15,000
- Closing costs
- $1,800
- Reserves months
- —
- Total cash needed
- —
Loan-product check · same deal, 3 products live
Conventional
25% down · 7.5% · 30yr
- Down + closing
- —
- Monthly P&I
- —
- Monthly cashflow
- —
- DSCR
- —
- Eligible?
- —
Personal DTI + credit; lowest rate.
DSCR
20% down · 8.5% · 30yr
- Down + closing
- —
- Monthly P&I
- —
- Monthly cashflow
- —
- DSCR
- —
- Eligible?
- —
No personal income docs; deal must DSCR.
Hard money
10% down · 12.0% · 12mo
- Down + closing
- —
- Monthly P&I
- —
- Monthly cashflow
- —
- DSCR
- —
- Eligible?
- —
Short-term bridge; refi at stabilization.
Rent comps 30 comps
| Address | Beds | Baths | Sqft | Rent | $/sqft | DOM | Units | Dist |
|---|---|---|---|---|---|---|---|---|
| 3051 E Proctor Vis Tucson, AZ | 1.0 | 1.0 | 600 | $950 | $1.58 | 43d | 1 | 0.84mi |
| 3049 E Proctor Vis Unit ProctorVista3051 Tucson, AZ | 1.0 | 1.0 | 600 | $800 | $1.33 | 43d | 1 | 0.84mi |
| 3049 E Proctor Vis Tucson, AZ | 1.0 | 1.0 | 600 | $950 | $1.58 | 43d | 1 | 0.84mi |
| 3043 E Proctor Vis Tucson, AZ | 1.0 | 1.0 | 600 | $750 | $1.25 | 17d | 1 | 0.84mi |
| 4170 E 32nd St Tucson, AZ | 2.0 | 1.0 | 725 | $1,095 | $1.51 | 14d | 1 | 0.89mi |
| 4170 E 32nd St Tucson, AZ | 2.0 | 1.0 | 725 | $1,095 | $1.51 | 17d | 1 | 0.89mi |
| 4250 E 29th St Tucson, AZ | 1.0 | 1.0 | 418 | $874 | $2.09 | 43d | 1 | 1.00mi |
| 4255 E 29th St Tucson, AZ | 2.0 | 1.0 | 585 | $849 | $1.45 | 3d | 7 | 1.01mi |
| 2511 E Cameron Vis Tucson, AZ | 2.0 | 1.0 | 685 | $1,199 | $1.75 | 43d | 1 | 1.05mi |
| 1524 S Columbus Blvd Tucson, AZ | 1.0 | 1.0 | 689 | $825 | $1.20 | 3d | 1 | 1.07mi |
| 2921 E 17th St Tucson, AZ | 1.0 | 1.0 | 625 | $1,075 | $1.72 | 43d | 1 | 1.13mi |
| 2921 E 17th St Tucson, AZ | 1.0 | 1.0 | 625 | $975 | $1.56 | 21d | 1 | 1.13mi |
| 2843 E 17th St Unit 13 Tucson, AZ | 1.0 | 1.0 | 520 | $900 | $1.73 | 43d | 1 | 1.13mi |
| 2843 E 17th St Unit 13 Tucson, AZ | 1.0 | 1.0 | 560 | $900 | $1.61 | 23d | 1 | 1.13mi |
| 2842 S Coconino Vis Unit 2844 Tucson, AZ | 2.0 | 1.0 | 750 | $800 | $1.07 | 19d | 1 | 1.17mi |
| 2842 S Coconino Vis Tucson, AZ | 2.0 | 1.0 | 750 | $800 | $1.07 | 17d | 1 | 1.17mi |
| 850 S Tucson Blvd Unit Tucson886 Tucson, AZ | 1.0 | 1.0 | 525 | $800 | $1.52 | 43d | 1 | 1.23mi |
| 4440 E 29th St Unit I210 Tucson, AZ | 2.0 | 1.0 | 646 | $850 | $1.32 | 43d | 1 | 1.25mi |
| 4440 E 29th St Unit E216 Tucson, AZ | 1.0 | 1.0 | 488 | $650 | $1.33 | 23d | 1 | 1.25mi |
| 4440 E 29th St Unit C211 Tucson, AZ | 2.0 | 1.0 | 646 | $850 | $1.32 | 16d | 1 | 1.25mi |
| 725 S Tucson Blvd Tucson, AZ | 2.0 | 1.0 | 538 | $1,232 | $2.29 | 43d | 1 | 1.29mi |
| 660 S Tucson Blvd Unit 103 Tucson, AZ | 1.0 | 1.0 | 600 | $850 | $1.42 | 23d | 1 | 1.35mi |
| 660 S Tucson Blvd Unit 114 Tucson, AZ | 1.0 | 1.0 | 600 | $725 | $1.21 | 43d | 1 | 1.35mi |
| 460 S Bryant Ave Tucson, AZ | 1.0 | 1.0 | 600 | $743 | $1.24 | 3d | 1 | 1.35mi |
| 4150 E Brown Way Tucson, AZ | — | 1.0 | 400 | $750 | $1.88 | 43d | 1 | 1.36mi |
| 4148 E Brown Way Tucson, AZ | — | 1.0 | 400 | $750 | $1.88 | 43d | 1 | 1.36mi |
| 4431 E 22nd St Tucson, AZ | 1.0–2.0 | 1.0 | 770 | $901 | $1.17 | 43d | 2 | 1.37mi |
| 4162 E Brown Way Tucson, AZ | 1.0 | 1.0 | 600 | $900 | $1.50 | 43d | 1 | 1.38mi |
| 2012 E 36th St Unit 2014 Tucson, AZ | 2.0 | 1.0 | 700 | $925 | $1.32 | 43d | 1 | 1.40mi |
| 4171 E Brown Way Tucson, AZ | 1.0 | 1.0 | 583 | $850 | $1.46 | 23d | 1 | 1.41mi |
HOA detail condo
- Monthly dues
- $297 · $3,564/yr
- Assessments
- None detected in remarks — confirm with the listing agent.
Listing history 24 events
-
2026-06-18days on market $59,999 Active 97 DOM
-
2026-06-17days on market $59,999 Active 96 DOM
-
2026-06-16days on market $59,999 Active 95 DOM
-
2026-06-15days on market $59,999 Active 94 DOM
-
2026-06-13days on market $59,999 Active 92 DOM
-
2026-06-10days on market $59,999 Active 89 DOM
-
2026-06-09days on market $59,999 Active 88 DOM
-
2026-06-08days on market $59,999 Active 87 DOM
-
2026-06-07days on market $59,999 Active 86 DOM
-
2026-06-05days on market $59,999 Active 83 DOM
-
2026-06-03days on market $59,999 Active 82 DOM
-
2026-06-02days on market $59,999 Active 81 DOM
-
2026-06-01days on market $59,999 Active 80 DOM
-
2026-05-31days on market $59,999 Active 79 DOM
-
2026-03-13$67,000 Active 699-char remark
Show marketing remark (699 chars)
Central Tucson upstairs 1-bedroom, 1-bath co-op unit. The kitchen features new granite countertops, freshly painted cabinets, and all appliances convey. Interior updates include brand-new carpet, ceiling fans, and updated ceiling lighting. The enclosed patio has been incorporated to expand the bedroom, creating additional usable living space. This desirable end unit offers enhanced privacy with no neighboring units on any vertical side. Conveniently located near bus lines, restaurants, and shopping. Reid Park is just a few blocks away and offers a golf course, walking paths, dog park, and more. Only minutes from Downtown Tucson and the University of Arizona. Cash only. No rentals permitted.
-
2020-12-17soldstatus $30,000 Closed 270-char remark
Show marketing remark (270 chars)
Co-Op in Central Tucson near Reid Park Zoo Golf minutes from U of A and Downtown. These properties are nearly maintenance Free HOA covers Pool ,covered parking,taxes,Insurance,roof and all building maintenance. No rentals allowed. Background/Credit Check on all buyers.
-
2020-11-06historical Active Contingent 270-char remark
Show marketing remark (270 chars)
Co-Op in Central Tucson near Reid Park Zoo Golf minutes from U of A and Downtown. These properties are nearly maintenance Free HOA covers Pool ,covered parking,taxes,Insurance,roof and all building maintenance. No rentals allowed. Background/Credit Check on all buyers.
-
2020-11-01price $32,000 270-char remark
Show marketing remark (270 chars)
Co-Op in Central Tucson near Reid Park Zoo Golf minutes from U of A and Downtown. These properties are nearly maintenance Free HOA covers Pool ,covered parking,taxes,Insurance,roof and all building maintenance. No rentals allowed. Background/Credit Check on all buyers.
-
2020-10-17$35,000 Active 270-char remark
Show marketing remark (270 chars)
Co-Op in Central Tucson near Reid Park Zoo Golf minutes from U of A and Downtown. These properties are nearly maintenance Free HOA covers Pool ,covered parking,taxes,Insurance,roof and all building maintenance. No rentals allowed. Background/Credit Check on all buyers.
-
2018-09-02historical
-
2018-08-10soldstatus $21,000 Closed
-
2018-08-07$21,000
-
2007-09-15historical
-
2007-03-19$28,000
ⓘ Source: listings_history table (triggers on properties + properties_extension) + one-shot
backfill from property_details.listing_events for pre-trigger history.
Climate risk First Street
- Flood 1/10 Low FEMA zone X (unshaded) · 0% chance over 30 yrs
- Wildfire 2/10 Low
- Heat 8/10 Severe 6 d/yr ≥105°F today · 15 d/yr by 30 yrs out
- Wind 1/10 Low
- Air quality 1/10 Low 0 unhealthy d/yr today · 0 by 30 yrs out
Nearby sold comps map
Loading sold comps map…
Walkable amenities ~0.75 mi
Loading nearby amenities…
Taxation est. · year 1
- Rental income
- $11,276
- − Mortgage interest
- −$3,361
- − Property taxes
- −$900
- − Insurance
- −$300
- − Repairs & maintenance
- −$902
- − Management
- −$902
- − HOA
- −$3,564
- − Depreciation
- −$1,745
- Taxable loss
- −$398
- Est. tax savings @ 24.0%
- +$96
- After-tax cash flow
- $464/yr
For passive investors: Depreciation is non-cash, so a rental often shows a tax loss while cash-flowing — sheltering income. Rental losses are passive: they offset passive income freely, and up to $25,000/yr can offset ordinary (W-2) income if you actively participate and your MAGI is under $100k (phasing out to $0 by $150k); unused losses carry forward. On sale, claimed depreciation is recaptured at up to 25%, and gains may owe capital-gains tax (a 1031 exchange can defer both). Figures are a year-1 estimate at your 24.0% rate — not tax advice; consult a CPA.
Schools (NCES district)
- District
- Tucson Unified District (4403)
- NCES district ID
- 0408800
- Math proficiency
- 14% ▼ -17.00%
- Reading proficiency
- 23% ▼ -11.00%
- Median HH income
- $40,962
- Composite
- 15.78/100
- National rank
- #9270
- State rank
- #190 of 249 in AZ
Livability — Tucson
- Score
- 74/100
- State rank
- #17
- US rank
- #4502
Category grades
Schools grade is shown separately in the Schools card above.
Census & demographics
- Census place
- Tucson, AZ
- County
- Pima County · 1,012,107 people
- City population
- 839,336
- Metro
- Tucson, AZ
- Population (ZIP)
- 46,439
- Household income
- $53,152
- Rent vs Own
- Severe rent burden
- 1517.0
Population outlook (Pima County) Hauer SSP2
- Today (2025)
- 1,066,056 people
- By 2030
- 1,086,684 · +1.9%
- By 2040
- 1,117,160 · +4.8%
- By 2050
- 1,149,778 · +7.9%
- By 2075
- 1,271,480 · +19.3%
- By 2100
- 1,321,160 · +23.9%
Race, ethnicity, and origin ACS 2023
- Neighborhood character
- Predominantly Hispanic (70%)
- Race & ethnicity
- Hispanic / Latino 70% Two or more races 30% White 21% Native American 5% Black 3% Asian 1%
- Hispanic origin (detail)
- Mexican 67%
- Common ancestry
- Italian 1% Lithuanian 1% Portuguese 1%
- Foreign-born
- 19% · Canada, China
- Languages at home
- 49% English-only · Spanish 49%
Political lean MEDSL · Pima
- 2024 margin
- D (+15.2) · D 57.0% · R 41.8% · Other 1.2%
- 2008→2024 swing
- +9.1pp toward D · 2008: 6.1pp · 2024: 15.2pp
- All cycles
- 2024: D+15.2 2020: D+18.7 2016: D+13.5 2012: D+5.8 2008: D+6.1
Not yet ingested
- Civics
- —
Market trends
- HPI YoY
- ▼ -107.07%
- Current HPI
- 329.8338
- Rent YoY
- ▲ 0.21%
- Metro
- Tucson, AZ
- State GDP YoY
- ▲ 4.54%
- F500 in state
- 20
Industry mix (Fortune 500 HQ in AZ)
| Industry | F500 HQs | Revenue |
|---|---|---|
| Technology | 2 | $13B |
|
||
| Mining / Metals | 1 | $23B |
|
||
| Environmental Services | 1 | $16B |
|
||
| Metals / Steel | 1 | $14B |
|
||
| Technology Distribution | 1 | $9B |
|
||
| Homebuilding | 1 | $8B |
|
||
Price history
+139.3% since first listed10 events — show timeline
- 2026-03-13 Listed $67,000 MLSSAZ
- 2020-12-17 Sold (MLS) $30,000 MLSSAZ
- 2020-11-06 Contingent — MLSSAZ
- 2020-11-01 Price Changed $32,000 MLSSAZ
- 2020-10-17 Listed $35,000 MLSSAZ
- 2018-09-02 Listing Removed — MLSSAZ
- 2018-08-10 Sold (MLS) $21,000 MLSSAZ
- 2018-08-07 Listed $21,000 MLSSAZ
- 2007-09-15 Listing Removed — MLSSAZ
- 2007-03-19 Listed $28,000 MLSSAZ
Cash-flow waterfall
monthlySold comps — $/sqft
last 12 mo · ≤1 miLoading sold comps…