1730 SW 85th Ave · Davie, FL
Flood risk 1/10 · Minimal
- FEMA flood zone
- X (shaded)
- Chance of flooding over 30 yrs
- 0.0%
- Est. flood insurance / yr
- $507 – $1,088
Fire risk 1/10 · Minimal
- Est. fire insurance / yr
- $947 – $1,759
Heat risk 10/10 · Severe
- Hot days now (above 105°F)
- 7 days/yr
- Hot days in 30 yrs
- 27 days/yr
Wind risk 10/10 · Severe
- Chance of severe wind over 30 yrs
- 99.0%
Air-quality risk 3/10 · Minor
- Unhealthy air days now
- 2 days/yr
- Unhealthy air days in 30 yrs
- 3 days/yr
Risk factors via First Street. Map © Google.
Why this score? — see what drove the D grade
The composite is a weighted blend of 9 inputs, each scored 0–100. Each bar is that input's sub-score; the figure is the points it added to the 100-point composite (weight × sub-score).
- Cash flow +12.7/30.0
- ARV discount +7.5/15.0
- 1% rule +4.1/10.0
- Schools +4.1/10.0
- Livability +4.1/5.0
- DSCR +3.8/10.0
- Rent growth +2.8/5.0
- Condition / age +2.5/5.0
- Appreciation +0.0/10.0
$215,000
🖨 Deal sheet 📄 Offer letter ✓ Due diligence
Listing remarks
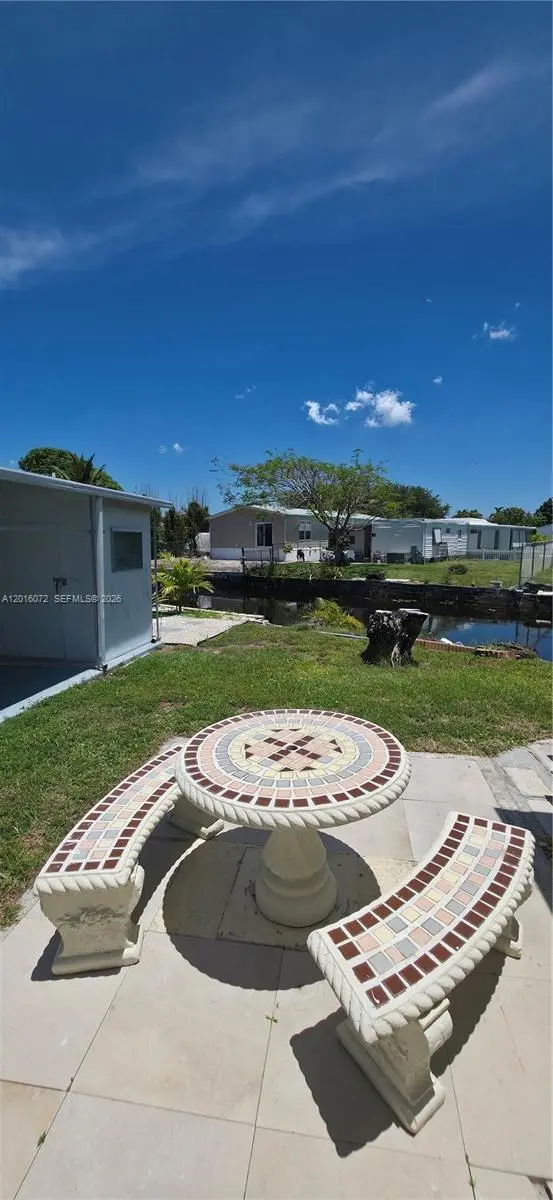
Very prestigious Park City Neighborhood, Enjoy it this just remodeled udpdated single mobile home with 3 bedrooms and spacious livingroom area. New air conditioner very cold fresh in the whole house a lot of air conditioner outlets. new kitchen and counters. Screened Porch, Laminate Flooring. A lot of windows in single room that offer natural Light Enough. Huge patio on the back arounding the house with the canal in the back. The community offers pools, golf course and lake! Laundry. Dryer and Washer. Parking 2 Attached Carport Spaces. Security Resident Manager or Management On Site. Pet Policy Breed Restrictions. Peaceful 55+ senior community with a social schedule with something for ever
Key facts
- Laminate flooring
- Huge patio
- New air conditioner
Tags
Property features AI
Finance
- Financial info: Pets conditionally allowed (restrictions may apply)
- HOA & community: Monthly association fee of $89; Community features: clubhouse, pool; Senior community
Exterior
- Parking: Attached garage (1 covered space)
- Utilities: Electric heating and cooling
- Home design: Manufactured home; Single-story; Faces west; First-floor entry
- Construction: Manufactured construction; Resale home
- Exterior features: Front porch; Open porch; Above-ground community pool; Canal-front waterfront
Interior
- Flooring: Laminate
- Bathrooms: 2 full bathrooms
- Heating & cooling: Electric heating; Electric cooling
- Interior features: First-floor entry; Laminate flooring; Room types include Other
- Laundry & utility: Washer and dryer; Laundry located in garage
Neighborhood map
What this means for you Summary
Snapshot
- This is a 2-bed/2.0-bath manufactured listed at $215k.
Deal economics
- At list price, monthly cash flow is $-23 ($-275/yr) — negative.
- To cash-flow at today's rent, offer at most $211k (1.9% below list).
- To meet the 1% rule (rent ≥ 1% of price), the offer needs to be $196k (9.0% below list).
- Recommended offer: $196k (9.0% below list) — sets the bar for 1% rule.
- Cap rate 6.2% vs local median 3.4% in Davie — top-decile yield for the area; either an underpriced asset or a hidden risk that comps aren't pricing in. Stress-test before assuming the spread holds.
Location & tenants
- Location reads 82/100 on livability (#68 in FL, #1,159 nationally) — a professional / high-income tenant draw. Strengths: schools A+, crime A+, housing A+; Watch: cost of living D, amenities D-.
- Broward (suburban): math 42% / reading 53% proficiency, ranked #46 of 73 in FL (top 63%) — families likely to look elsewhere, expect single-tenant / working-renter base with shorter leases.
- Market conditions: Rents rising (+1.2%/yr); 398 active listings in the ZIP; 26 comparable units currently listed for rent nearby; rentals leasing fast (median 8d on market — plan ~1-2 weeks tenant-placement turnaround); solid renter incomes; 2,111 units permitted in Broward County in 2024 (1,265 in 5+ unit buildings).
Forward outlook
- Local home prices are declining (-3.0%/yr); year-one equity from $1k of loan paydown is wiped out by about $6k of value loss. Plan a longer hold.
- Broward County population projected at +34% by 2050 — long-run rental-demand tailwind backs the buy-and-hold thesis.
Negotiation context
- It's been on market 39 days — a 3% lower offer ($209k) is reasonable based on typical stale-listing flexibility.
- Current owner paid $110k; list at $215k implies a 95% gain — meaningful room to come down on a strong offer.
Risks & watch-outs
- Climate carrying-cost: severe wind risk, 99% chance of damaging wind over 30y; extreme-heat days projected 7→27/yr by 2055 (HVAC capex compounding) — expect insurance premiums to compound above CPI over the hold.
Questions for the listing agent
- What do current leases actually rent for vs. the listed asking? Can we see a recent rent roll and the last 12 months of T-12 income?
- It's been on market 39 days. Have you received any prior offers? Is the seller open to a 9% concession, seller financing, or rate buy-down credit?
- Built in 1968 — when were the roof, HVAC, electrical panel, plumbing, and water heater last replaced?
- What does the HOA fee cover, when was the last increase, and are there any pending special assessments or reserve-fund shortfalls?
- Is there a deadline driving the sale (1031 exchange, divorce, estate, relocation)? That informs how much negotiation room exists.
- Schools are A-rated — typically a magnet for longer-tenancy family renters. What's the average tenant stay here, and is there a school-zone premium baked into asking?
- The area grade is low — what's the realistic commute time and amenity access for the typical tenant pool here? Any planned neighborhood developments (good or bad) we should know about?
- What's the average days-on-market for RENTAL listings here right now (not sales)? A rising rental-DOM trend means longer vacancies and softer asking-rent achievability than the comps imply.
- What's the recent tenant-quality profile in this submarket — average credit score on applications, eviction rate, late-payment / NSF rate, and stable-employment percentage? A property-management company in the area should have these aggregated.
- How much new for-sale + rental construction is in the pipeline within 1–3 miles? Heavy new supply typically softens prices + rents 12–24 months out; constrained supply supports both.
Investment metrics
- 1% rule
- 0.91% ✗
- Cap rate
- 6.17%
- Cash-on-cash
- -0.46%
- DSCR
- 0.98
- GRM
- 9.2
CMA / ARV
- ARV (on-the-fly)
- $73,185
- Comps found
- 1
Show comp detail 1 sale within ~0.75 mi
| Address | Dist | Beds/Ba | Sqft | Sold | Price | $/sf | Match |
|---|---|---|---|---|---|---|---|
| 8641 SW 15th Ct | 0.22mi | 2/1.5 | 664 (+12%) | 12mo | $82,000 | $123 | 58 |
Match score weights: distance 35% · size 25% · config 20% · recency 20%. Top-matched comps best support the ARV.
Projected returns pro-forma
-3.0% appreciation · 1.23% rent growth · sell at horizon
- IRR
- -19.1%
- Equity multiple
- 0.34×
- Total profit
- $-39,642
- Equity at exit
- $32,057
- IRR
- -16.0%
- Equity multiple
- 0.18×
- Total profit
- $-49,630
- Equity at exit
- $18,589
Cash invested: $60,200 (down + closing). Projections, not guarantees.
Landlord ↔ Tenant lean methodology
- Overall (STATE)
- 87 Strongly Landlord-Friendly
- State Florida
- 87 Strongly Landlord-Friendly · R+3
- County
- — inherits STATE
- City
- — inherits STATE
ZIP-level market 33324
- Home prices YoY
- -33.5%
- Rents YoY
- 1.2%
- Active inventory
- 398
- Price-to-rent
- 9.2×
Monthly cashflow live
- Estimated rent
- $1,956 high interval (Pro) →
- Mortgage (P&I)
- −$1,127
- Tax from tax record
- −$262 /mo · $3,147/yr
- Insurance
- −$90
- HOA
- −$89
- Vacancy / Maint / Mgmt
- −$411
- Net cashflow
- $-23
Break-even live
UW: 25.0% down · 7.5% · 30yr · 1.5% tax · 5.0% vac · 8.0% maint · 8.0% mgmt
Financing live
Cash to close
- Down payment
- $53,750
- Closing costs
- $6,450
- Reserves months
- —
- Total cash needed
- —
Loan-product check · same deal, 3 products live
Conventional
25% down · 7.5% · 30yr
- Down + closing
- —
- Monthly P&I
- —
- Monthly cashflow
- —
- DSCR
- —
- Eligible?
- —
Personal DTI + credit; lowest rate.
DSCR
20% down · 8.5% · 30yr
- Down + closing
- —
- Monthly P&I
- —
- Monthly cashflow
- —
- DSCR
- —
- Eligible?
- —
No personal income docs; deal must DSCR.
Hard money
10% down · 12.0% · 12mo
- Down + closing
- —
- Monthly P&I
- —
- Monthly cashflow
- —
- DSCR
- —
- Eligible?
- —
Short-term bridge; refi at stabilization.
Rent comps 26 comps
| Address | Beds | Baths | Sqft | Rent | $/sqft | DOM | Units | Dist |
|---|---|---|---|---|---|---|---|---|
| 8508 SW 16th Ct Davie, FL | 3.0 | 2.0 | 613 | $1,700 | $2.77 | 13d | 1 | 0.05mi |
| 8717 SW 16th Pl Davie, FL | 1.0 | 1.0 | 600 | $1,300 | $2.17 | 3d | 1 | 0.20mi |
| 8717 SW 16th Pl Davie, FL | 1.0 | 1.0 | 600 | $1,500 | $2.50 | 22d | 1 | 0.20mi |
| 1244 S Pine Island Rd Plantation, FL | 1.0–3.0 | 1.0–2.0 | 1057 | $2,606 | $2.47 | 2d | 36 | 0.42mi |
| 1650 SW 78th Ave Plantation, FL | 1.0–3.0 | 1.0–2.0 | 1040 | $2,664 | $2.56 | 2d | 33 | 0.63mi |
| 9460 Tangerine Pl Davie, FL | 1.0–3.0 | 1.0–2.0 | 865 | $2,400 | $2.77 | 3d | 3 | 0.65mi |
| 8021 Peters Rd Plantation, FL | 1.0–3.0 | 1.0–2.0 | 1040 | $3,241 | $3.11 | 1d | 27 | 0.70mi |
| 8101 SW 24th Ct Davie, FL | 1.0–2.0 | 1.5–2.0 | 881 | $2,300 | $2.61 | 15d | 4 | 0.71mi |
| 2430 SW 81st Ave #305 Davie, FL | 1.0 | 1.5 | 741 | $1,700 | $2.29 | 24d | 1 | 0.74mi |
| 2495 SW 82nd Ave #304 Davie, FL | 1.0 | 1.5 | 727 | $1,600 | $2.20 | 7d | 1 | 0.78mi |
| 2571 SW 79th Ave Davie, FL | 1.0 | 1.0 | 609 | $1,771 | $2.91 | 1d | 4 | 0.87mi |
| 9441 Evergreen Pl #206 Davie, FL | 1.0 | 1.0 | 700 | $1,900 | $2.71 | 3d | 1 | 0.92mi |
| 9461 Evergreen Pl #306 Davie, FL | 1.0 | 1.0 | 690 | $1,650 | $2.39 | 24d | 1 | 0.94mi |
| 730 SW 78th Ave Plantation, FL | 1.0–2.0 | 1.0–2.0 | 1073 | $3,369 | $3.14 | 1d | 11 | 0.95mi |
| 9050 Jacaranda Ln #8 Plantation, FL | 1.0 | 1.0 | 721 | $1,725 | $2.39 | 7d | 1 | 0.96mi |
| 9050 Jacaranda Ln #8 Plantation, FL | 1.0 | 1.0 | 721 | $1,725 | $2.39 | 24d | 1 | 0.96mi |
| 9441 Live Oak Pl #307 Davie, FL | 1.0 | 1.0 | 654 | $1,700 | $2.60 | 24d | 1 | 0.98mi |
| 700 SW 78th Ave Plantation, FL | 2.0 | 1.0–2.0 | 962 | $3,160 | $3.28 | 1d | 19 | 0.99mi |
| 405 S Pine Island Rd Unit 308D Plantation, FL | 1.0 | 1.0 | 656 | $1,650 | $2.52 | 3d | 1 | 1.14mi |
| 405 S Pine Island Rd Unit 406D Plantation, FL | 1.0 | 1.0 | 656 | $1,800 | $2.74 | 7d | 1 | 1.14mi |
| 405 S Pine Island Rd Unit 308D Plantation, FL | 1.0 | 1.0 | 656 | $1,750 | $2.67 | 20d | 1 | 1.14mi |
| 2900 S University Dr Davie, FL | 1.0 | 1.0 | 607 | $1,900 | $3.13 | 22d | 2 | 1.22mi |
| 2900 S University Dr Davie, FL | 1.0 | 1.0 | 607 | $1,900 | $3.13 | 24d | 2 | 1.22mi |
| 2926 S University Dr #6205 Davie, FL | 1.0 | 1.0 | 565 | $1,800 | $3.19 | 3d | 1 | 1.25mi |
| 1 S Pine Island Rd Plantation, FL | 2.0 | 1.0–2.0 | 922 | $2,530 | $2.74 | 2d | 13 | 1.42mi |
| 150 SW 91st Ave Plantation, FL | 1.0–3.0 | 1.0–2.0 | 962 | $2,438 | $2.53 | 2d | 19 | 1.48mi |
HOA detail
- Monthly dues
- $89 · $1,068/yr
- Likely covers
- poolsecurity
Listing history 18 events
-
2026-06-18days on market $215,000 Active 39 DOM
-
2026-06-17days on market $215,000 Active 38 DOM
-
2026-06-16days on market $215,000 Active 37 DOM
-
2026-06-15days on market $215,000 Active 36 DOM
-
2026-06-13days on market $215,000 Active 34 DOM
-
2026-06-09days on market $215,000 Active 30 DOM
-
2026-06-08days on market $215,000 Active 29 DOM
-
2026-06-07days on market $215,000 Active 28 DOM
-
2026-06-04days on market $215,000 Active 25 DOM
-
2026-06-03days on market $215,000 Active 24 DOM
-
2026-06-02days on market $215,000 Active 23 DOM
-
2026-06-01days on market $215,000 Active 22 DOM
-
2026-05-31days on market $215,000 Active 21 DOM
-
2026-05-09$215,000 Active
-
2023-06-16soldstatus $110,000
-
2004-05-14soldstatus $47,000
-
1983-11-01soldstatus $26,500
-
1980-04-01soldstatus $17,000
ⓘ Source: listings_history table (triggers on properties + properties_extension) + one-shot
backfill from property_details.listing_events for pre-trigger history.
Tax reassessment forecast FL · Resets to sale price
- Current annual tax
- $3,147 · $262/mo
- Projected year-2 tax
- $3,147 · $262/mo
- Expected delta
- $0/yr ($0/mo · 0.0%)
ⓘ Screening estimate from a state-policy table — verify with the county assessor before closing.
Climate risk First Street
- Flood 1/10 Low FEMA zone X (shaded) · 0% chance over 30 yrs
- Wildfire 1/10 Low
- Heat 10/10 Extreme 7 d/yr ≥105°F today · 27 d/yr by 30 yrs out
- Wind 10/10 Extreme 99% chance of damaging wind over 30 yrs
- Air quality 3/10 Moderate 2 unhealthy d/yr today · 3 by 30 yrs out
Nearby sold comps map
Loading sold comps map…
Walkable amenities ~0.75 mi
Loading nearby amenities…
Taxation est. · year 1
- Rental income
- $23,474
- − Mortgage interest
- −$12,043
- − Property taxes
- −$3,147
- − Insurance
- −$1,075
- − Repairs & maintenance
- −$1,878
- − Management
- −$1,878
- − HOA
- −$1,068
- − Depreciation
- −$6,255
- Taxable loss
- −$3,869
- Est. tax savings @ 24.0%
- +$929
- After-tax cash flow
- $654/yr
For passive investors: Depreciation is non-cash, so a rental often shows a tax loss while cash-flowing — sheltering income. Rental losses are passive: they offset passive income freely, and up to $25,000/yr can offset ordinary (W-2) income if you actively participate and your MAGI is under $100k (phasing out to $0 by $150k); unused losses carry forward. On sale, claimed depreciation is recaptured at up to 25%, and gains may owe capital-gains tax (a 1031 exchange can defer both). Figures are a year-1 estimate at your 24.0% rate — not tax advice; consult a CPA.
Schools (NCES district)
- District
- Broward
- NCES district ID
- 1200180
- Math proficiency
- 42% ▼ -18.00%
- Reading proficiency
- 53% ▼ -5.00%
- Median HH income
- $52,139
- Composite
- 40.88/100
- National rank
- #3621
- State rank
- #46 of 73 in FL
Livability — Davie
- Score
- 82/100
- State rank
- #68
- US rank
- #1159
Category grades
Schools grade is shown separately in the Schools card above.
Census & demographics
- Census place
- Davie, FL
- County
- Broward County · 1,963,430 people
- City population
- 92,317
- Metro
- Miami-Fort Lauderdale-Pompano Beach, FL
- Population (ZIP)
- 50,151
- Household income
- $85,000
- Rent vs Own
- Severe rent burden
- 2923.0
Population outlook (Broward County) Hauer SSP2
- Today (2025)
- 2,207,033 people
- By 2030
- 2,360,704 · +7.0%
- By 2040
- 2,661,208 · +20.6%
- By 2050
- 2,946,698 · +33.5%
- By 2075
- 3,602,273 · +63.2%
- By 2100
- 3,970,984 · +79.9%
Race, ethnicity, and origin ACS 2023
- Neighborhood character
- Diverse neighborhood (Simpson 0.69)
- Race & ethnicity
- White 42% Hispanic / Latino 31% Two or more races 20% Black 16% Asian 6%
- Hispanic origin (detail)
- Mexican 2% Puerto Rican 5% Cuban 4% Dominican 2%
- Common ancestry
- Romanian 3% Italian 3% Hispanic 3%
- Foreign-born
- 31% · Canada, Jamaica, China
- Languages at home
- 60% English-only · Spanish 26% Other Indo-European 4% French/Haitian/Cajun 3%
Political lean MEDSL · Broward
- 2024 margin
- D (+17.0) · D 58.0% · R 41.0%
- 2008→2024 swing
- -17.8pp toward R · 2008: 34.7pp · 2024: 17.0pp
- All cycles
- 2024: D+17.0 2020: D+29.8 2016: D+35.0 2012: D+34.9 2008: D+34.7
Not yet ingested
- Civics
- —
Market trends
- HPI YoY
- ▼ -160.16%
- Current HPI
- 317.8685
- Rent YoY
- ▲ 1.23%
- Metro
- Miami-Fort Lauderdale-Pompano Beach, FL
- State GDP YoY
- ▲ 3.28%
- F500 in state
- 36
Industry mix (Fortune 500 HQ in FL)
| Industry | F500 HQs | Revenue |
|---|---|---|
| Industrial Technology | 2 | $29B |
|
||
| Insurance | 2 | $17B |
|
||
| Retail | 1 | $60B |
|
||
| Technology Distribution | 1 | $58B |
|
||
| Homebuilding | 1 | $35B |
|
||
| Technology Manufacturing | 1 | $35B |
|
||
Price history
+1164.7% since first listed5 events — show timeline
- 2026-05-09 Listed $215,000 MARMLS
- 2023-06-16 Sold (Public Records) $110,000 Public Records
- 2004-05-14 Sold (Public Records) $47,000 Public Records
- 1983-11-01 Sold (Public Records) $26,500 Public Records
- 1980-04-01 Sold (Public Records) $17,000 Public Records
Property tax history
+20.5%/yrLatest (2025): $3,147 · +20.7% YoY. Source: county tax records.
Cash-flow waterfall
monthlySold comps — $/sqft
last 12 mo · ≤1 miLoading sold comps…