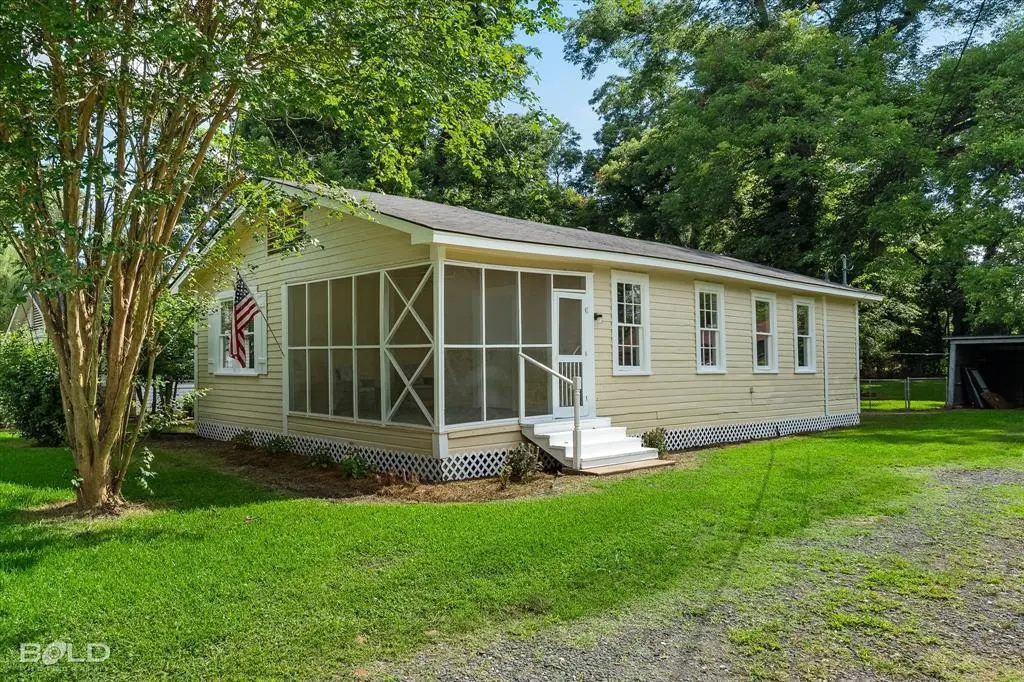
323 Butler Rd · Belcher, LA
Flood risk 3/10 · Minor
- FEMA flood zone
- X
- Chance of flooding over 30 yrs
- 0.2%
- Est. flood insurance / yr
- $507 – $1,088
Fire risk 2/10 · Minimal
- Est. fire insurance / yr
- $1,269 – $2,357
Heat risk 7/10 · Major
- Hot days now (above 111°F)
- 7 days/yr
- Hot days in 30 yrs
- 22 days/yr
Wind risk 6/10 · Moderate
- Chance of severe wind over 30 yrs
- 59.0%
Air-quality risk 2/10 · Minimal
- Unhealthy air days now
- 0 days/yr
- Unhealthy air days in 30 yrs
- 1 days/yr
Risk factors via First Street. Map © Google.
Why this score? — see what drove the C- grade
The composite is a weighted blend of 9 inputs, each scored 0–100. Each bar is that input's sub-score; the figure is the points it added to the 100-point composite (weight × sub-score).
- Cash flow +23.8/30.0
- DSCR +7.6/10.0
- 1% rule +5.1/10.0
- Appreciation +3.7/10.0
- Livability +2.9/5.0
- Rent growth +2.5/5.0
- Condition / age +2.5/5.0
- Schools +2.2/10.0
- ARV discount +0.0/15.0
$110,000
🖨 Deal sheet (PDF) 📄 Offer letter ✓ Due diligence
Listing remarks MLS
Investors! Make this home your next rental property or flip. Cash or non-traditional financing. Central heat and air. New roof in 2021. New Pex indoor water lines in 2022. Original hard wood floors. Large, fully fenced in back yard with storage shed. Septic system.
Key facts
- Brand new appliances
- 0.33 acre lot
- Parking
Tags
Property features AI
Finance
- Other: Property type: Residential, single family; Parcel number available
- Financial info: Treat as clear loan handling; No second mortgage indicated
- HOA & community: No homeowners association
Exterior
- Parking: One covered parking space; One carport space; Shared driveway
- Utilities: City water; Septic system; Not in a municipal utility district
- Home design: Single-family residence; Attached property; Built in 1950
- Construction: Year built: 1950
- Exterior features: Lot under half an acre (approximately 0.33 acre); Subdivision: Td Connell Add
Interior
- Kitchen: Dishwasher; Gas cooktop; Refrigerator
- Bedrooms: Three bedrooms (all on main level); Primary bedroom (on main level)
- Bathrooms: Two full bathrooms
- Interior features: One-level layout; Other interior features; Five total rooms; One living area; One dining area
Neighborhood map
What this means for you Summary
Snapshot
- This is a 3-bed/2.0-bath single-family listed at $110k.
Deal economics
- At list price, monthly cash flow is $210 ($3k/yr) — positive.
- The deal already cash-flows at list — no discount required.
- Meets the 1% rule at list price ($1k rent vs $110k).
Location & tenants
- Location reads 57/100 on livability (#323 in LA) — a working-class tenant base; expect higher turnover. Strengths: schools A+, cost of living A+, housing B+; Watch: crime F, amenities F, commute F.
- Caddo Parish (urban): math 21% / reading 32% proficiency, ranked #53 of 98 in LA (top 54%) — low school quality limits family demand, transient renter base, plan for 1-2y turnover; 64% free/reduced lunch — lower-income household profile, screen leases tightly.
- Market conditions: 3 active listings in the ZIP; 221 units permitted in Caddo Parish in 2024 (0 in 5+ unit buildings).
Forward outlook
- Local home prices are declining (-2.5%/yr); year-one equity from $761 of loan paydown is wiped out by about $3k of value loss. Plan a longer hold.
- Caddo County population projected at -15% by 2050 — secular population decline; favor cash flow + early exit over multi-decade hold.
Negotiation context
- Only 1 days on market — expect competitive offers; lowballing is unlikely to land.
- 5 sale attempts since 4y ago with the ask held roughly flat each time — persistent listings suggest the price (not the market) is what's stuck; bring a comps-based counter.
- Current owner paid $84k; 31% above their basis — modest negotiation headroom, anchor on the comps not their cost.
Risks & watch-outs
- Watch-outs: built in 1950 — expect roof / HVAC / electrical / plumbing capex.
- Climate carrying-cost: major wind risk, 59% chance of damaging wind over 30y; extreme-heat days projected 7→22/yr by 2055 (HVAC capex compounding) — expect insurance premiums to compound above CPI over the hold.
Questions for the listing agent
- Built in 1950 — when were the roof, HVAC, electrical panel, plumbing, and water heater last replaced?
- Is there a deadline driving the sale (1031 exchange, divorce, estate, relocation)? That informs how much negotiation room exists.
- Schools are A-rated — typically a magnet for longer-tenancy family renters. What's the average tenant stay here, and is there a school-zone premium baked into asking?
- Crime grade is F in this area — have there been break-ins, vandalism, or insurance claims at this property in the last 3 years? What carrier currently insures it and at what premium?
- What's the average days-on-market for RENTAL listings here right now (not sales)? A rising rental-DOM trend means longer vacancies and softer asking-rent achievability than the comps imply.
- What's the recent tenant-quality profile in this submarket — average credit score on applications, eviction rate, late-payment / NSF rate, and stable-employment percentage? A property-management company in the area should have these aggregated.
- How much new for-sale + rental construction is in the pipeline within 1–3 miles? Heavy new supply typically softens prices + rents 12–24 months out; constrained supply supports both.
Investment metrics
- 1% rule
- 1.01% ✓
- Cap rate
- 8.59%
- Cash-on-cash
- 8.20%
- DSCR
- 1.36
- GRM
- 8.3
CMA / ARV
- ARV (on-the-fly)
- $83,472
- Comps found
- 1
Show comp detail 1 sale within ~0.75 mi
| Address | Dist | Beds/Ba | Sqft | Sold | Price | $/sf | Match |
|---|---|---|---|---|---|---|---|
| 323 Butler Rd | 0.00mi | 3/2.0 | 1,128 (0%) | 8mo | $84,000 | $74 | 94 |
Match score weights: distance 35% · size 25% · config 20% · recency 20%. Top-matched comps best support the ARV.
Projected returns pro-forma
-2.51% appreciation · 3.0% rent growth · sell at horizon
- IRR
- -1.8%
- Equity multiple
- 0.93×
- Total profit
- $-2,174
- Equity at exit
- $18,834
- IRR
- 7.0%
- Equity multiple
- 1.56×
- Total profit
- $17,185
- Equity at exit
- $13,743
Cash invested: $30,800 (down + closing). Projections, not guarantees.
Landlord ↔ Tenant lean methodology
- Overall (STATE)
- 90 Strongly Landlord-Friendly
- State Louisiana
- 90 Strongly Landlord-Friendly · R+12
- County
- — inherits STATE
- City
- — inherits STATE
ZIP-level market 71004
- Home prices YoY
- -2.5%
- Active inventory
- 3
- Price-to-rent
- 8.3×
Monthly cashflow live
- Estimated rent
- $1,108 medium interval (Pro) →
- Mortgage (P&I)
- −$577
- Tax from tax record
- −$42 /mo · $505/yr
- Insurance
- −$46
- HOA
- −$0
- Vacancy / Maint / Mgmt
- −$233
- Net cashflow
- $210
Break-even live
Sensitivity live
| Price | -10% $273 | -5% $242 | +0% $210 | +5% $179 | +10% $148 |
|---|---|---|---|---|---|
| Rent | -10% $123 | -5% $167 | +0% $210 | +5% $254 | +10% $298 |
| Rate | -1.0pp $266 | -0.5pp $238 | base $210 | +0.5pp $182 | +1.0pp $153 |
UW: 25.0% down · 7.5% · 30yr · 1.5% tax · 5.0% vac · 8.0% maint · 8.0% mgmt
Financing live
Cash to close
- Down payment
- $27,500
- Closing costs
- $3,300
- Reserves months
- —
- Total cash needed
- —
Loan-product check · same deal, 3 products live
Conventional
25% down · 7.5% · 30yr
- Down + closing
- —
- Monthly P&I
- —
- Monthly cashflow
- —
- DSCR
- —
- Eligible?
- —
Personal DTI + credit; lowest rate.
DSCR
20% down · 8.5% · 30yr
- Down + closing
- —
- Monthly P&I
- —
- Monthly cashflow
- —
- DSCR
- —
- Eligible?
- —
No personal income docs; deal must DSCR.
Hard money
10% down · 12.0% · 12mo
- Down + closing
- —
- Monthly P&I
- —
- Monthly cashflow
- —
- DSCR
- —
- Eligible?
- —
Short-term bridge; refi at stabilization.
Listing history 2 events
-
2026-06-18remarks 312-char remark
-
2026-06-18$110,000 Active 1 DOM
ⓘ Source: listings_history table (triggers on properties + properties_extension) + one-shot
backfill from property_details.listing_events for pre-trigger history.
Tax reassessment forecast LA · Resets to sale price
- Current annual tax
- $505 · $42/mo
- Projected year-2 tax
- $605 · $50/mo
- Expected delta
- +$100/yr (+$8/mo · 19.8%)
ⓘ Screening estimate from a state-policy table — verify with the county assessor before closing.
Climate risk First Street
- Flood 3/10 Moderate FEMA zone X · 20% chance over 30 yrs
- Wildfire 2/10 Low
- Heat 7/10 Severe 7 d/yr ≥111°F today · 22 d/yr by 30 yrs out
- Wind 6/10 Major 59% chance of damaging wind over 30 yrs
- Air quality 2/10 Low 0 unhealthy d/yr today · 1 by 30 yrs out
Nearby sold comps map
Loading sold comps map…
Walkable amenities ~0.75 mi
Loading nearby amenities…
Taxation est. · year 1
- Rental income
- $13,295
- − Mortgage interest
- −$6,162
- − Property taxes
- −$505
- − Insurance
- −$550
- − Repairs & maintenance
- −$1,064
- − Management
- −$1,064
- − Depreciation
- −$3,200
- Taxable income
- $751
- Est. tax owed @ 24.0%
- −$180
- After-tax cash flow
- $2,346/yr
For passive investors: Depreciation is non-cash, so a rental often shows a tax loss while cash-flowing — sheltering income. Rental losses are passive: they offset passive income freely, and up to $25,000/yr can offset ordinary (W-2) income if you actively participate and your MAGI is under $100k (phasing out to $0 by $150k); unused losses carry forward. On sale, claimed depreciation is recaptured at up to 25%, and gains may owe capital-gains tax (a 1031 exchange can defer both). Figures are a year-1 estimate at your 24.0% rate — not tax advice; consult a CPA.
Schools (NCES district)
- District
- Caddo Parish
- NCES district ID
- 2200300
- Math proficiency
- 21% ▼ -33.00%
- Reading proficiency
- 32% ▼ -30.00%
- Median HH income
- $39,227
- Composite
- 22.23/100
- National rank
- #8148
- State rank
- #53 of 98 in LA
Livability — Belcher
- Score
- 57/100
- State rank
- #323
- US rank
- #21942
Category grades
Schools grade is shown separately in the Schools card above.
Census & demographics
- Census place
- Belcher, LA
- Population (ZIP)
- 408
Population outlook (Caddo County) Hauer SSP2
- Today (2025)
- 243,190 people
- By 2030
- 237,231 · -2.5%
- By 2040
- 222,502 · -8.5%
- By 2050
- 206,516 · -15.1%
- By 2075
- 165,706 · -31.9%
- By 2100
- 122,262 · -49.7%
Race, ethnicity, and origin ACS 2023
- Neighborhood character
- Predominantly White (81%)
- Race & ethnicity
- White 81% Black 12% Two or more races 6% Hispanic / Latino 1%
- Common ancestry
- Lithuanian 5% Italian 1% Serbian 1%
- Languages at home
- 99% English-only · Spanish 1%
Political lean MEDSL · Caddo
- 2024 margin
- Toss-up / Even · D 51.6% · R 47.0% · Other 1.4%
- 2008→2024 swing
- +1.6pp toward D · 2008: 3.0pp · 2024: 4.6pp
- All cycles
- 2024: D+4.6 2020: D+6.8 2016: D+4.2 2012: D+4.9 2008: D+3.0
Not yet ingested
- Civics
- —
Market trends
- HPI YoY
- ▼ -2.51%
- Current HPI
- 98.1262
- Rent YoY
- —
- Metro
- —
- State GDP YoY
- ▲ 3.29%
- F500 in state
- 10
Industry mix (Fortune 500 HQ in LA)
| Industry | F500 HQs | Revenue |
|---|---|---|
| Telecommunications | 2 | $23B |
|
||
| Utilities | 1 | $12B |
|
||
| Wholesale / Distribution | 1 | $5B |
|
||
| Advertising | 1 | $2B |
|
||
Price history
+29.6% since first listed18 events — show timeline
- 2026-06-18 Listed $110,000 NTREIS
- 2026-05-01 Listing Removed — NTREIS
- 2026-04-29 Relisted — NTREIS
- 2026-04-23 Pending — NTREIS
- 2026-03-27 Price Changed $119,000 NTREIS
- 2026-03-04 Listed $134,000 NTREIS
- 2025-11-07 Sold (Public Records) $84,000 Public Records
- 2025-11-07 Sold (MLS) — NTREIS
- 2025-10-19 Pending — NTREIS
- 2025-10-18 Listed $84,000 NTREIS
- 2023-04-06 Sold (Public Records) $52,000 Public Records
- 2023-04-05 Sold (MLS) — NTREIS
- 2022-11-22 Pending — NTREIS
- 2022-11-01 Price Changed $64,900 NTREIS
- 2022-10-10 Price Changed $74,900 NTREIS
- 2022-08-30 Price Changed $79,900 NTREIS
- 2022-06-29 Listed $84,900 NTREIS
- 2005-12-20 Sold (Public Records) — Public Records
Property tax history
+21.4%/yrLatest (2025): $505 · +0.3% YoY. Source: county tax records.
Cash-flow waterfall
monthlySold comps — $/sqft
last 12 mo · ≤1 miLoading sold comps…