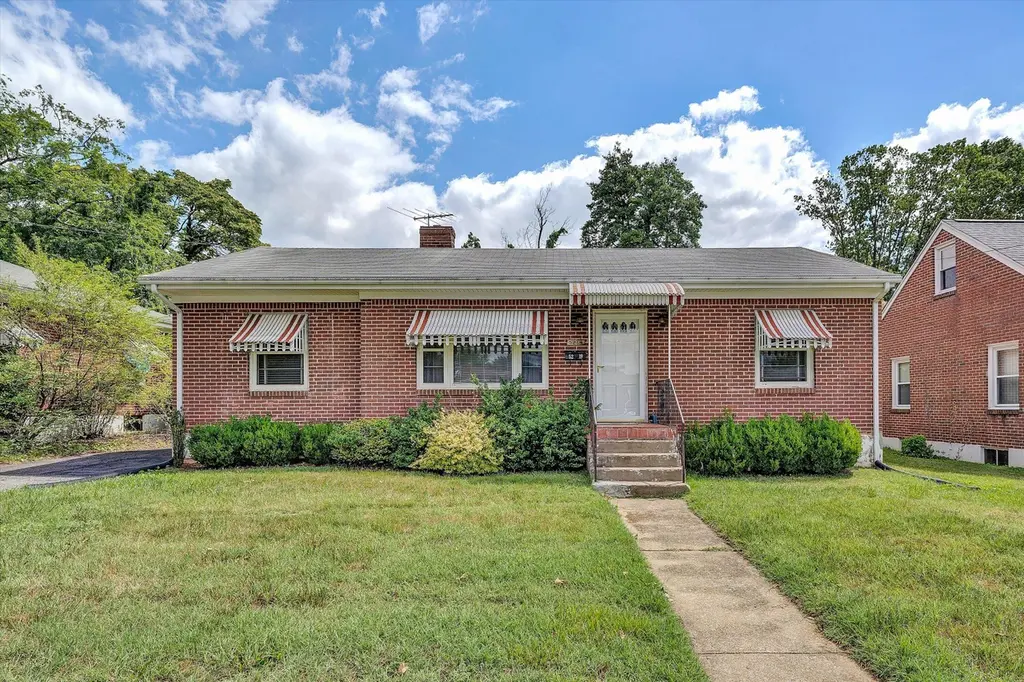
5219 Hearthstone Rd NW · Roanoke, VA
Flood risk 1/10 · Minimal
- FEMA flood zone
- X (unshaded)
- Chance of flooding over 30 yrs
- 0.0%
- Est. flood insurance / yr
- $473 – $860
Fire risk 1/10 · Minimal
- Est. fire insurance / yr
- $666 – $1,236
Heat risk 5/10 · Moderate
- Hot days now (above 100°F)
- 7 days/yr
- Hot days in 30 yrs
- 17 days/yr
Wind risk 2/10 · Minimal
- Chance of severe wind over 30 yrs
- 1.0%
Air-quality risk 1/10 · Minimal
- Unhealthy air days now
- 0 days/yr
- Unhealthy air days in 30 yrs
- 0 days/yr
Risk factors via First Street. Map © Google.
Why this score? — see what drove the C+ grade
The composite is a weighted blend of 9 inputs, each scored 0–100. Each bar is that input's sub-score; the figure is the points it added to the 100-point composite (weight × sub-score).
- Cash flow +23.6/30.0
- ARV discount +11.1/15.0
- DSCR +7.6/10.0
- 1% rule +5.5/10.0
- Rent growth +5.0/5.0
- Schools +4.1/10.0
- Livability +3.7/5.0
- Condition / age +2.5/5.0
- Appreciation +0.0/10.0
$210,000
🖨 Deal sheet (PDF) 📄 Offer letter ✓ Due diligence
Listing remarks
Welcome to this 3-bedroom, 1-bath home conveniently located in Roanoke City! This property offers comfortable one-level living with a functional floor plan. Enjoy the flat yard perfect for outdoor entertaining, gardening, pets, or play. Conveniently situated near shopping, dining, schools, parks, and major commuter routes, this home provides easy access to everything Roanoke has to offer.
Key facts
- Near schools
- Near dining
- Outdoor entertaining
Tags
Property features AI
Exterior
- Parking: 2 open parking spaces
- Utilities: Has heating; Has cooling
- Home design: Residential property; Built in 1952
- Construction: Built in 1952
- Exterior features: 0.18 acre lot
Interior
- Bedrooms: 3 bedrooms, all on the main level
- Flooring: Wood flooring
- Bathrooms: 1 full bathroom on the main level
- Heating & cooling: Forced air oil heating; Has cooling
- Interior features: 7 total rooms; Wood flooring
Neighborhood map
What this means for you Summary
Snapshot
- This is a 3-bed/1.0-bath single-family listed at $210k.
Deal economics
- At list price, monthly cash flow is $397 ($5k/yr) — positive.
- The deal already cash-flows at list — no discount required.
- Meets the 1% rule at list price ($2k rent vs $210k).
- Cap rate 8.6% vs local median 4.2% in Roanoke — top-decile yield for the area; either an underpriced asset or a hidden risk that comps aren't pricing in. Stress-test before assuming the spread holds.
Location & tenants
- Location reads 73/100 on livability (#163 in VA) — a middle-class / working-renter tenant base. Strengths: cost of living A+, health & safety A+, housing A; Watch: amenities C-, employment D, crime F.
- Roanoke City Public School District (urban): math 40% / reading 58% proficiency, ranked #102 of 131 in VA (top 78%) — families likely to look elsewhere, expect single-tenant / working-renter base with shorter leases; 67% free/reduced lunch — lower-income household profile, screen leases tightly.
- Zoned schools: Preston Park Elementary (math 33% / reading 51%, grade F, #866 of 1,108 statewide, top 80%, 505 students, 102% FRL); Breckinridge Middle (math 23% / reading 52%, grade F, #315 of 342 statewide, top 93%, 624 students, 99% FRL); William Fleming High (math 66% / reading 68%, grade B, #185 of 319 statewide, top 61%, 1,911 students, 96% FRL) — zoned schools average 99% FRL vs 67% district-wide (32 pts higher); higher-poverty schools than district average — tighter screening recommended.
- Market conditions: Rents rising fast (+10.5%/yr); 196 active listings in the ZIP; 3 comparable units currently listed for rent nearby; rentals at typical pace (median 22d on market — plan ~3-4 weeks tenant-placement turnaround); 113 units permitted in Roanoke city in 2024 (0 in 5+ unit buildings).
- At $2,215/mo this rent would consume 50% of the median local household income ($53k/yr) (locally 1360% of renters already pay >50% of income on rent) — very limited rent-growth headroom before tenants either downsize or default.
Forward outlook
- Local home prices are declining (-3.0%/yr); year-one equity from $1k of loan paydown is wiped out by about $6k of value loss. Plan a longer hold.
- Roanoke County population projected at +11% by 2050 — modest demand growth; plan on rents tracking national, not racing it.
- At projected returns (-3.0% appreciation + 8.0% rent growth), your $59k cash investment doubles in ~8 years — after that, you're playing with house money.
Negotiation context
- Only 4 days on market — expect competitive offers; lowballing is unlikely to land.
- Current owner paid $90k; list at $210k implies a 133% gain — meaningful room to come down on a strong offer.
Risks & watch-outs
- Watch-outs: built in 1952 — expect roof / HVAC / electrical / plumbing capex.
- Climate carrying-cost: extreme-heat days projected 7→17/yr by 2055 (HVAC capex compounding) — expect insurance premiums to compound above CPI over the hold.
Questions for the listing agent
- Built in 1952 — when were the roof, HVAC, electrical panel, plumbing, and water heater last replaced?
- Is there a deadline driving the sale (1031 exchange, divorce, estate, relocation)? That informs how much negotiation room exists.
- Schools are A-rated — typically a magnet for longer-tenancy family renters. What's the average tenant stay here, and is there a school-zone premium baked into asking?
- Crime grade is F in this area — have there been break-ins, vandalism, or insurance claims at this property in the last 3 years? What carrier currently insures it and at what premium?
- What's the average days-on-market for RENTAL listings here right now (not sales)? A rising rental-DOM trend means longer vacancies and softer asking-rent achievability than the comps imply.
- What's the recent tenant-quality profile in this submarket — average credit score on applications, eviction rate, late-payment / NSF rate, and stable-employment percentage? A property-management company in the area should have these aggregated.
- How much new for-sale + rental construction is in the pipeline within 1–3 miles? Heavy new supply typically softens prices + rents 12–24 months out; constrained supply supports both.
Investment metrics
- 1% rule
- 1.05% ✓
- Cap rate
- 8.56%
- Cash-on-cash
- 8.10%
- DSCR
- 1.36
- GRM
- 7.9
CMA / ARV
- ARV (on-the-fly)
- $228,480
- Comps found
- 12
Show comp detail 12 sales within ~0.75 mi
| Address | Dist | Beds/Ba | Sqft | Sold | Price | $/sf | Match |
|---|---|---|---|---|---|---|---|
| 1017 Curtis Ave NW | 0.22mi | 3/1.0 | 1,800 (-6%) | 6mo | $120,000 | $67 | 76 |
| 902 Whitney Ave NW | 0.23mi | 2/1.0 (-1) | 1,792 (-6%) | 1mo | $181,800 | $101 | 73 |
| 937 Curtis Ave NW | 0.23mi | 3/1.0 | 2,043 (+7%) | 5mo | $215,000 | $105 | 73 |
| 4908 Rutgers St NW | 0.49mi | 3/1.0 | 1,976 (+4%) | 9mo | $190,000 | $96 | 64 |
| 5001 Hazelridge Rd NW | 0.50mi | 3/1.0 | 2,012 (+6%) | 6mo | $220,000 | $109 | 62 |
| 5907 Darby Rd | 0.71mi | 3/1.0 | 2,000 (+5%) | 2mo | $239,500 | $120 | 57 |
| 3302 Frontier Rd NW | 0.68mi | 3/1.0 | 2,050 (+8%) | 3mo | $250,000 | $122 | 53 |
| 4713 Delray St NW | 0.43mi | 3/2.0 | 1,652 (-13%) | 2mo | $260,000 | $157 | 52 |
| 4960 Florist Rd NW | 0.55mi | 4/2.0 (+1) | 2,032 (+7%) | 3mo | $249,950 | $123 | 51 |
| 3332 Maplelawn Ave NW | 0.61mi | 4/2.0 (+1) | 2,016 (+6%) | 3mo | $220,000 | $109 | 50 |
| 5838 Sierra Dr NW | 0.67mi | 3/2.0 | 1,728 (-9%) | 1mo | $265,000 | $153 | 48 |
| 5755 Santa Anita Ter | 0.50mi | 4/2.5 (+1) | 2,100 (+10%) | 8mo | $270,000 | $129 | 42 |
Match score weights: distance 35% · size 25% · config 20% · recency 20%. Top-matched comps best support the ARV.
Projected returns pro-forma
-3.0% appreciation · 8.0% rent growth · sell at horizon
- IRR
- 1.2%
- Equity multiple
- 1.05×
- Total profit
- $2,932
- Equity at exit
- $31,312
- IRR
- 15.1%
- Equity multiple
- 2.50×
- Total profit
- $88,282
- Equity at exit
- $18,157
Cash invested: $58,800 (down + closing). Projections, not guarantees.
Landlord ↔ Tenant lean methodology
- Overall (STATE)
- 55 Moderately Landlord-Leaning
- State Virginia
- 55 Moderately Landlord-Leaning · D+2
- County
- — inherits STATE
- City
- — inherits STATE
ZIP-level market 24012
- Rents YoY
- 10.5%
- Active inventory
- 196
- Price-to-rent
- 7.9×
Monthly cashflow live
- Estimated rent
- $2,215 medium interval (Pro) →
- Mortgage (P&I)
- −$1,101
- Tax from tax record
- −$164 /mo · $1,973/yr
- Insurance
- −$88
- HOA
- −$0
- Vacancy / Maint / Mgmt
- −$465
- Net cashflow
- $397
Break-even live
Sensitivity live
| Price | -10% $516 | -5% $456 | +0% $397 | +5% $337 | +10% $278 |
|---|---|---|---|---|---|
| Rent | -10% $222 | -5% $309 | +0% $397 | +5% $484 | +10% $572 |
| Rate | -1.0pp $503 | -0.5pp $450 | base $397 | +0.5pp $343 | +1.0pp $287 |
UW: 25.0% down · 7.5% · 30yr · 1.5% tax · 5.0% vac · 8.0% maint · 8.0% mgmt
Financing live
Cash to close
- Down payment
- $52,500
- Closing costs
- $6,300
- Reserves months
- —
- Total cash needed
- —
Loan-product check · same deal, 3 products live
Conventional
25% down · 7.5% · 30yr
- Down + closing
- —
- Monthly P&I
- —
- Monthly cashflow
- —
- DSCR
- —
- Eligible?
- —
Personal DTI + credit; lowest rate.
DSCR
20% down · 8.5% · 30yr
- Down + closing
- —
- Monthly P&I
- —
- Monthly cashflow
- —
- DSCR
- —
- Eligible?
- —
No personal income docs; deal must DSCR.
Hard money
10% down · 12.0% · 12mo
- Down + closing
- —
- Monthly P&I
- —
- Monthly cashflow
- —
- DSCR
- —
- Eligible?
- —
Short-term bridge; refi at stabilization.
Rent comps 3 comps
| Address | Beds | Baths | Sqft | Rent | $/sqft | DOM | Units | Dist |
|---|---|---|---|---|---|---|---|---|
| 1017 Anchor Dr Roanoke, VA | 4.0 | 2.5 | 1998 | $2,800 | $1.40 | 22d | 1 | 0.75mi |
| 6525 Greenway Dr Roanoke, VA | 1.0–3.0 | 1.0–1.5 | 1071 | $1,875 | $1.75 | 14d | 14 | 1.13mi |
| 3816 Plantation Rd NE Roanoke, VA | 2.0 | 2.0 | 1267 | $1,700 | $1.34 | 44d | 1 | 1.49mi |
Listing history 3 events
-
2026-06-21days on market $210,000 Active 4 DOM
-
2026-06-17remarks 391-char remark
-
2026-06-17$210,000 Active 1 DOM
ⓘ Source: listings_history table (triggers on properties + properties_extension) + one-shot
backfill from property_details.listing_events for pre-trigger history.
Tax reassessment forecast VA · Resets to sale price
- Current annual tax
- $1,973 · $164/mo
- Projected year-2 tax
- $1,973 · $164/mo
- Expected delta
- $0/yr ($0/mo · -0.0%)
ⓘ Screening estimate from a state-policy table — verify with the county assessor before closing.
Climate risk First Street
- Flood 1/10 Low FEMA zone X (unshaded) · 0% chance over 30 yrs
- Wildfire 1/10 Low
- Heat 5/10 Major 7 d/yr ≥100°F today · 17 d/yr by 30 yrs out
- Wind 2/10 Low 100% chance of damaging wind over 30 yrs
- Air quality 1/10 Low 0 unhealthy d/yr today · 0 by 30 yrs out
Nearby sold comps map
Loading sold comps map…
Walkable amenities ~0.75 mi
Loading nearby amenities…
Taxation est. · year 1
- Rental income
- $26,583
- − Mortgage interest
- −$11,763
- − Property taxes
- −$1,973
- − Insurance
- −$1,050
- − Repairs & maintenance
- −$2,127
- − Management
- −$2,127
- − Depreciation
- −$6,109
- Taxable income
- $1,435
- Est. tax owed @ 24.0%
- −$344
- After-tax cash flow
- $4,419/yr
For passive investors: Depreciation is non-cash, so a rental often shows a tax loss while cash-flowing — sheltering income. Rental losses are passive: they offset passive income freely, and up to $25,000/yr can offset ordinary (W-2) income if you actively participate and your MAGI is under $100k (phasing out to $0 by $150k); unused losses carry forward. On sale, claimed depreciation is recaptured at up to 25%, and gains may owe capital-gains tax (a 1031 exchange can defer both). Figures are a year-1 estimate at your 24.0% rate — not tax advice; consult a CPA.
Schools (NCES district)
- District
- Roanoke City Public School District
- NCES district ID
- 5103300
- Math proficiency
- 40% ▼ -38.00%
- Reading proficiency
- 58% ▼ -12.00%
- Median HH income
- $38,592
- Composite
- 40.8/100
- National rank
- #3639
- State rank
- #102 of 131 in VA
Livability — Roanoke
- Score
- 73/100
- State rank
- #163
- US rank
- #5055
Category grades
Schools grade is shown separately in the Schools card above.
Census & demographics
- Census place
- Roanoke, VA
- County
- Roanoke City · 101,625 people
- City population
- 168,930
- Metro
- Roanoke, VA
- Population (ZIP)
- 28,235
- Household income
- $52,973
- Rent vs Own
- Severe rent burden
- 1360.0
Population outlook (Roanoke County) Hauer SSP2
- Today (2025)
- 106,094 people
- By 2030
- 108,927 · +2.7%
- By 2040
- 114,104 · +7.5%
- By 2050
- 118,032 · +11.3%
- By 2075
- 123,363 · +16.3%
- By 2100
- 116,827 · +10.1%
Race, ethnicity, and origin ACS 2023
- Neighborhood character
- Diverse neighborhood (Simpson 0.59)
- Race & ethnicity
- White 60% Black 16% Hispanic / Latino 14% Two or more races 13% Asian 4%
- Hispanic origin (detail)
- Mexican 4% Dominican 1%
- Common ancestry
- Romanian 2% Slovak 2% Serbian 1%
- Foreign-born
- 11% · Canada, Vietnam, Jamaica
- Languages at home
- 84% English-only · Spanish 11% Other Asian/Pacific 2% Vietnamese 2%
Political lean MEDSL · Roanoke
- 2024 margin
- Strong D (+23.6) · D 61.1% · R 37.5% · Other 1.4%
- 2008→2024 swing
- +0.2pp no change · 2008: 23.4pp · 2024: 23.6pp
- All cycles
- 2024: D+23.6 2020: D+25.8 2016: D+17.6 2012: D+21.5 2008: D+23.4
Not yet ingested
- Civics
- —
Market trends
- HPI YoY
- ▼ -137.94%
- Current HPI
- 186.9007
- Rent YoY
- ▲ 10.46%
- Metro
- Roanoke, VA
- State GDP YoY
- ▲ 2.40%
- F500 in state
- 50
Industry mix (Fortune 500 HQ in VA)
| Industry | F500 HQs | Revenue |
|---|---|---|
| Aerospace / Defense | 4 | $236B |
|
||
| Technology / Defense | 3 | $32B |
|
||
| Financial Services | 2 | $176B |
|
||
| Utilities | 2 | $27B |
|
||
| Insurance | 2 | $25B |
|
||
| Technology | 2 | $15B |
|
||
Price history
+438.5% since first listed3 events — show timeline
- 2026-06-17 Listed $210,000 MLSRV
- 2019-08-12 Sold (Public Records) $90,000 Public Records
- 1984-08-29 Sold (Public Records) $39,000 Public Records
Property tax history
+11.0%/yrLatest (2025): $1,973 · +6.0% YoY. Source: county tax records.
Cash-flow waterfall
monthlySold comps — $/sqft
last 12 mo · ≤1 miLoading sold comps…