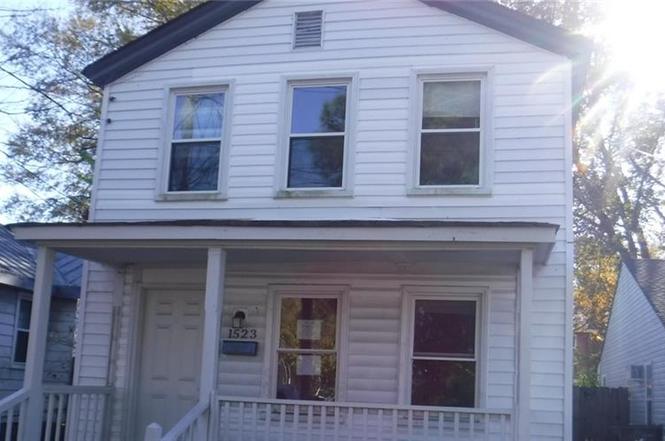
1523 Manson St · Norfolk, VA
Flood risk 1/10 · Minimal
- FEMA flood zone
- X (unshaded)
- Chance of flooding over 30 yrs
- 0.0%
- Est. flood insurance / yr
- $507 – $1,088
Fire risk 1/10 · Minimal
- Est. fire insurance / yr
- $666 – $1,236
Heat risk 9/10 · Severe
- Hot days now (above 106°F)
- 7 days/yr
- Hot days in 30 yrs
- 16 days/yr
Wind risk 8/10 · Major
- Chance of severe wind over 30 yrs
- 80.0%
Air-quality risk 5/10 · Moderate
- Unhealthy air days now
- 6 days/yr
- Unhealthy air days in 30 yrs
- 7 days/yr
Risk factors via First Street. Map © Google.
Why this score? — see what drove the B- grade
The composite is a weighted blend of 9 inputs, each scored 0–100. Each bar is that input's sub-score; the figure is the points it added to the 100-point composite (weight × sub-score).
- Cash flow +30.0/30.0
- DSCR +10.0/10.0
- 1% rule +9.7/10.0
- ARV discount +7.5/15.0
- Livability +4.2/5.0
- Schools +3.5/10.0
- Rent growth +2.5/5.0
- Condition / age +2.5/5.0
- Appreciation +0.0/10.0
$105,900
🖨 Deal sheet (PDF) 📄 Offer letter ✓ Due diligence
Listing remarks
INVESTORS-Come see this charming 3 bedroom Colonial waiting for you to update and revitalize-located near shopping and main roads. The large gutted kitchen is open to the living room. The primary bedroom is on the first floor-the remaining bedrooms are on the second floor-bathrooms are also ready for renovations. This property may qualify for Seller Financing (Vendee). If Property was built prior to 1978, Lead Based Paint Potentially Exists.
Key facts
- Large gutted kitchen
- Open to living room
- 2,495 sq ft lot
Tags
Neighborhood map
What this means for you Summary
Snapshot
- This is a 2-bed/2.0-bath single-family listed at $106k.
Deal economics
- At list price, monthly cash flow is $463 ($6k/yr) — positive.
- The deal already cash-flows at list — no discount required.
- Meets the 1% rule at list price ($2k rent vs $106k).
- Recommended offer: $104k (1.5% below list) — sets the bar for market timing.
- Cap rate 11.5% vs local median 4.0% in Norfolk — top-decile yield for the area; either an underpriced asset or a hidden risk that comps aren't pricing in. Stress-test before assuming the spread holds.
Location & tenants
- Location reads 83/100 on livability (#43 in VA, #1,026 nationally) — a professional / high-income tenant draw. Strengths: amenities A+, commute A+, health & safety A+; Watch: employment C-, crime F.
- Norfolk City Public School District (urban): math 27% / reading 56% proficiency, ranked #118 of 131 in VA (top 90%) — families likely to look elsewhere, expect single-tenant / working-renter base with shorter leases.
- Zoned schools: Southside Stem Academy At Campostella (math 11% / reading 37%, grade F, #1,064 of 1,108 statewide, top 96%, 737 students, 95% FRL); Lake Taylor High (math 38% / reading 72%, grade C, #279 of 319 statewide, top 88%, 1,030 students, 92% FRL) — zoned schools average 94% FRL vs 59% district-wide (35 pts higher); higher-poverty schools than district average — tighter screening recommended.
- Market conditions: 25 active listings in the ZIP; 29 comparable units currently listed for rent nearby; rentals at typical pace (median 25d on market — plan ~3-4 weeks tenant-placement turnaround); 438 units permitted in Norfolk city in 2024 (273 in 5+ unit buildings).
Forward outlook
- Local home prices are declining (-3.0%/yr); year-one equity from $732 of loan paydown is wiped out by about $3k of value loss. Plan a longer hold.
- At projected returns (-3.0% appreciation + 3.0% rent growth), your $30k cash investment doubles in ~7 years — after that, you're playing with house money.
Negotiation context
- It's been on market 20 days — a 2% lower offer ($104k) is reasonable based on typical stale-listing flexibility.
- 10 sale attempts since 9y ago with the ask held roughly flat each time — persistent listings suggest the price (not the market) is what's stuck; bring a comps-based counter.
Risks & watch-outs
- Watch-outs: built in 1905 — expect roof / HVAC / electrical / plumbing capex.
- Climate carrying-cost: severe wind risk, 80% chance of damaging wind over 30y; extreme-heat days projected 7→16/yr by 2055 (HVAC capex compounding) — expect insurance premiums to compound above CPI over the hold.
Questions for the listing agent
- Built in 1905 — when were the roof, HVAC, electrical panel, plumbing, and water heater last replaced?
- Is there a deadline driving the sale (1031 exchange, divorce, estate, relocation)? That informs how much negotiation room exists.
- Schools are A-rated — typically a magnet for longer-tenancy family renters. What's the average tenant stay here, and is there a school-zone premium baked into asking?
- Crime grade is F in this area — have there been break-ins, vandalism, or insurance claims at this property in the last 3 years? What carrier currently insures it and at what premium?
- What's the average days-on-market for RENTAL listings here right now (not sales)? A rising rental-DOM trend means longer vacancies and softer asking-rent achievability than the comps imply.
- What's the recent tenant-quality profile in this submarket — average credit score on applications, eviction rate, late-payment / NSF rate, and stable-employment percentage? A property-management company in the area should have these aggregated.
- How much new for-sale + rental construction is in the pipeline within 1–3 miles? Heavy new supply typically softens prices + rents 12–24 months out; constrained supply supports both.
Investment metrics
- 1% rule
- 1.47% ✓
- Cap rate
- 11.54%
- Cash-on-cash
- 18.72%
- DSCR
- 1.83
- GRM
- 5.7
CMA / ARV
- ARV (on-the-fly)
- $271,320
- Comps found
- 12
Show comp detail 12 sales within ~0.75 mi
| Address | Dist | Beds/Ba | Sqft | Sold | Price | $/sf | Match |
|---|---|---|---|---|---|---|---|
| 611 Partridge Ave | 0.23mi | 3/2.0 (+1) | 1,200 (+5%) | 1mo | $200,000 | $167 | 74 |
| 1535 Vine St | 0.05mi | 3/1.5 (+1) | 992 (-13%) | 3mo | $245,000 | $247 | 67 |
| 1415 Hibie St | 0.39mi | 3/1.5 (+1) | 1,056 (-7%) | 1mo | $247,000 | $234 | 62 |
| 1507 Colon Ave | 0.32mi | 3/2.0 (+1) | 1,050 (-8%) | 7mo | $275,000 | $262 | 61 |
| 1012 Nelson St | 0.48mi | 3/1.5 (+1) | 1,075 (-6%) | 1mo | $260,000 | $242 | 61 |
| 1314 18th St | 0.60mi | 3/2.0 (+1) | 1,212 (+6%) | 5mo | $277,000 | $229 | 52 |
| 702 Bethel Rd | 0.72mi | 3/1.0 (+1) | 1,175 (+3%) | 1mo | $309,000 | $263 | 51 |
| 410 Middlesex St | 0.53mi | 3/2.5 (+1) | 1,212 (+6%) | 8mo | $173,000 | $143 | 51 |
| 606 Bethel Rd | 0.73mi | 3/2.0 (+1) | 1,216 (+7%) | 6mo | $290,000 | $238 | 45 |
| 711 Vellines Ave | 0.49mi | 3/1.5 (+1) | 1,000 (-12%) | 9mo | $252,900 | $253 | 42 |
| 1236 Old Atlantic Ave | 0.70mi | 2/1.5 | 984 (-14%) | 6mo | $173,298 | $176 | 38 |
| 811 Whitehead Ave | 0.60mi | 3/1.0 (+1) | 980 (-14%) | 9mo | $212,500 | $217 | 32 |
Match score weights: distance 35% · size 25% · config 20% · recency 20%. Top-matched comps best support the ARV.
Projected returns pro-forma
-3.0% appreciation · 3.0% rent growth · sell at horizon
- IRR
- 10.5%
- Equity multiple
- 1.42×
- Total profit
- $12,353
- Equity at exit
- $15,790
- IRR
- 19.6%
- Equity multiple
- 2.65×
- Total profit
- $48,891
- Equity at exit
- $9,156
Cash invested: $29,652 (down + closing). Projections, not guarantees.
Landlord ↔ Tenant lean methodology
- Overall (STATE)
- 55 Moderately Landlord-Leaning
- State Virginia
- 55 Moderately Landlord-Leaning · D+2
- County
- — inherits STATE
- City
- — inherits STATE
ZIP-level market 23523
- Home prices YoY
- -16.6%
- Active inventory
- 25
- Price-to-rent
- 5.7×
Monthly cashflow live
- Estimated rent
- $1,562 high interval (Pro) →
- Mortgage (P&I)
- −$555
- Tax from tax record
- −$171 /mo · $2,058/yr
- Insurance
- −$44
- HOA
- −$0
- Vacancy / Maint / Mgmt
- −$328
- Net cashflow
- $463
Break-even live
Sensitivity live
| Price | -10% $523 | -5% $493 | +0% $463 | +5% $433 | +10% $403 |
|---|---|---|---|---|---|
| Rent | -10% $339 | -5% $401 | +0% $463 | +5% $524 | +10% $586 |
| Rate | -1.0pp $516 | -0.5pp $490 | base $463 | +0.5pp $435 | +1.0pp $407 |
UW: 25.0% down · 7.5% · 30yr · 1.5% tax · 5.0% vac · 8.0% maint · 8.0% mgmt
Financing live
Cash to close
- Down payment
- $26,475
- Closing costs
- $3,177
- Reserves months
- —
- Total cash needed
- —
Loan-product check · same deal, 3 products live
Conventional
25% down · 7.5% · 30yr
- Down + closing
- —
- Monthly P&I
- —
- Monthly cashflow
- —
- DSCR
- —
- Eligible?
- —
Personal DTI + credit; lowest rate.
DSCR
20% down · 8.5% · 30yr
- Down + closing
- —
- Monthly P&I
- —
- Monthly cashflow
- —
- DSCR
- —
- Eligible?
- —
No personal income docs; deal must DSCR.
Hard money
10% down · 12.0% · 12mo
- Down + closing
- —
- Monthly P&I
- —
- Monthly cashflow
- —
- DSCR
- —
- Eligible?
- —
Short-term bridge; refi at stabilization.
Rent comps 29 comps
| Address | Beds | Baths | Sqft | Rent | $/sqft | DOM | Units | Dist |
|---|---|---|---|---|---|---|---|---|
| 1535 Vine St Norfolk, VA | 3.0 | 1.5 | 992 | $2,100 | $2.12 | 45d | 1 | 0.08mi |
| 1510 Wilson Rd Unit 1 Norfolk, VA | 3.0 | 1.0 | 1100 | $1,325 | $1.20 | 25d | 1 | 0.20mi |
| 1510 Wilson Rd Unit 3 Norfolk, VA | 3.0 | 1.0 | 1273 | $1,200 | $0.94 | 45d | 1 | 0.20mi |
| 1510 Wilson Rd #4 Norfolk, VA | 3.0 | 1.0 | 1273 | $1,400 | $1.10 | 21d | 1 | 0.20mi |
| 1510 Wilson Rd #5 Norfolk, VA | 2.0 | 1.0 | 900 | $1,200 | $1.33 | 25d | 1 | 0.20mi |
| 1510 Wilson Rd Norfolk, VA | 3.0 | 1.0 | 815 | $1,375 | $1.69 | 45d | 1 | 0.20mi |
| 900 Partridge Ave Chesapeake, VA | 3.0 | 1.5 | 1000 | $1,900 | $1.90 | 5d | 1 | 0.34mi |
| 1100 Wilson Rd Norfolk, VA | 3.0 | 1.0 | 900 | $1,550 | $1.72 | 5d | 1 | 0.41mi |
| 1100 Wilson Rd Unit 7 Norfolk, VA | 3.0 | 1.5 | 900 | $1,550 | $1.72 | 8d | 1 | 0.41mi |
| 1201 Transylvania Ave Chesapeake, VA | 2.0 | 1.0 | 750 | $1,350 | $1.80 | 25d | 1 | 0.59mi |
| 903 Sherman Ln Norfolk, VA | 3.0 | 1.0 | 1031 | $1,850 | $1.79 | 45d | 1 | 0.63mi |
| 909 E Liberty St Norfolk, VA | 3.0 | 1.0 | 1030 | $1,495 | $1.45 | 45d | 1 | 0.68mi |
| 1009 Middlesex St Norfolk, VA | 2.0 | 2.0 | 844 | $1,189 | $1.41 | 25d | 3 | 0.77mi |
| 1321 Chesapeake Ave Unit B Chesapeake, VA | 3.0 | 1.0 | 1000 | $1,695 | $1.70 | 25d | 1 | 0.81mi |
| 1415 Commerce Ave Apt 1 Chesapeake, VA | 2.0 | 1.0 | 800 | $1,450 | $1.81 | 8d | 1 | 0.85mi |
| 711 Grayson St Unit 712-04 Norfolk, VA | 2.0 | 1.0 | 860 | $1,200 | $1.40 | 13d | 1 | 0.85mi |
| 1411 Seaboard Ave Unit A UP Chesapeake, VA | 1.0 | 1.0 | 700 | $925 | $1.32 | 3d | 1 | 0.87mi |
| 1151 Perry St Chesapeake, VA | 3.0 | 1.0 | 1296 | $2,000 | $1.54 | 18d | 1 | 0.97mi |
| 701 S Main St Norfolk, VA | 3.0 | 2.0 | 1076 | $1,349 | $1.25 | 3d | 2 | 1.08mi |
| 1333 Perry St Chesapeake, VA | 2.0 | 1.0 | 1048 | $1,525 | $1.46 | 25d | 1 | 1.09mi |
| 1333 Perry St Chesapeake, VA | 2.0 | 1.0 | 1048 | $1,495 | $1.43 | 16d | 1 | 1.10mi |
| 2638 King Ct Chesapeake, VA | 3.0 | 1.5 | 1462 | $2,000 | $1.37 | 21d | 1 | 1.17mi |
| 405 Clifton St Unit A Norfolk, VA | 2.0 | 1.0 | 700 | $1,245 | $1.78 | 25d | 1 | 1.19mi |
| 405 Clifton St Unit A Norfolk, VA | 2.0 | 2.0 | 787 | $1,245 | $1.58 | 18d | 1 | 1.19mi |
| 2620 Sunrise Ave Chesapeake, VA | 3.0 | 1.5 | 1462 | $1,850 | $1.27 | 25d | 1 | 1.21mi |
| 1712 Bainbridge Blvd Unit 4 Chesapeake, VA | 2.0 | 1.0 | 750 | $1,300 | $1.73 | 25d | 1 | 1.32mi |
| 720 Forbes St Norfolk, VA | 3.0 | 2.0 | 1056 | $2,195 | $2.08 | 16d | 1 | 1.38mi |
| 720 Forbes St Norfolk, VA | 3.0 | 2.0 | 1056 | $2,250 | $2.13 | 45d | 1 | 1.38mi |
| 2016 Pond Ln Unit 2016 Chesapeake, VA | 2.0 | 1.0 | 850 | $1,450 | $1.71 | 25d | 1 | 1.40mi |
Listing history 31 events
-
2026-01-31status Under Contract
-
2026-01-10$105,900 Active
-
2023-12-04soldstatus $182,731
-
2023-05-11soldstatus $169,000
-
2023-05-02status Under Contract
-
2023-04-24historical Active Under Contract
-
2023-04-17status Active
-
2023-03-10historical Active Under Contract
-
2023-03-10status Active
-
2023-02-28historical Active Under Contract
-
2023-02-23$149,900 Active
-
2021-08-12status Under Contract
-
2021-08-12status Active
-
2021-08-06historical Active Under Contract
-
2021-08-02status Active
-
2021-02-08historical
-
2021-01-21price $118,000
-
2021-01-19$120,000 Active
-
2020-12-28status Under Contract
-
2020-12-18$99,000 Active
-
2019-05-15soldstatus $80,000
-
2019-05-01status Under Contract
-
2019-03-20price $79,999
-
2019-02-15price $84,999
-
2018-12-07$89,999 Active
-
2017-04-21historical
-
2017-01-18$105,000 Active
-
2005-09-19soldstatus $94,100
-
2004-10-27soldstatus $80,000
-
2003-02-05soldstatus $76,500
-
2001-01-09soldstatus $30,660
ⓘ Source: listings_history table (triggers on properties + properties_extension) + one-shot
backfill from property_details.listing_events for pre-trigger history.
Tax reassessment forecast VA · Resets to sale price
- Current annual tax
- $2,058 · $171/mo
- Projected year-2 tax
- $2,058 · $171/mo
- Expected delta
- $0/yr ($0/mo · 0.0%)
ⓘ Screening estimate from a state-policy table — verify with the county assessor before closing.
Climate risk First Street
- Flood 1/10 Low FEMA zone X (unshaded) · 0% chance over 30 yrs
- Wildfire 1/10 Low
- Heat 9/10 Extreme 7 d/yr ≥106°F today · 16 d/yr by 30 yrs out
- Wind 8/10 Severe 80% chance of damaging wind over 30 yrs
- Air quality 5/10 Major 6 unhealthy d/yr today · 7 by 30 yrs out
Nearby sold comps map
Loading sold comps map…
Walkable amenities ~0.75 mi
Loading nearby amenities…
Taxation est. · year 1
- Rental income
- $18,738
- − Mortgage interest
- −$5,932
- − Property taxes
- −$2,058
- − Insurance
- −$530
- − Repairs & maintenance
- −$1,499
- − Management
- −$1,499
- − Depreciation
- −$3,081
- Taxable income
- $4,140
- Est. tax owed @ 24.0%
- −$994
- After-tax cash flow
- $4,558/yr
For passive investors: Depreciation is non-cash, so a rental often shows a tax loss while cash-flowing — sheltering income. Rental losses are passive: they offset passive income freely, and up to $25,000/yr can offset ordinary (W-2) income if you actively participate and your MAGI is under $100k (phasing out to $0 by $150k); unused losses carry forward. On sale, claimed depreciation is recaptured at up to 25%, and gains may owe capital-gains tax (a 1031 exchange can defer both). Figures are a year-1 estimate at your 24.0% rate — not tax advice; consult a CPA.
Schools (NCES district)
- District
- Norfolk City Public School District
- NCES district ID
- 5102670
- Math proficiency
- 27% ▼ -44.00%
- Reading proficiency
- 56% ▼ -10.00%
- Median HH income
- $44,358
- Composite
- 35.08/100
- National rank
- #5026
- State rank
- #118 of 131 in VA
Livability — Norfolk
- Score
- 83/100
- State rank
- #43
- US rank
- #1026
Category grades
Schools grade is shown separately in the Schools card above.
Census & demographics
- Census place
- Norfolk, VA
- City population
- 214,042
- Population (ZIP)
- 7,698
Population outlook (Norfolk County) Hauer SSP2
- Today (2025)
- 249,032 people
- By 2030
- 252,347 · +1.3%
- By 2040
- 253,644 · +1.9%
- By 2050
- 251,913 · +1.2%
- By 2075
- 245,281 · -1.5%
- By 2100
- 219,548 · -11.8%
Race, ethnicity, and origin ACS 2023
- Neighborhood character
- Predominantly Black (87%)
- Race & ethnicity
- Black 87% White 7% Two or more races 5% Hispanic / Latino 2%
- Common ancestry
- Romanian 1%
- Foreign-born
- 2% · Canada
- Languages at home
- 94% English-only · Spanish 3% Other Indo-European 1%
Political lean MEDSL · Norfolk
- 2024 margin
- Solid D (+41.5) · D 70.0% · R 28.5% · Other 1.6%
- 2008→2024 swing
- -1.4pp toward R · 2008: 43.0pp · 2024: 41.5pp
- All cycles
- 2024: D+41.5 2020: D+45.6 2016: D+42.0 2012: D+44.0 2008: D+43.0
Not yet ingested
- Civics
- —
Market trends
- HPI YoY
- ▼ -53.73%
- Current HPI
- 269.0309
- Rent YoY
- —
- Metro
- —
- State GDP YoY
- ▲ 2.40%
- F500 in state
- 50
Industry mix (Fortune 500 HQ in VA)
| Industry | F500 HQs | Revenue |
|---|---|---|
| Aerospace / Defense | 4 | $236B |
|
||
| Technology / Defense | 3 | $32B |
|
||
| Financial Services | 2 | $176B |
|
||
| Utilities | 2 | $27B |
|
||
| Insurance | 2 | $25B |
|
||
| Technology | 2 | $15B |
|
||
Price history
+245.4% since first listed31 events — show timeline
- 2026-01-31 Pending — REINMLS
- 2026-01-10 Listed $105,900 REINMLS
- 2023-12-04 Sold (Public Records) $182,731 Public Records
- 2023-05-11 Sold (Public Records) $169,000 Public Records
- 2023-05-02 Pending — REINMLS
- 2023-04-24 Contingent — REINMLS
- 2023-04-17 Relisted — REINMLS
- 2023-03-10 Contingent — REINMLS
- 2023-03-10 Relisted — REINMLS
- 2023-02-28 Contingent — REINMLS
- 2023-02-23 Listed $149,900 REINMLS
- 2021-08-12 Pending — REINMLS
- 2021-08-12 Relisted — REINMLS
- 2021-08-06 Contingent — REINMLS
- 2021-08-02 Relisted — REINMLS
- 2021-02-08 Listing Removed — REINMLS
- 2021-01-21 Price Changed $118,000 REINMLS
- 2021-01-19 Listed $120,000 REINMLS
- 2020-12-28 Pending — REINMLS
- 2020-12-18 Listed $99,000 REINMLS
- 2019-05-15 Sold (Public Records) $80,000 Public Records
- 2019-05-01 Pending — REINMLS
- 2019-03-20 Price Changed $79,999 REINMLS
- 2019-02-15 Price Changed $84,999 REINMLS
- 2018-12-07 Listed $89,999 REINMLS
- 2017-04-21 Listing Removed — REINMLS
- 2017-01-18 Listed $105,000 REINMLS
- 2005-09-19 Sold (Public Records) $94,100 Public Records
- 2004-10-27 Sold (Public Records) $80,000 Public Records
- 2003-02-05 Sold (Public Records) $76,500 Public Records
- 2001-01-09 Sold (Public Records) $30,660 Public Records
Property tax history
+5.2%/yrLatest (2025): $2,058 · +5.0% YoY. Source: county tax records.
Cash-flow waterfall
monthlySold comps — $/sqft
last 12 mo · ≤1 miLoading sold comps…