725 N Royal Crest Cir #231 · Paradise, NV
Flood risk 1/10 · Minimal
- FEMA flood zone
- X (unshaded)
- Chance of flooding over 30 yrs
- 0.0%
- Est. flood insurance / yr
- $507 – $1,088
Fire risk 1/10 · Minimal
- Est. fire insurance / yr
- $490 – $910
Heat risk 8/10 · Major
- Hot days now (above 106°F)
- 7 days/yr
- Hot days in 30 yrs
- 15 days/yr
Wind risk 1/10 · Minimal
- Chance of severe wind over 30 yrs
- —
Air-quality risk 3/10 · Minor
- Unhealthy air days now
- 3 days/yr
- Unhealthy air days in 30 yrs
- 4 days/yr
Risk factors via First Street. Map © Google.
Why this score? — see what drove the D grade
The composite is a weighted blend of 9 inputs, each scored 0–100. Each bar is that input's sub-score; the figure is the points it added to the 100-point composite (weight × sub-score).
- Cash flow +13.5/30.0
- 1% rule +7.7/10.0
- ARV discount +7.5/15.0
- DSCR +4.1/10.0
- Livability +3.8/5.0
- Schools +2.6/10.0
- Condition / age +2.5/5.0
- Rent growth +1.4/5.0
- Appreciation +0.0/10.0
$159,000
🖨 Deal sheet (PDF) 📄 Offer letter ✓ Due diligence
Listing remarks
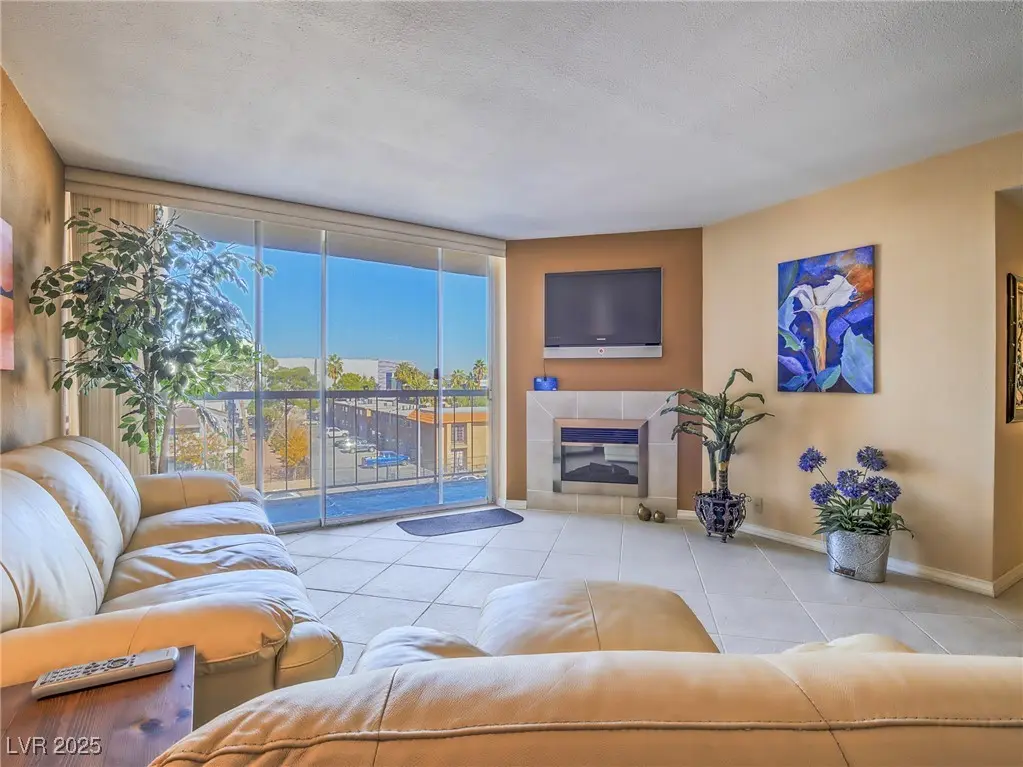
A must see hi-rise condo in the 55 plus community of Casablanca. Tile flooring throughout this spacious 2 bed/2 bath condo on the 3rd floor level. A end unit. Well appointed. Granite countertops in the galley style kitchen with full size under counter washer and dryer at the far end of kitchen. Other features include: pantry unit, terrace off the living room, gas fireplace for those cool days and nights. So many amenities with 24 hour guard gated service just off The Strip. HOA includes several utility amenities and ground maintenance, plus social activities for residents. Open living room with its wet bar and dining area. Easy access to The Strip, shopping, Harry Reid airport, and surroun
Key facts
- Pantry unit
- Gas fireplace
- Tile flooring
Tags
Property features AI
Finance
- Other: Pets not allowed
- HOA & community: Has homeowners association (Casablanca); Monthly association fee of $625; Association covers management, common areas, grounds maintenance, recreation facilities, reserve fund, taxes, and trash; Association amenities include clubhouse, fitness center, gated access, barbecue, pool, spa/hot tub, tennis courts, recreation room, and guard; Pet restrictions apply; Senior community
Exterior
- Parking: Garage; Open parking; Private and guest parking available; Total of 1 designated parking space
- Security: Gated community; 24-hour security; Community guard
- Utilities: Electricity available
- Home design: Building: CASABLANCA; Resale property; Entry level: 3
- Exterior features: Terrace; Community pool; Has view; Gated community; 24-hour security
Interior
- Kitchen: Granite countertops; Recessed lighting; Pantry; Dishwasher; Electric range; Microwave; Disposal; Refrigerator
- Bedrooms: 2 possible bedrooms; Bedroom 2 with closet
- Bathrooms: 2 full bathrooms; Bathroom with tub/shower combo
- Heating & cooling: Central electric heating; Electric cooling (one unit)
- Interior features: Ceiling fans; Window blinds and treatments; Wet bar in living area; Entry foyer
- Laundry & utility: Laundry room; Electric dryer hookup; Washer and dryer included (appliances listed include dryer)
Neighborhood map
What this means for you Summary
Snapshot
- This is a 2-bed/2.0-bath condo listed at $159k.
Deal economics
- At list price, monthly cash flow is $6 ($68/yr) — positive.
- The deal already cash-flows at list — no discount required.
- Meets the 1% rule at list price ($2k rent vs $159k).
Location & tenants
- Location reads 76/100 on livability (#10 in NV, #3,494 nationally) — a middle-class / working-renter tenant base. Strengths: commute A+, housing A-, cost of living B; Watch: employment D+, crime D-.
- Clark County School District (urban): math 21% / reading 39% proficiency, ranked #11 of 17 in NV (top 65%) — families likely to look elsewhere, expect single-tenant / working-renter base with shorter leases.
- Zoned schools: Petersen Dean Es (math 8% / reading 12%, grade F, #386 of 402 statewide, top 98%, 779 students, 100% FRL); Orr William E Ms (math 5% / reading 18%, grade F, #103 of 109 statewide, top 95%, 815 students, 100% FRL); Valley Hs (math 8% / reading 24%, grade F, #107 of 131 statewide, top 82%, 2,714 students, 100% FRL) — zoned schools average 100% FRL vs 52% district-wide (48 pts higher); higher-poverty schools than district average — tighter screening recommended.
- Zoned-school proficiency averages 12% at this address vs 30% district-wide (-18 pts) — the specific schools serving this property underperform the Clark County School District average; the district grade overstates school quality for this exact location.
- Market conditions: Rents falling (-4.4%/yr); 180 active listings in the ZIP; 40 comparable units currently listed for rent nearby; rentals lingering (median 46d on market — plan ~5-8 weeks vacancy on turnover, expect pricing pressure); 55% of comp listings sitting > 30 days — soft ceiling on asking rent; lower-income renter base — watch delinquency; 14,754 units permitted in Clark County in 2024 (2,301 in 5+ unit buildings).
- At $2,022/mo this rent would consume 59% of the median local household income ($41k/yr) (locally 2744% of renters already pay >50% of income on rent) — very limited rent-growth headroom before tenants either downsize or default.
Forward outlook
- Local home prices are declining (-3.0%/yr); year-one equity from $1k of loan paydown is wiped out by about $5k of value loss. Plan a longer hold.
- Clark County population projected at +36% by 2050 — long-run rental-demand tailwind backs the buy-and-hold thesis.
Negotiation context
- Only 6 days on market — expect competitive offers; lowballing is unlikely to land.
- 3 sale attempts with the ask held roughly flat each time — persistent listings suggest the price (not the market) is what's stuck; bring a comps-based counter.
Risks & watch-outs
- Watch-outs: HOA is 31% of rent.
- Climate carrying-cost: extreme-heat days projected 7→15/yr by 2055 (HVAC capex compounding) — expect insurance premiums to compound above CPI over the hold.
Questions for the listing agent
- Built in 1976 — when were the roof, HVAC, electrical panel, plumbing, and water heater last replaced?
- What does the HOA fee cover, when was the last increase, and are there any pending special assessments or reserve-fund shortfalls?
- Any open or pending special assessments — roof, HVAC, plumbing, elevator, façade? What's the per-unit balance and payoff schedule, and is the seller paying it off at close or rolling it to the buyer?
- Is there a deadline driving the sale (1031 exchange, divorce, estate, relocation)? That informs how much negotiation room exists.
- Schools are F-rated, which usually means shorter tenancies and higher turnover. Who's the typical renter profile here, and what's been the actual vacancy rate?
- Crime grade is D in this area — have there been break-ins, vandalism, or insurance claims at this property in the last 3 years? What carrier currently insures it and at what premium?
- The area grade is low — what's the realistic commute time and amenity access for the typical tenant pool here? Any planned neighborhood developments (good or bad) we should know about?
- What's the average days-on-market for RENTAL listings here right now (not sales)? A rising rental-DOM trend means longer vacancies and softer asking-rent achievability than the comps imply.
- What's the recent tenant-quality profile in this submarket — average credit score on applications, eviction rate, late-payment / NSF rate, and stable-employment percentage? A property-management company in the area should have these aggregated.
- How much new apartment / multifamily construction is in the pipeline within 1–3 miles? Heavy new supply (>2% of stock underway) typically softens rents 12–24 months out; light construction supports rent growth.
Investment metrics
- 1% rule
- 1.27% ✓
- Cap rate
- 6.34%
- Cash-on-cash
- 0.15%
- DSCR
- 1.01
- GRM
- 6.6
CMA / ARV
No comps found within radius.
Projected returns pro-forma
-3.0% appreciation · 0.0% rent growth · sell at horizon
- IRR
- -20.8%
- Equity multiple
- 0.30×
- Total profit
- $-30,994
- Equity at exit
- $23,707
- IRR
- -29.6%
- Equity multiple
- -0.08×
- Total profit
- $-48,066
- Equity at exit
- $13,747
Cash invested: $44,520 (down + closing). Projections, not guarantees.
Landlord ↔ Tenant lean methodology
- Overall (STATE)
- 71 Landlord-Friendly
- State Nevada
- 71 Landlord-Friendly · R+1
- County
- — inherits STATE
- City
- — inherits STATE
ZIP-level market 89169
- Home prices YoY
- -33.4%
- Rents YoY
- -4.4%
- Active inventory
- 180
- Price-to-rent
- 6.6×
Monthly cashflow live
- Estimated rent
- $2,022 high interval (Pro) →
- Mortgage (P&I)
- −$834
- Tax from tax record
- −$66 /mo · $796/yr
- Insurance
- −$66
- HOA
- −$625
- Vacancy / Maint / Mgmt
- −$425
- Net cashflow
- $6
Break-even live
Sensitivity live
| Price | -10% $96 | -5% $51 | +0% $6 | +5% $-39 | +10% $-84 |
|---|---|---|---|---|---|
| Rent | -10% $-154 | -5% $-74 | +0% $6 | +5% $86 | +10% $165 |
| Rate | -1.0pp $86 | -0.5pp $46 | base $6 | +0.5pp $-36 | +1.0pp $-77 |
UW: 25.0% down · 7.5% · 30yr · 1.5% tax · 5.0% vac · 8.0% maint · 8.0% mgmt
Financing live
Cash to close
- Down payment
- $39,750
- Closing costs
- $4,770
- Reserves months
- —
- Total cash needed
- —
Loan-product check · same deal, 3 products live
Conventional
25% down · 7.5% · 30yr
- Down + closing
- —
- Monthly P&I
- —
- Monthly cashflow
- —
- DSCR
- —
- Eligible?
- —
Personal DTI + credit; lowest rate.
DSCR
20% down · 8.5% · 30yr
- Down + closing
- —
- Monthly P&I
- —
- Monthly cashflow
- —
- DSCR
- —
- Eligible?
- —
No personal income docs; deal must DSCR.
Hard money
10% down · 12.0% · 12mo
- Down + closing
- —
- Monthly P&I
- —
- Monthly cashflow
- —
- DSCR
- —
- Eligible?
- —
Short-term bridge; refi at stabilization.
Rent comps 40 comps
| Address | Beds | Baths | Sqft | Rent | $/sqft | DOM | Units | Dist |
|---|---|---|---|---|---|---|---|---|
| 544 Oakbrook Ln Las Vegas, NV | 2.0 | 1.5 | 1146 | $1,950 | $1.70 | 46d | 1 | 0.13mi |
| 595 S Royal Crest Cir #18 Las Vegas, NV | 2.0 | 1.0 | 816 | $1,575 | $1.93 | 46d | 1 | 0.17mi |
| 3550 Paradise Rd Las Vegas, NV | 3.0 | 1.0–2.0 | 947 | $1,425 | $1.50 | 46d | 20 | 0.22mi |
| 900 E Desert Inn Rd Las Vegas, NV | 1.0–2.0 | 1.0–2.0 | 1077 | $1,800 | $1.67 | 46d | 5 | 0.46mi |
| 3930 Paradise Rd Las Vegas, NV | 3.0 | 1.0–2.0 | 999 | $2,800 | $2.80 | 0d | 90 | 0.47mi |
| 3776 Howard Hughes Pkwy Las Vegas, NV | 3.0 | 1.0–2.5 | 1548 | $3,009 | $1.94 | 0d | 9 | 0.49mi |
| 3930 University Center Dr Las Vegas, NV | 2.0 | 2.0–3.0 | 1200 | $1,725 | $1.44 | 46d | 2 | 0.56mi |
| 3159 Bel Air Dr Las Vegas, NV | 2.0 | 2.0 | 1305 | $2,750 | $2.11 | 24d | 1 | 0.62mi |
| 3145 Bel Air Dr Las Vegas, NV | 2.0 | 2.0 | 1305 | $2,495 | $1.91 | 24d | 1 | 0.64mi |
| 818 E Flamingo Rd Las Vegas, NV | 1.0–2.0 | 1.0–2.5 | 1158 | $2,895 | $2.50 | 0d | 33 | 0.65mi |
| 350 E Desert Inn Rd Unit H203 Las Vegas, NV | 2.0 | 1.5 | 849 | $1,725 | $2.03 | 46d | 1 | 0.75mi |
| 2999 Bel Air Dr Las Vegas, NV | 2.0 | 2.0 | 1326 | $2,700 | $2.04 | 24d | 1 | 0.86mi |
| 2831 Geary Pl #2909 Las Vegas, NV | 2.0 | 1.0 | 1112 | $1,899 | $1.71 | 46d | 1 | 0.86mi |
| 1061 E Flamingo Rd Las Vegas, NV | 1.0–2.0 | 1.0–2.0 | 967 | $2,203 | $2.28 | 17d | 35 | 0.91mi |
| 260 E Flamingo Rd Las Vegas, NV | 2.0 | 2.0 | 1018 | $2,372 | $2.33 | 26d | 2 | 0.93mi |
| 260 E Flamingo Rd Las Vegas, NV | 1.0–2.0 | 1.0–2.0 | 881 | $2,295 | $2.60 | 46d | 4 | 0.93mi |
| 260 E Flamingo Rd Las Vegas, NV | 2.0 | 2.0 | 1018 | $2,475 | $2.43 | 5d | 1 | 0.93mi |
| 230 E Flamingo Rd #335 Las Vegas, NV | 1.0 | 1.0 | 727 | $1,600 | $2.20 | 46d | 1 | 0.94mi |
| 270 E Flamingo Rd Las Vegas, NV | 1.0–2.0 | 1.0–2.0 | 877 | $2,100 | $2.39 | 46d | 7 | 0.95mi |
| 210 E Flamingo Rd Las Vegas, NV | 1.0–2.0 | 1.0–2.0 | 833 | $2,100 | $2.52 | 46d | 6 | 0.98mi |
| 2777 Paradise Rd #708 Las Vegas, NV | 1.0 | 1.5 | 1179 | $2,400 | $2.04 | 10d | 1 | 0.99mi |
| 220 E Flamingo Rd Las Vegas, NV | 1.0–2.0 | 1.0–2.0 | 863 | $2,195 | $2.54 | 46d | 7 | 1.02mi |
| 596 Tam O Shanter Las Vegas, NV | 2.0 | 2.0 | 1350 | $1,750 | $1.30 | 46d | 1 | 1.03mi |
| 1601 E Katie Ave Las Vegas, NV | 1.0–2.0 | 1.0–2.0 | 809 | $1,852 | $2.29 | 46d | 13 | 1.04mi |
| 322 Karen Ave Las Vegas, NV | 1.0–2.0 | 1.5–2.0 | 1109 | $3,500 | $3.15 | 0d | 4 | 1.11mi |
| 322 Karen Ave Las Vegas, NV | 1.0–2.0 | 1.0–2.0 | 1109 | $3,500 | $3.15 | 6d | 3 | 1.11mi |
| 1700 E Viking Rd Las Vegas, NV | 2.0 | 2.0 | 1085 | $1,662 | $1.53 | 46d | 3 | 1.13mi |
| 222 Karen Ave #306 Las Vegas, NV | 1.0 | 2.0 | 814 | $2,300 | $2.83 | 46d | 1 | 1.13mi |
| 222 Karen Ave #3203 Las Vegas, NV | 1.0 | 2.0 | 814 | $2,500 | $3.07 | 46d | 1 | 1.13mi |
| 222 Karen Ave #4101 Las Vegas, NV | 2.0 | 2.0 | 1399 | $4,000 | $2.86 | 4d | 1 | 1.13mi |
| 222 Karen Ave #1004 Las Vegas, NV | 1.0 | 1.5 | 814 | $2,300 | $2.83 | 26d | 1 | 1.13mi |
| 222 Karen Ave #3005 Las Vegas, NV | 1.0 | 1.5 | 814 | $2,400 | $2.95 | 26d | 1 | 1.13mi |
| 222 Karen Ave #2904 Las Vegas, NV | 1.0 | 1.5 | 814 | $2,200 | $2.70 | 4d | 1 | 1.13mi |
| 222 Karen Ave #1105 Las Vegas, NV | 1.0 | 1.5 | 814 | $1,990 | $2.44 | 46d | 1 | 1.13mi |
| 1100 Tam O Shanter Las Vegas, NV | 2.0 | 2.0 | 1400 | $2,100 | $1.50 | 46d | 1 | 1.19mi |
| 2700 Las Vegas Blvd S Las Vegas, NV | 1.0–2.0 | 1.0–2.5 | 1226 | $2,950 | $2.41 | 20d | 4 | 1.22mi |
| 2700 Las Vegas Blvd S Las Vegas, NV | 2.0 | 2.0–2.5 | 1283 | $2,792 | $2.18 | 14d | 4 | 1.22mi |
| 511 E Sahara Ave Las Vegas, NV | 1.0–2.0 | 1.0 | 900 | $1,600 | $1.78 | 46d | 3 | 1.27mi |
| 205 E Harmon Ave Las Vegas, NV | 1.0–2.0 | 1.5–2.0 | 1182 | $1,950 | $1.65 | 46d | 5 | 1.42mi |
| 200 W Sahara Ave #1705 Las Vegas, NV | 2.0 | 2.0 | 1233 | $2,450 | $1.99 | 46d | 1 | 1.45mi |
HOA detail condo
- Monthly dues
- $625 · $7,500/yr
- Likely covers
- gassecurity
- Assessments
- None detected in remarks — confirm with the listing agent.
Listing history 16 events
-
2026-06-21days on market $159,000 Active 6 DOM
-
2026-06-18days on market $159,000 Active 3 DOM
-
2026-06-17days on market $159,000 Active 2 DOM
-
2026-06-16days on market $159,000 Active 1 DOM
-
2026-06-15days on market $159,000 Active 5 DOM
-
2026-06-13pricedays on market $159,000 Active 3 DOM
-
2026-06-09days on market $169,000 Active 179 DOM
-
2026-06-08days on market $169,000 Active 178 DOM
-
2026-06-08days on market $169,000 Active 177 DOM
-
2026-06-03days on market $169,000 Active 173 DOM
-
2026-06-02days on market $169,000 Active 172 DOM
-
2026-06-01days on market $169,000 Active 171 DOM
-
2026-05-31days on market $169,000 Active 170 DOM
-
2026-03-21price $169,000 730-char remark
-
2025-12-12$179,000 Active 730-char remark
-
2000-08-04soldstatus $400,000
ⓘ Source: listings_history table (triggers on properties + properties_extension) + one-shot
backfill from property_details.listing_events for pre-trigger history.
Tax reassessment forecast NV · Resets to sale price
- Current annual tax
- $796 · $66/mo
- Projected year-2 tax
- $938 · $78/mo
- Expected delta
- +$142/yr (+$12/mo · 17.8%)
ⓘ Screening estimate from a state-policy table — verify with the county assessor before closing.
Climate risk First Street
- Flood 1/10 Low FEMA zone X (unshaded) · 0% chance over 30 yrs
- Wildfire 1/10 Low
- Heat 8/10 Severe 7 d/yr ≥106°F today · 15 d/yr by 30 yrs out
- Wind 1/10 Low
- Air quality 3/10 Moderate 3 unhealthy d/yr today · 4 by 30 yrs out
Nearby sold comps map
Loading sold comps map…
Walkable amenities ~0.75 mi
Loading nearby amenities…
Taxation est. · year 1
- Rental income
- $24,260
- − Mortgage interest
- −$8,906
- − Property taxes
- −$796
- − Insurance
- −$795
- − Repairs & maintenance
- −$1,941
- − Management
- −$1,941
- − HOA
- −$7,500
- − Depreciation
- −$4,625
- Taxable loss
- −$2,245
- Est. tax savings @ 24.0%
- +$539
- After-tax cash flow
- $607/yr
For passive investors: Depreciation is non-cash, so a rental often shows a tax loss while cash-flowing — sheltering income. Rental losses are passive: they offset passive income freely, and up to $25,000/yr can offset ordinary (W-2) income if you actively participate and your MAGI is under $100k (phasing out to $0 by $150k); unused losses carry forward. On sale, claimed depreciation is recaptured at up to 25%, and gains may owe capital-gains tax (a 1031 exchange can defer both). Figures are a year-1 estimate at your 24.0% rate — not tax advice; consult a CPA.
Schools (NCES district)
- District
- Clark County School District
- NCES district ID
- 3200060
- Math proficiency
- 21% ▼ -13.00%
- Reading proficiency
- 39% ▼ -8.00%
- Median HH income
- $53,611
- Composite
- 26.48/100
- National rank
- #7211
- State rank
- #11 of 17 in NV
Livability — Paradise
- Score
- 76/100
- State rank
- #10
- US rank
- #3494
Category grades
Schools grade is shown separately in the Schools card above.
Census & demographics
- Census place
- Paradise, NV
- County
- Clark County · 2,306,105 people
- City population
- 227,885
- Metro
- Las Vegas-Henderson-Paradise, NV
- Population (ZIP)
- 22,171
- Household income
- $40,904
- Rent vs Own
- Severe rent burden
- 2744.0
Population outlook (Clark County) Hauer SSP2
- Today (2025)
- 2,504,101 people
- By 2030
- 2,693,770 · +7.6%
- By 2040
- 3,061,208 · +22.2%
- By 2050
- 3,400,072 · +35.8%
- By 2075
- 4,139,522 · +65.3%
- By 2100
- 4,596,916 · +83.6%
Race, ethnicity, and origin ACS 2023
- Neighborhood character
- Highly diverse neighborhood (Simpson 0.74)
- Race & ethnicity
- Hispanic / Latino 33% White 30% Black 23% Two or more races 13% Asian 9% Native American 2%
- Hispanic origin (detail)
- Mexican 21% Cuban 5%
- Common ancestry
- Iranian 1% Italian 1% Slovak 1%
- Foreign-born
- 30% · Canada, China
- Languages at home
- 59% English-only · Spanish 27% Tagalog/Filipino 4% Other Asian/Pacific 3%
Political lean MEDSL · Clark
- 2024 margin
- Toss-up / Even · D 50.4% · R 47.8% · Other 1.7%
- 2008→2024 swing
- -16.5pp toward R · 2008: 19.1pp · 2024: 2.6pp
- All cycles
- 2024: D+2.6 2020: D+9.3 2016: D+10.7 2012: D+14.5 2008: D+19.1
Not yet ingested
- Civics
- —
Market trends
- HPI YoY
- ▼ -136.91%
- Current HPI
- 272.6449
- Rent YoY
- ▼ -4.43%
- Metro
- Las Vegas-Henderson-Paradise, NV
- State GDP YoY
- ▲ 3.08%
- F500 in state
- 6
Industry mix (Fortune 500 HQ in NV)
| Industry | F500 HQs | Revenue |
|---|---|---|
| Hotels / Casinos | 3 | $36B |
|
||
Price history
-60.2% since first listed7 events — show timeline
- 2026-06-15 Listing Removed — GLVAR
- 2026-06-10 Listed $159,000 GLVAR
- 2026-06-10 Listed $159,000 GLVAR
- 2026-06-09 Listing Removed — GLVAR
- 2026-03-21 Price Changed $169,000 GLVAR
- 2025-12-12 Listed $179,000 GLVAR
- 2000-08-04 Sold (Public Records) $400,000 Public Records
Property tax history
+0.2%/yrLatest (2025): $796 · +7.6% YoY. Source: county tax records.
Cash-flow waterfall
monthlySold comps — $/sqft
last 12 mo · ≤1 miLoading sold comps…