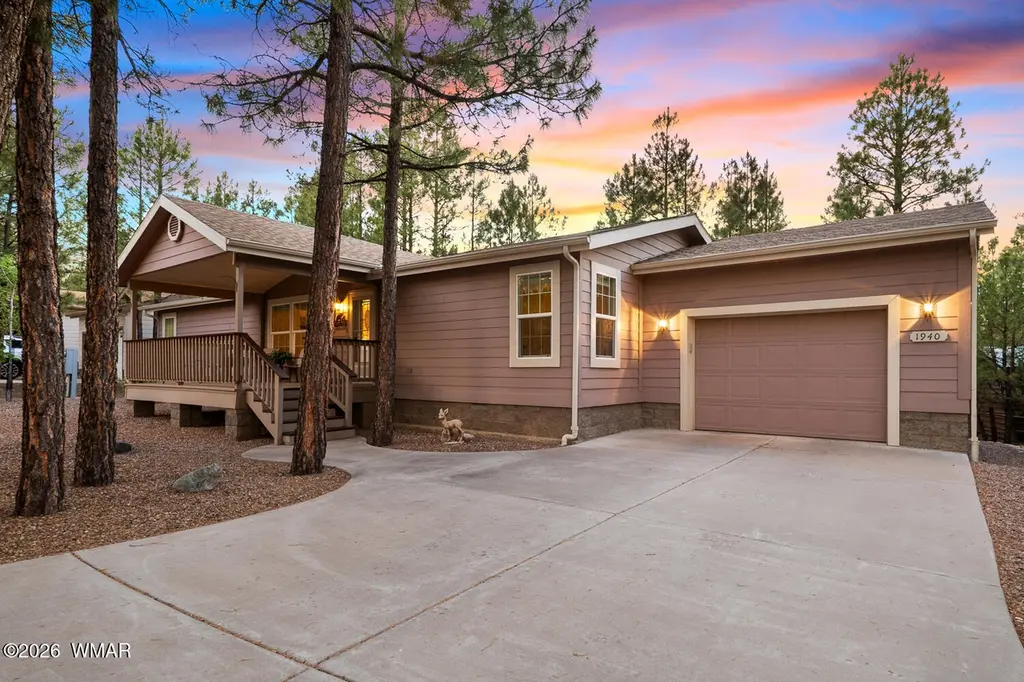
1940 Pineview Dr · Show Low, AZ
Flood risk 1/10 · Minimal
- FEMA flood zone
- X (unshaded)
- Chance of flooding over 30 yrs
- 0.0%
- Est. flood insurance / yr
- $507 – $1,088
Fire risk 6/10 · Moderate
- Est. fire insurance / yr
- $610 – $1,132
Heat risk 2/10 · Minimal
- Hot days now (above 89°F)
- 7 days/yr
- Hot days in 30 yrs
- 18 days/yr
Wind risk 1/10 · Minimal
- Chance of severe wind over 30 yrs
- —
Air-quality risk 1/10 · Minimal
- Unhealthy air days now
- 0 days/yr
- Unhealthy air days in 30 yrs
- 0 days/yr
Risk factors via First Street. Map © Google.
Why this score? — see what drove the F grade
The composite is a weighted blend of 9 inputs, each scored 0–100. Each bar is that input's sub-score; the figure is the points it added to the 100-point composite (weight × sub-score).
- Cash flow +14.3/30.0
- DSCR +4.3/10.0
- Livability +3.2/5.0
- Schools +3.0/10.0
- 1% rule +2.9/10.0
- Rent growth +2.5/5.0
- Condition / age +2.5/5.0
- ARV discount +0.0/15.0
- Appreciation +0.0/10.0
$424,700
🖨 Deal sheet 📄 Offer letter ✓ Due diligence
Listing remarks
Meticulously maintained and PARTIALLY FURNISHED move-in ready, this beautiful 3-bedroom, 2-bath home is located in the highly sought-after Hacienda Pines, a gated 55+ community in the heart of Show Low, Arizona, offering low HOA fees and convenient access to shopping, dining, medical facilities, and all city services, including high-speed internet. Enjoy the beautiful White Mountains from the covered front and back decks, including an expanded rear deck with a screened-in section--perfect for relaxing or entertaining year-round. The low-maintenance front and back landscaping features an efficient drip irrigation system for easy upkeep. Inside, you'll find vaulted ceilings, tape-and-textured
Key facts
- Gated community
- Screened-in section
- Low hoa fees
Tags
Property features AI
Finance
- Other: Private maintained road access; Directions available through Hacienda Pines gated entrance
- HOA & community: Mandatory HOA; HOA dues $65 per month; 55+ community; Subdivision: Hacienda Pines
Exterior
- Parking: Attached garage with garage door opener (1 car)
- Security: Gated community
- Utilities: City of Show Low water; Public sewer; Cable TV available; Individual electric meter; Navopache service available; Telephone service available; Water available; Sewer available; Power available
- Home design: Manufactured / Mobile home; Double wide; One level
- Construction: Manufactured construction; Pitched shingle roof; Other foundation type
- Exterior features: Drip irrigation system; Gated community; Private property adjacency; In the trees / tall pines on lot; Landscaped; Paved street; Chain link fence; Covered deck and rear porch; Double pane windows
Interior
- Kitchen: Built-in dishwasher; Disposal; Electric range; Microwave; Pantry; Refrigerator
- Bedrooms: Master bedroom downstairs
- Flooring: Laminate
- Bathrooms: Full bath with double vanity and shower
- Heating & cooling: Central A/C; Electric heating; Forced air; Pellet heating; Electric water heater
- Interior features: Master bedroom located downstairs; Smoke detector; Vaulted ceiling; Pellet stove fireplace; Partially furnished; Laminate flooring
- Laundry & utility: Washer and dryer in utility room
Neighborhood map
What this means for you Summary
Snapshot
- This is a 3-bed/2.0-bath manufactured listed at $425k.
Deal economics
- At list price, monthly cash flow is $75 ($896/yr) — positive.
- The deal already cash-flows at list — no discount required.
- To meet the 1% rule (rent ≥ 1% of price), the offer needs to be $335k (21.2% below list).
- Recommended offer: $335k (21.2% below list) — sets the bar for 1% rule.
- Cap rate 6.5% vs local median 3.3% in Show Low — top-decile yield for the area; either an underpriced asset or a hidden risk that comps aren't pricing in. Stress-test before assuming the spread holds.
Location & tenants
- Location reads 65/100 on livability (#90 in AZ) — a middle-class / working-renter tenant base. Strengths: cost of living A+, housing A+; Watch: employment D, crime F, amenities F.
- Show Low Unified District (4393) (rural): math 32% / reading 39% proficiency, ranked #89 of 249 in AZ (top 36%) — families likely to look elsewhere, expect single-tenant / working-renter base with shorter leases.
- Market conditions: 891 active listings in the ZIP; 4 comparable units currently listed for rent nearby; rentals leasing fast (median 14d on market — plan ~1-2 weeks tenant-placement turnaround); 485 units permitted in Navajo County in 2024 (11 in 5+ unit buildings).
Forward outlook
- Local home prices are declining (-3.0%/yr); year-one equity from $3k of loan paydown is wiped out by about $13k of value loss. Plan a longer hold.
- Navajo County population projected at -16% by 2050 — secular population decline; favor cash flow + early exit over multi-decade hold.
Negotiation context
- Only 14 days on market — expect competitive offers; lowballing is unlikely to land.
- 2 sale attempts with the ask held roughly flat each time — persistent listings suggest the price (not the market) is what's stuck; bring a comps-based counter.
- Current owner paid $130k; list at $425k implies a 227% gain — meaningful room to come down on a strong offer.
Risks & watch-outs
- Climate carrying-cost: major wildfire risk — expect insurance premiums to compound above CPI over the hold.
Questions for the listing agent
- What does the HOA fee cover, when was the last increase, and are there any pending special assessments or reserve-fund shortfalls?
- Is there a deadline driving the sale (1031 exchange, divorce, estate, relocation)? That informs how much negotiation room exists.
- Schools are B-rated — typically a magnet for longer-tenancy family renters. What's the average tenant stay here, and is there a school-zone premium baked into asking?
- Crime grade is F in this area — have there been break-ins, vandalism, or insurance claims at this property in the last 3 years? What carrier currently insures it and at what premium?
- The area grade is low — what's the realistic commute time and amenity access for the typical tenant pool here? Any planned neighborhood developments (good or bad) we should know about?
- What's the average days-on-market for RENTAL listings here right now (not sales)? A rising rental-DOM trend means longer vacancies and softer asking-rent achievability than the comps imply.
- What's the recent tenant-quality profile in this submarket — average credit score on applications, eviction rate, late-payment / NSF rate, and stable-employment percentage? A property-management company in the area should have these aggregated.
- How much new for-sale + rental construction is in the pipeline within 1–3 miles? Heavy new supply typically softens prices + rents 12–24 months out; constrained supply supports both.
Investment metrics
- 1% rule
- 0.79% ✗
- Cap rate
- 6.50%
- Cash-on-cash
- 0.75%
- DSCR
- 1.03
- GRM
- 10.6
CMA / ARV
- ARV (on-the-fly)
- $349,920
- Comps found
- 12
Show comp detail 12 sales within ~0.75 mi
| Address | Dist | Beds/Ba | Sqft | Sold | Price | $/sf | Match |
|---|---|---|---|---|---|---|---|
| 1061 S Hacienda Pines Dr | 0.12mi | 2/2.0 (-1) | 1,500 (+3%) | 9mo | $395,000 | $263 | 77 |
| 2380 W Zuni Ct | 0.27mi | 3/2.0 | 1,482 (+2%) | 13mo | $369,750 | $249 | 74 |
| 2899 W Whipple St | 0.53mi | 2/2.0 (-1) | 1,440 (-1%) | 0mo | $155,000 | $108 | 68 |
| 1241 S Deer Ln | 0.11mi | 3/2.0 | 1,664 (+14%) | 9mo | $430,000 | $258 | 64 |
| 2455 W Whipple | 0.33mi | 4/2.0 (+1) | 1,560 (+7%) | 7mo | $374,900 | $240 | 63 |
| 640 S 27th Ave | 0.49mi | 3/2.0 | 1,345 (-8%) | 4mo | $273,000 | $203 | 61 |
| 2120 W Stratton | 0.20mi | 3/2.0 | 1,279 (-12%) | 11mo | $250,000 | $195 | 61 |
| 1161 S Cherokee Dr | 0.18mi | 2/2.0 (-1) | 1,248 (-14%) | 9mo | $324,900 | $260 | 55 |
| 3030 W Young -- | 0.64mi | 3/2.0 | 1,345 (-8%) | 4mo | $325,000 | $242 | 54 |
| 2820 W Reidhead | 0.61mi | 3/2.0 | 1,350 (-7%) | 10mo | $320,000 | $237 | 51 |
| 3051 W Young | 0.66mi | 2/2.0 (-1) | 1,344 (-8%) | 9mo | $295,900 | $220 | 43 |
| 3198 W Young -- | 0.74mi | 3/2.0 | 1,620 (+11%) | 8mo | $325,000 | $201 | 40 |
Match score weights: distance 35% · size 25% · config 20% · recency 20%. Top-matched comps best support the ARV.
Projected returns pro-forma
-3.0% appreciation · 3.0% rent growth · sell at horizon
- IRR
- -15.2%
- Equity multiple
- 0.46×
- Total profit
- $-64,239
- Equity at exit
- $63,324
- IRR
- -6.7%
- Equity multiple
- 0.58×
- Total profit
- $-50,524
- Equity at exit
- $36,720
Cash invested: $118,916 (down + closing). Projections, not guarantees.
Landlord ↔ Tenant lean methodology
- Overall (STATE)
- 87 Strongly Landlord-Friendly
- State Arizona
- 87 Strongly Landlord-Friendly · R+3
- County
- — inherits STATE
- City
- — inherits STATE
ZIP-level market 85901
- Home prices YoY
- -14.5%
- Active inventory
- 891
- Price-to-rent
- 10.6×
Monthly cashflow live
- Estimated rent
- $3,347 medium interval (Pro) →
- Mortgage (P&I)
- −$2,227
- Tax from tax record
- −$100 /mo · $1,204/yr
- Insurance
- −$177
- HOA
- −$65
- Vacancy / Maint / Mgmt
- −$703
- Net cashflow
- $75
Break-even live
UW: 25.0% down · 7.5% · 30yr · 1.5% tax · 5.0% vac · 8.0% maint · 8.0% mgmt
Financing live
Cash to close
- Down payment
- $106,175
- Closing costs
- $12,741
- Reserves months
- —
- Total cash needed
- —
Loan-product check · same deal, 3 products live
Conventional
25% down · 7.5% · 30yr
- Down + closing
- —
- Monthly P&I
- —
- Monthly cashflow
- —
- DSCR
- —
- Eligible?
- —
Personal DTI + credit; lowest rate.
DSCR
20% down · 8.5% · 30yr
- Down + closing
- —
- Monthly P&I
- —
- Monthly cashflow
- —
- DSCR
- —
- Eligible?
- —
No personal income docs; deal must DSCR.
Hard money
10% down · 12.0% · 12mo
- Down + closing
- —
- Monthly P&I
- —
- Monthly cashflow
- —
- DSCR
- —
- Eligible?
- —
Short-term bridge; refi at stabilization.
Rent comps 4 comps
| Address | Beds | Baths | Sqft | Rent | $/sqft | DOM | Units | Dist |
|---|---|---|---|---|---|---|---|---|
| 311 S 16th Ave Unit 1545774P Show Low, AZ | 3.0 | 2.0 | 1797 | $4,355 | $2.42 | 13d | 1 | 0.51mi |
| 2850 W Villa Loop Unit 1 Show Low, AZ | 3.0 | 2.0 | 1625 | $2,700 | $1.66 | 13d | 1 | 1.29mi |
| 2890 W Villa Loop Unit 1 Show Low, AZ | 3.0 | 2.0 | 1652 | $2,700 | $1.63 | 43d | 1 | 1.30mi |
| 341 N 4th Ave Show Low, AZ | 4.0 | 2.0 | 1792 | $2,195 | $1.22 | 13d | 1 | 1.33mi |
HOA detail
- Monthly dues
- $65 · $780/yr
- Likely covers
- internetlandscapingsecurity
Listing history 12 events
-
2026-06-19days on market $424,700 Active 14 DOM
-
2026-06-18days on market $424,700 Active 13 DOM
-
2026-06-17days on market $424,700 Active 12 DOM
-
2026-06-16days on market $424,700 Active 11 DOM
-
2026-06-15days on market $424,700 Active 10 DOM
-
2026-06-14days on market $424,700 Active 8 DOM
-
2026-06-12days on market $424,700 Active 7 DOM
-
2026-06-09days on market $424,700 Active 4 DOM
-
2026-06-08days on market $424,700 Active 3 DOM
-
2026-06-07days on market $424,700 Active 2 DOM
-
2026-06-07remarks 699-char remark
-
2026-06-07$424,700 Active 1 DOM
ⓘ Source: listings_history table (triggers on properties + properties_extension) + one-shot
backfill from property_details.listing_events for pre-trigger history.
Tax reassessment forecast AZ · Resets to sale price
- Current annual tax
- $1,204 · $100/mo
- Projected year-2 tax
- $2,803 · $234/mo
- Expected delta
- +$1,599/yr (+$133/mo · 132.8%)
ⓘ Screening estimate from a state-policy table — verify with the county assessor before closing.
Climate risk First Street
- Flood 1/10 Low FEMA zone X (unshaded) · 0% chance over 30 yrs
- Wildfire 6/10 Major
- Heat 2/10 Low 7 d/yr ≥89°F today · 18 d/yr by 30 yrs out
- Wind 1/10 Low
- Air quality 1/10 Low 0 unhealthy d/yr today · 0 by 30 yrs out
Nearby sold comps map
Loading sold comps map…
Walkable amenities ~0.75 mi
Loading nearby amenities…
Taxation est. · year 1
- Rental income
- $40,164
- − Mortgage interest
- −$23,790
- − Property taxes
- −$1,204
- − Insurance
- −$2,124
- − Repairs & maintenance
- −$3,213
- − Management
- −$3,213
- − HOA
- −$780
- − Depreciation
- −$12,355
- Taxable loss
- −$6,515
- Est. tax savings @ 24.0%
- +$1,564
- After-tax cash flow
- $2,459/yr
For passive investors: Depreciation is non-cash, so a rental often shows a tax loss while cash-flowing — sheltering income. Rental losses are passive: they offset passive income freely, and up to $25,000/yr can offset ordinary (W-2) income if you actively participate and your MAGI is under $100k (phasing out to $0 by $150k); unused losses carry forward. On sale, claimed depreciation is recaptured at up to 25%, and gains may owe capital-gains tax (a 1031 exchange can defer both). Figures are a year-1 estimate at your 24.0% rate — not tax advice; consult a CPA.
Schools (NCES district)
- District
- Show Low Unified District (4393)
- NCES district ID
- 0407700
- Math proficiency
- 32% ▼ -9.00%
- Reading proficiency
- 39% ▼ -4.00%
- Median HH income
- $41,240
- Composite
- 29.9/100
- National rank
- #6387
- State rank
- #89 of 249 in AZ
Livability — Show Low
- Score
- 65/100
- State rank
- #90
- US rank
- #13573
Category grades
Schools grade is shown separately in the Schools card above.
Census & demographics
- Census place
- Show Low, AZ
- City population
- 18,821
- Population (ZIP)
- 18,821
Population outlook (Navajo County) Hauer SSP2
- Today (2025)
- 105,760 people
- By 2030
- 103,301 · -2.3%
- By 2040
- 97,070 · -8.2%
- By 2050
- 88,850 · -16.0%
- By 2075
- 65,180 · -38.4%
- By 2100
- 37,281 · -64.7%
Race, ethnicity, and origin ACS 2023
- Neighborhood character
- Predominantly White (77%)
- Race & ethnicity
- White 77% Hispanic / Latino 16% Two or more races 11% Native American 2%
- Hispanic origin (detail)
- Mexican 12%
- Common ancestry
- Slovak 2% Lithuanian 2% Italian 2%
- Foreign-born
- 4% · Canada
- Languages at home
- 92% English-only · Spanish 7% Tagalog/Filipino 1%
Political lean MEDSL · Navajo
- 2024 margin
- R (+17.2) · D 40.9% · R 58.1%
- 2008→2024 swing
- -5.5pp toward R · 2008: -11.7pp · 2024: -17.2pp
- All cycles
- 2024: R+17.2 2020: R+8.2 2016: R+7.9 2012: R+8.4 2008: R+11.7
Not yet ingested
- Civics
- —
Market trends
- HPI YoY
- ▼ -65.52%
- Current HPI
- 386.3007
- Rent YoY
- —
- Metro
- —
- State GDP YoY
- ▲ 4.54%
- F500 in state
- 20
Industry mix (Fortune 500 HQ in AZ)
| Industry | F500 HQs | Revenue |
|---|---|---|
| Technology | 2 | $13B |
|
||
| Mining / Metals | 1 | $23B |
|
||
| Environmental Services | 1 | $16B |
|
||
| Metals / Steel | 1 | $14B |
|
||
| Technology Distribution | 1 | $9B |
|
||
| Homebuilding | 1 | $8B |
|
||
Price history
+226.7% since first listed3 events — show timeline
- 2026-06-05 Listed $424,700 WMMLS
- 2026-06-05 Listed $424,700 ARMLS
- 2013-03-13 Sold (Public Records) $130,000 Public Records
Property tax history
+0.9%/yrLatest (2025): $1,204 · +4.3% YoY. Source: county tax records.
Cash-flow waterfall
monthlySold comps — $/sqft
last 12 mo · ≤1 miLoading sold comps…