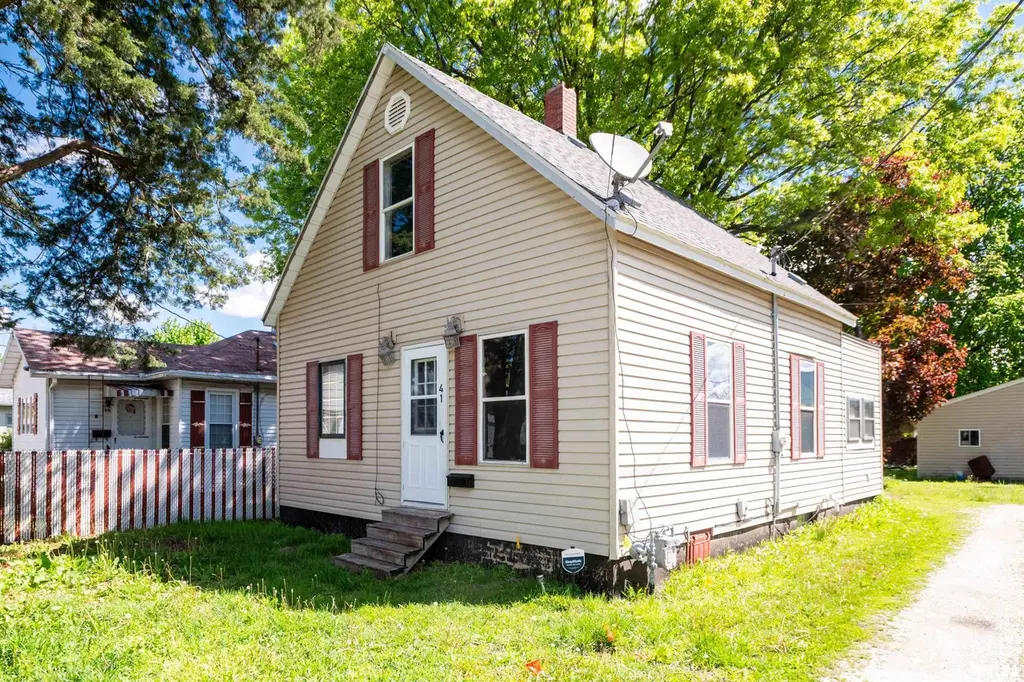
41 N 6th Ave · Canton, IL
Flood risk 1/10 · Minimal
- FEMA flood zone
- X (unshaded)
- Chance of flooding over 30 yrs
- 0.0%
- Est. flood insurance / yr
- $473 – $860
Fire risk 1/10 · Minimal
- Est. fire insurance / yr
- $804 – $1,492
Heat risk 3/10 · Minor
- Hot days now (above 105°F)
- 7 days/yr
- Hot days in 30 yrs
- 18 days/yr
Wind risk 2/10 · Minimal
- Chance of severe wind over 30 yrs
- 0.0%
Air-quality risk 2/10 · Minimal
- Unhealthy air days now
- 1 days/yr
- Unhealthy air days in 30 yrs
- 2 days/yr
Risk factors via First Street. Map © Google.
Why this score? — see what drove the B+ grade
The composite is a weighted blend of 9 inputs, each scored 0–100. Each bar is that input's sub-score; the figure is the points it added to the 100-point composite (weight × sub-score).
- Cash flow +30.0/30.0
- ARV discount +15.0/15.0
- 1% rule +10.0/10.0
- DSCR +10.0/10.0
- Livability +3.6/5.0
- Rent growth +2.5/5.0
- Condition / age +2.5/5.0
- Schools +1.8/10.0
- Appreciation +0.0/10.0
$60,000
🖨 Deal sheet 📄 Offer letter ✓ Due diligence
Listing remarks
Welcome to 41 N 6th Ave in Canton IL! Great location, close to shopping and restaurants. Nice size back yard and garage ideal for extra storage or workshop. With 2 bedrooms and 2 full bathrooms, this would be a great starter home or investment property. The main floor has a bedroom with en-suite full bath, large living room and bonus laundry area. The 2nd floor has a large bedroom and another full bathroom. UPDATES INCLUDE: Dishwasher (2023), hood fan (2023), AC & Furnace (7-10 yrs old), plumbing & electrical (2023). Make your appointment today. You don't want to miss this one!
Key facts
- Back yard
- Bonus laundry area
- Extra storage
Tags
Property features AI
Finance
- Other: Lot dimensions approximately 164 x 40; Building area reported as 1276
- HOA & community: No association fees
Exterior
- Parking: Detached oversized garage (gravel)
- Utilities: Public water; Public sewer
- Home design: Single-family residence; Residential zoning; Shingle roof
- Construction: Built in 1900; Unfinished basement
- Exterior features: Level lot; Paved road access
Interior
- Kitchen: Dishwasher
- Bedrooms: 2 bedrooms (one on the main level, one on the upper level); Bedrooms have egress windows
- Flooring: Vinyl flooring in kitchen, living room, dining room and laundry; Hardwood flooring in upper-level bedroom
- Bathrooms: 2 full bathrooms
- Heating & cooling: Central air; Gas water heater
- Interior features: Cable available; Ceiling fans
- Laundry & utility: Washer and dryer; Main-level laundry room
Neighborhood map
What this means for you Summary
Snapshot
- This is a 2-bed/2.0-bath single-family listed at $60k.
Deal economics
- At list price, monthly cash flow is $561 ($7k/yr) — positive.
- The deal already cash-flows at list — no discount required.
- Meets the 1% rule at list price ($1k rent vs $60k).
- Recommended offer: $58k (3.0% below list) — sets the bar for market timing.
- Cap rate 17.5% vs local median 7.9% in Canton — top-decile yield for the area; either an underpriced asset or a hidden risk that comps aren't pricing in. Stress-test before assuming the spread holds.
Location & tenants
- Location reads 72/100 on livability (#318 in IL) — a middle-class / working-renter tenant base. Strengths: cost of living A+, housing A+, health & safety A+; Watch: crime C-, amenities F, commute F.
- Canton Union SD 66 (town): math 19% / reading 23% proficiency, ranked #417 of 620 in IL (top 67%) — low school quality limits family demand, transient renter base, plan for 1-2y turnover.
- Zoned schools: Canton High School (math 22% / reading 27%, grade F, #256 of 693 statewide, top 44%, 641 students, 0% FRL) — zoned schools average 0% FRL vs 46% district-wide (46 pts lower); this property's tenant base skews higher-income than the district average.
- Market conditions: 102 active listings in the ZIP; 1 comparable units currently listed for rent nearby; 14 units permitted in Fulton County in 2024 (0 in 5+ unit buildings).
Forward outlook
- Local home prices are declining (-3.0%/yr); year-one equity from $415 of loan paydown is wiped out by about $2k of value loss. Plan a longer hold.
- Fulton County population projected at -20% by 2050 — secular population decline; favor cash flow + early exit over multi-decade hold.
- At projected returns (-3.0% appreciation + 3.0% rent growth), your $17k cash investment doubles in ~3 years — after that, you're playing with house money.
Negotiation context
- It's been on market 48 days — a 3% lower offer ($58k) is reasonable based on typical stale-listing flexibility.
Risks & watch-outs
- Watch-outs: built in 1900 — expect roof / HVAC / electrical / plumbing capex.
Questions for the listing agent
- It's been on market 48 days. Have you received any prior offers? Is the seller open to a 3% concession, seller financing, or rate buy-down credit?
- Built in 1900 — when were the roof, HVAC, electrical panel, plumbing, and water heater last replaced?
- Is there a deadline driving the sale (1031 exchange, divorce, estate, relocation)? That informs how much negotiation room exists.
- Schools are F-rated, which usually means shorter tenancies and higher turnover. Who's the typical renter profile here, and what's been the actual vacancy rate?
- What's the average days-on-market for RENTAL listings here right now (not sales)? A rising rental-DOM trend means longer vacancies and softer asking-rent achievability than the comps imply.
- What's the recent tenant-quality profile in this submarket — average credit score on applications, eviction rate, late-payment / NSF rate, and stable-employment percentage? A property-management company in the area should have these aggregated.
- How much new for-sale + rental construction is in the pipeline within 1–3 miles? Heavy new supply typically softens prices + rents 12–24 months out; constrained supply supports both.
Investment metrics
- 1% rule
- 2.00% ✓
- Cap rate
- 17.50%
- Cash-on-cash
- 40.04%
- DSCR
- 2.78
- GRM
- 4.2
CMA / ARV
- ARV (median comp)
- $73,115
- List price
- $60,000
- Delta
- -17.94%
- Verdict
- UNDERPRICED
- Comps
- 20 within 1.0 mi
Show comp detail 12 sales within ~0.75 mi
| Address | Dist | Beds/Ba | Sqft | Sold | Price | $/sf | Match |
|---|---|---|---|---|---|---|---|
| 62 N 5th Ave | 0.11mi | 2/1.0 | 798 (+7%) | 6mo | $67,000 | $84 | 75 |
| 714 E Ash St | 0.29mi | 2/1.0 | 825 (+10%) | 0mo | $84,000 | $102 | 65 |
| 476 Baxter Ct | 0.39mi | 2/1.0 | 792 (+6%) | 6mo | $45,000 | $57 | 63 |
| 1140 E Myrtle St | 0.65mi | 2/1.0 | 744 (-0%) | 3mo | $87,500 | $118 | 62 |
| 320 N 5th Ave | 0.26mi | 2/1.0 | 809 (+8%) | 10mo | $52,500 | $65 | 62 |
| 246 Haffner Blvd | 0.32mi | 2/1.0 | 676 (-10%) | 8mo | $35,000 | $52 | 59 |
| 660 N 9th Ave | 0.52mi | 2/1.0 | 800 (+7%) | 2mo | $83,000 | $104 | 58 |
| 737 N 5th Ave | 0.58mi | 1/1.0 (-1) | 712 (-5%) | 7mo | $57,500 | $81 | 50 |
| 225 E Hickory St | 0.62mi | 2/1.0 | 718 (-4%) | 12mo | $69,900 | $97 | 50 |
| 30 E Maple St | 0.56mi | 2/1.0 | 832 (+11%) | 11mo | $30,000 | $36 | 42 |
| 735 N 8th Ave | 0.59mi | 2/1.0 | 858 (+15%) | 11mo | $85,000 | $99 | 34 |
| 605 S Main St | 0.75mi | 2/1.0 | 832 (+11%) | 12mo | $69,000 | $83 | 33 |
Match score weights: distance 35% · size 25% · config 20% · recency 20%. Top-matched comps best support the ARV.
Projected returns pro-forma
-3.0% appreciation · 3.0% rent growth · sell at horizon
- IRR
- 36.4%
- Equity multiple
- 2.55×
- Total profit
- $25,978
- Equity at exit
- $8,946
- IRR
- 43.1%
- Equity multiple
- 5.08×
- Total profit
- $68,596
- Equity at exit
- $5,188
Cash invested: $16,800 (down + closing). Projections, not guarantees.
Landlord ↔ Tenant lean methodology
- Overall (STATE)
- 43 Moderately Tenant-Leaning
- State Illinois
- 43 Moderately Tenant-Leaning · D+7
- County
- — inherits STATE
- City
- — inherits STATE
ZIP-level market 61520
- Active inventory
- 102
- Price-to-rent
- 4.2×
Monthly cashflow live
- Estimated rent
- $1,200 medium interval (Pro) →
- Mortgage (P&I)
- −$315
- Tax from tax record
- −$48 /mo · $574/yr
- Insurance
- −$25
- HOA
- −$0
- Vacancy / Maint / Mgmt
- −$252
- Net cashflow
- $561
Break-even live
UW: 25.0% down · 7.5% · 30yr · 1.5% tax · 5.0% vac · 8.0% maint · 8.0% mgmt
Financing live
Cash to close
- Down payment
- $15,000
- Closing costs
- $1,800
- Reserves months
- —
- Total cash needed
- —
Loan-product check · same deal, 3 products live
Conventional
25% down · 7.5% · 30yr
- Down + closing
- —
- Monthly P&I
- —
- Monthly cashflow
- —
- DSCR
- —
- Eligible?
- —
Personal DTI + credit; lowest rate.
DSCR
20% down · 8.5% · 30yr
- Down + closing
- —
- Monthly P&I
- —
- Monthly cashflow
- —
- DSCR
- —
- Eligible?
- —
No personal income docs; deal must DSCR.
Hard money
10% down · 12.0% · 12mo
- Down + closing
- —
- Monthly P&I
- —
- Monthly cashflow
- —
- DSCR
- —
- Eligible?
- —
Short-term bridge; refi at stabilization.
Rent comps 1 comps
| Address | Beds | Baths | Sqft | Rent | $/sqft | DOM | Units | Dist |
|---|---|---|---|---|---|---|---|---|
| 437 N 8th Ave Canton, IL | 2.0 | 1.0 | 690 | $1,200 | $1.74 | 13d | 1 | 0.39mi |
Listing history 16 events
-
2026-06-18days on market $60,000 Active 48 DOM
-
2026-06-17days on market $60,000 Active 47 DOM
-
2026-06-16days on market $60,000 Active 46 DOM
-
2026-06-15days on market $60,000 Active 45 DOM
-
2026-06-13days on market $60,000 Active 43 DOM
-
2026-06-12days on market $60,000 Active 42 DOM
-
2026-06-09days on market $60,000 Active 39 DOM
-
2026-06-08days on market $60,000 Active 38 DOM
-
2026-06-07days on market $60,000 Active 37 DOM
-
2026-06-07days on market $60,000 Active 36 DOM
-
2026-06-04days on market $60,000 Active 33 DOM
-
2026-06-02days on market $60,000 Active 32 DOM
-
2026-06-01days on market $60,000 Active 31 DOM
-
2026-05-31days on market $60,000 Active 30 DOM
-
2026-05-31days on market $60,000 Active 29 DOM
-
2026-05-01$60,000 Active 592-char remark
ⓘ Source: listings_history table (triggers on properties + properties_extension) + one-shot
backfill from property_details.listing_events for pre-trigger history.
Tax reassessment forecast IL · Partial reset (capped growth)
- Current annual tax
- $574 · $48/mo
- Projected year-2 tax
- $968 · $81/mo
- Expected delta
- +$394/yr (+$33/mo · 68.6%)
ⓘ Screening estimate from a state-policy table — verify with the county assessor before closing.
Climate risk First Street
- Flood 1/10 Low FEMA zone X (unshaded) · 0% chance over 30 yrs
- Wildfire 1/10 Low
- Heat 3/10 Moderate 7 d/yr ≥105°F today · 18 d/yr by 30 yrs out
- Wind 2/10 Low 0% chance of damaging wind over 30 yrs
- Air quality 2/10 Low 1 unhealthy d/yr today · 2 by 30 yrs out
Nearby sold comps map
Loading sold comps map…
Walkable amenities ~0.75 mi
Loading nearby amenities…
Taxation est. · year 1
- Rental income
- $14,400
- − Mortgage interest
- −$3,361
- − Property taxes
- −$574
- − Insurance
- −$300
- − Repairs & maintenance
- −$1,152
- − Management
- −$1,152
- − Depreciation
- −$1,745
- Taxable income
- $6,116
- Est. tax owed @ 24.0%
- −$1,468
- After-tax cash flow
- $5,258/yr
For passive investors: Depreciation is non-cash, so a rental often shows a tax loss while cash-flowing — sheltering income. Rental losses are passive: they offset passive income freely, and up to $25,000/yr can offset ordinary (W-2) income if you actively participate and your MAGI is under $100k (phasing out to $0 by $150k); unused losses carry forward. On sale, claimed depreciation is recaptured at up to 25%, and gains may owe capital-gains tax (a 1031 exchange can defer both). Figures are a year-1 estimate at your 24.0% rate — not tax advice; consult a CPA.
Schools (NCES district)
- District
- Canton Union SD 66
- NCES district ID
- 1708280
- Math proficiency
- 19% ▼ -10.00%
- Reading proficiency
- 23% ▼ -12.00%
- Median HH income
- $42,657
- Composite
- 18.03/100
- National rank
- #8980
- State rank
- #417 of 620 in IL
Livability — Canton
- Score
- 72/100
- State rank
- #318
- US rank
- #6313
Category grades
Schools grade is shown separately in the Schools card above.
Census & demographics
- Census place
- Canton, IL
- Population (ZIP)
- 16,098
Population outlook (Fulton County) Hauer SSP2
- Today (2025)
- 33,356 people
- By 2030
- 32,144 · -3.6%
- By 2040
- 29,518 · -11.5%
- By 2050
- 26,775 · -19.7%
- By 2075
- 19,972 · -40.1%
- By 2100
- 13,580 · -59.3%
Race, ethnicity, and origin ACS 2023
- Neighborhood character
- Predominantly White (88%)
- Race & ethnicity
- White 88% Black 5% Hispanic / Latino 4% Two or more races 4% Native American 1%
- Common ancestry
- Slovak 3% Lithuanian 1% Romanian 1%
- Foreign-born
- 2% · Canada
- Languages at home
- 96% English-only · Spanish 3%
Political lean MEDSL · Fulton
- 2024 margin
- Strong R (+23.8) · D 37.1% · R 60.9% · Other 2.0%
- 2008→2024 swing
- -45.2pp toward R · 2008: 21.3pp · 2024: -23.8pp
- All cycles
- 2024: R+23.8 2020: R+20.1 2016: R+15.1 2012: D+11.1 2008: D+21.3
Not yet ingested
- Civics
- —
Market trends
- HPI YoY
- ▼ -88.00%
- Current HPI
- 123.8086
- Rent YoY
- —
- Metro
- —
- State GDP YoY
- ▲ 1.59%
- F500 in state
- 60
Industry mix (Fortune 500 HQ in IL)
| Industry | F500 HQs | Revenue |
|---|---|---|
| Insurance | 4 | $201B |
|
||
| Consumer Goods | 4 | $87B |
|
||
| Industrial Machinery | 3 | $64B |
|
||
| Healthcare | 2 | $55B |
|
||
| Retail / Pharmacy | 1 | $148B |
|
||
| Agriculture / Food | 1 | $86B |
|
||
Price history
1 event — show timeline
- 2026-05-01 Listed $60,000 RMLSA as Distributed by MLS Grid
Property tax history
+3.1%/yrLatest (2024): $574 · -48.6% YoY. Source: county tax records.
Cash-flow waterfall
monthlySold comps — $/sqft
last 12 mo · ≤1 miLoading sold comps…