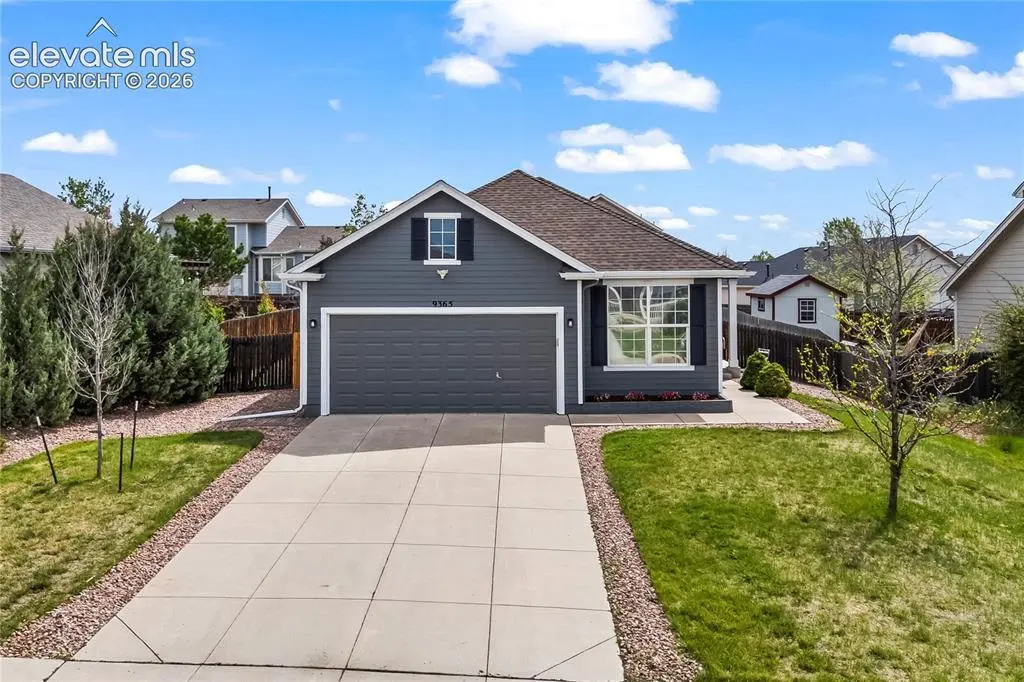
9365 Morfontaine Rd · Colorado Springs, CO
Flood risk 1/10 · Minimal
- FEMA flood zone
- X (unshaded)
- Chance of flooding over 30 yrs
- 0.0%
- Est. flood insurance / yr
- $507 – $1,088
Fire risk 5/10 · Moderate
- Est. fire insurance / yr
- $939 – $1,743
Heat risk 2/10 · Minimal
- Hot days now (above 87°F)
- 7 days/yr
- Hot days in 30 yrs
- 19 days/yr
Wind risk 2/10 · Minimal
- Chance of severe wind over 30 yrs
- —
Air-quality risk 2/10 · Minimal
- Unhealthy air days now
- 1 days/yr
- Unhealthy air days in 30 yrs
- 1 days/yr
Risk factors via First Street. Map © Google.
Why this score? — see what drove the D- grade
The composite is a weighted blend of 9 inputs, each scored 0–100. Each bar is that input's sub-score; the figure is the points it added to the 100-point composite (weight × sub-score).
- Cash flow +12.3/30.0
- ARV discount +8.2/15.0
- Livability +3.9/5.0
- DSCR +3.7/10.0
- Schools +3.4/10.0
- Rent growth +3.3/5.0
- Condition / age +2.5/5.0
- 1% rule +2.4/10.0
- Appreciation +0.0/10.0
$390,000
🖨 Deal sheet 📄 Offer letter ✓ Due diligence
Listing remarks
Beautifully refreshed and move-in ready ranch-plan home in the desirable Woodmen Hills community! This super clean home features true main-level living with 3 bedrooms, 2 full bathrooms, and an attached 2-car garage. Recent updates include brand new interior and exterior paint, stylish vinyl plank flooring through much of the home, new kitchen countertops, and freshly painted kitchen cabinets. The bright and functional floor plan offers comfortable everyday living with everything conveniently located on one level. The fully fenced backyard is level and usable — perfect for pets, play, gardening, or entertaining. Conveniently located near shopping, dining, parks, schools, and the Woodm
Key facts
- Main-level living
- 7,069 sq ft lot
- 2 garage spots
Tags
Property features AI
Finance
- Financial info: Financing available: Cash, Conventional, FHA, VA
- HOA & community: HOA with annual fee ($100) covering management; Community clubhouse, fitness center, parks/open space, playground, and pool
Exterior
- Parking: Attached 2-car garage with 1 remote; Concrete driveway
- Utilities: Municipal water; Electricity
- Home design: Single-family home; Level lot
- Construction: Wood-frame construction; Wood siding; Composite shingle roof; Crawl space foundation; Existing home
- Exterior features: Rear fence; Front landscaping; Concrete patio
Interior
- Kitchen: Dishwasher; Microwave; Range oven (gas/electric); Refrigerator
- Bedrooms: Main-floor bedroom(s)
- Flooring: Carpet; Luxury vinyl; Vinyl/linoleum
- Bathrooms: 2 full bathrooms
- Heating & cooling: Forced air heating (natural gas); No cooling
- Interior features: Carpet and luxury vinyl flooring; Vinyl/linoleum in select areas; No central cooling; Forced air heating (natural gas)
- Laundry & utility: Electric washer/dryer hook-up
Neighborhood map
What this means for you Summary
Snapshot
- This is a 3-bed/2.0-bath single-family listed at $390k.
Deal economics
- At list price, monthly cash flow is $-69 ($-831/yr) — negative.
- To cash-flow at today's rent, offer at most $378k (3.1% below list).
- To meet the 1% rule (rent ≥ 1% of price), the offer needs to be $289k (25.9% below list).
- Recommended offer: $289k (25.9% below list) — sets the bar for 1% rule.
- Cap rate 6.1% vs local median 3.3% in Colorado Springs — top-decile yield for the area; either an underpriced asset or a hidden risk that comps aren't pricing in. Stress-test before assuming the spread holds.
Location & tenants
- Location reads 78/100 on livability (#23 in CO, #2,639 nationally) — a middle-class / working-renter tenant base. Strengths: amenities A+, housing A+, health & safety A+; Watch: cost of living C-, crime F.
- El Paso County Colorado School District 49 (urban): math 27% / reading 47% proficiency, ranked #27 of 86 in CO (top 31%) — families likely to look elsewhere, expect single-tenant / working-renter base with shorter leases; only 17% free/reduced lunch — higher-income household profile.
- Market conditions: Rents rising (+3.1%/yr); 513 active listings in the ZIP; 2 comparable units currently listed for rent nearby; high-income renter base; 3,906 units permitted in El Paso County in 2024 (872 in 5+ unit buildings).
Forward outlook
- Local home prices are declining (-3.0%/yr); year-one equity from $3k of loan paydown is wiped out by about $12k of value loss. Plan a longer hold.
- El Paso County population projected at +28% by 2050 — long-run rental-demand tailwind backs the buy-and-hold thesis.
Negotiation context
- Only 14 days on market — expect competitive offers; lowballing is unlikely to land.
- Current owner paid $300k; 30% above their basis — modest negotiation headroom, anchor on the comps not their cost.
Risks & watch-outs
- Climate carrying-cost: moderate wildfire risk — expect insurance premiums to compound above CPI over the hold.
Questions for the listing agent
- What do current leases actually rent for vs. the listed asking? Can we see a recent rent roll and the last 12 months of T-12 income?
- What does the HOA fee cover, when was the last increase, and are there any pending special assessments or reserve-fund shortfalls?
- Is there a deadline driving the sale (1031 exchange, divorce, estate, relocation)? That informs how much negotiation room exists.
- Schools are B-rated — typically a magnet for longer-tenancy family renters. What's the average tenant stay here, and is there a school-zone premium baked into asking?
- Crime grade is F in this area — have there been break-ins, vandalism, or insurance claims at this property in the last 3 years? What carrier currently insures it and at what premium?
- The area grade is low — what's the realistic commute time and amenity access for the typical tenant pool here? Any planned neighborhood developments (good or bad) we should know about?
- What's the average days-on-market for RENTAL listings here right now (not sales)? A rising rental-DOM trend means longer vacancies and softer asking-rent achievability than the comps imply.
- What's the recent tenant-quality profile in this submarket — average credit score on applications, eviction rate, late-payment / NSF rate, and stable-employment percentage? A property-management company in the area should have these aggregated.
- How much new for-sale + rental construction is in the pipeline within 1–3 miles? Heavy new supply typically softens prices + rents 12–24 months out; constrained supply supports both.
Investment metrics
- 1% rule
- 0.74% ✗
- Cap rate
- 6.08%
- Cash-on-cash
- -0.76%
- DSCR
- 0.97
- GRM
- 11.3
CMA / ARV
- ARV (on-the-fly)
- $396,344
- Comps found
- 9
Show comp detail 9 sales within ~0.75 mi
| Address | Dist | Beds/Ba | Sqft | Sold | Price | $/sf | Match |
|---|---|---|---|---|---|---|---|
| 9333 Bethpage Rd | 0.08mi | 3/2.0 | 1,234 (-8%) | 1mo | $412,500 | $334 | 82 |
| 12874 Oakland Hills Rd | 0.33mi | 3/2.0 | 1,328 (-1%) | 3mo | $352,000 | $265 | 81 |
| 12603 Pine Valley Cir | 0.23mi | 3/2.0 | 1,357 (+1%) | 14mo | $420,000 | $310 | 76 |
| 9362 Bethpage Rd | 0.09mi | 3/2.5 | 1,353 (+1%) | 20mo | $400,000 | $296 | 76 |
| 12209 Crystal Downs Rd | 0.39mi | 3/2.0 | 1,331 (-1%) | 7mo | $414,500 | $311 | 75 |
| 12883 Casa De Campo Rd | 0.35mi | 3/2.0 | 1,447 (+8%) | 2mo | $425,000 | $294 | 68 |
| 12841 Oakland Hills Rd | 0.30mi | 3/2.0 | 1,265 (-6%) | 23mo | $410,000 | $324 | 58 |
| 11956 Eagle Crest Ct | 0.55mi | 3/3.0 | 1,444 (+8%) | 5mo | $385,000 | $267 | 53 |
| 12931 Casa De Campo Rd | 0.42mi | 3/2.5 | 1,537 (+15%) | 12mo | $433,000 | $282 | 44 |
Match score weights: distance 35% · size 25% · config 20% · recency 20%. Top-matched comps best support the ARV.
Projected returns pro-forma
-3.0% appreciation · 3.09% rent growth · sell at horizon
- IRR
- -17.5%
- Equity multiple
- 0.38×
- Total profit
- $-67,515
- Equity at exit
- $58,150
- IRR
- -9.5%
- Equity multiple
- 0.41×
- Total profit
- $-64,078
- Equity at exit
- $33,720
Cash invested: $109,200 (down + closing). Projections, not guarantees.
Landlord ↔ Tenant lean methodology
- Overall (STATE)
- 38 Tenant-Leaning
- State Colorado
- 38 Tenant-Leaning · D+4
- County
- — inherits STATE
- City
- — inherits STATE
ZIP-level market 80831
- Home prices YoY
- -30.4%
- Rents YoY
- 3.1%
- Active inventory
- 513
- Price-to-rent
- 11.3×
Monthly cashflow live
- Estimated rent
- $2,889 medium interval (Pro) →
- Mortgage (P&I)
- −$2,045
- Tax from tax record
- −$136 /mo · $1,626/yr
- Insurance
- −$162
- HOA
- −$8
- Vacancy / Maint / Mgmt
- −$607
- Net cashflow
- $-69
Break-even live
UW: 25.0% down · 7.5% · 30yr · 1.5% tax · 5.0% vac · 8.0% maint · 8.0% mgmt
Financing live
Cash to close
- Down payment
- $97,500
- Closing costs
- $11,700
- Reserves months
- —
- Total cash needed
- —
Loan-product check · same deal, 3 products live
Conventional
25% down · 7.5% · 30yr
- Down + closing
- —
- Monthly P&I
- —
- Monthly cashflow
- —
- DSCR
- —
- Eligible?
- —
Personal DTI + credit; lowest rate.
DSCR
20% down · 8.5% · 30yr
- Down + closing
- —
- Monthly P&I
- —
- Monthly cashflow
- —
- DSCR
- —
- Eligible?
- —
No personal income docs; deal must DSCR.
Hard money
10% down · 12.0% · 12mo
- Down + closing
- —
- Monthly P&I
- —
- Monthly cashflow
- —
- DSCR
- —
- Eligible?
- —
Short-term bridge; refi at stabilization.
Rent comps 2 comps
| Address | Beds | Baths | Sqft | Rent | $/sqft | DOM | Units | Dist |
|---|---|---|---|---|---|---|---|---|
| 9314 Prairie Dunes Rd Peyton, CO | 3.0 | 3.0 | 1632 | $2,420 | $1.48 | 2d | 1 | 0.08mi |
| 13432 Stone Valley Dr Peyton, CO | 4.0 | 2.5 | 1748 | $2,395 | $1.37 | 2d | 1 | 1.14mi |
HOA detail
- Monthly dues
- $8 · $96/yr
Listing history 15 events
-
2026-06-13statusdays on market $390,000 Pending 14 DOM
-
2026-06-10pricedays on market $390,000 Active 13 DOM
-
2026-06-09days on market $395,000 Active 12 DOM
-
2026-06-08days on market $395,000 Active 11 DOM
-
2026-06-07days on market $395,000 Active 10 DOM
-
2026-06-05days on market $395,000 Active 7 DOM
-
2026-06-03days on market $395,000 Active 6 DOM
-
2026-06-03days on market $395,000 Active 5 DOM
-
2026-06-01days on market $395,000 Active 4 DOM
-
2026-05-31days on market $395,000 Active 3 DOM
-
2026-05-28$395,000 Active
-
2020-08-11soldstatus $299,900
-
2012-04-05soldstatus $160,000
-
2003-09-11soldstatus $1,200,000
-
2003-09-11soldstatus $1,852,500
ⓘ Source: listings_history table (triggers on properties + properties_extension) + one-shot
backfill from property_details.listing_events for pre-trigger history.
Tax reassessment forecast CO · Resets to sale price
- Current annual tax
- $1,626 · $136/mo
- Projected year-2 tax
- $2,145 · $179/mo
- Expected delta
- +$519/yr (+$43/mo · 31.9%)
ⓘ Screening estimate from a state-policy table — verify with the county assessor before closing.
Climate risk First Street
- Flood 1/10 Low FEMA zone X (unshaded) · 0% chance over 30 yrs
- Wildfire 5/10 Major
- Heat 2/10 Low 7 d/yr ≥87°F today · 19 d/yr by 30 yrs out
- Wind 2/10 Low
- Air quality 2/10 Low 1 unhealthy d/yr today · 1 by 30 yrs out
Nearby sold comps map
Loading sold comps map…
Walkable amenities ~0.75 mi
Loading nearby amenities…
Taxation est. · year 1
- Rental income
- $34,662
- − Mortgage interest
- −$21,846
- − Property taxes
- −$1,626
- − Insurance
- −$1,950
- − Repairs & maintenance
- −$2,773
- − Management
- −$2,773
- − HOA
- −$96
- − Depreciation
- −$11,345
- Taxable loss
- −$7,747
- Est. tax savings @ 24.0%
- +$1,859
- After-tax cash flow
- $1,028/yr
For passive investors: Depreciation is non-cash, so a rental often shows a tax loss while cash-flowing — sheltering income. Rental losses are passive: they offset passive income freely, and up to $25,000/yr can offset ordinary (W-2) income if you actively participate and your MAGI is under $100k (phasing out to $0 by $150k); unused losses carry forward. On sale, claimed depreciation is recaptured at up to 25%, and gains may owe capital-gains tax (a 1031 exchange can defer both). Figures are a year-1 estimate at your 24.0% rate — not tax advice; consult a CPA.
Schools (NCES district)
- District
- El Paso County Colorado School District 49
- NCES district ID
- 0803870
- Math proficiency
- 27% ▼ -4.00%
- Reading proficiency
- 47% ▼ -1.00%
- Median HH income
- $75,604
- Composite
- 34.38/100
- National rank
- #5210
- State rank
- #27 of 86 in CO
Livability — Colorado Springs
- Score
- 78/100
- State rank
- #23
- US rank
- #2639
Category grades
Schools grade is shown separately in the Schools card above.
Census & demographics
- County
- El Paso County · 689,348 people
- City population
- 555,783
- Metro
- Colorado Springs, CO
- Population (ZIP)
- 33,912
- Household income
- $132,467
- Rent vs Own
- Severe rent burden
- 142.0
Population outlook (El Paso County) Hauer SSP2
- Today (2025)
- 768,926 people
- By 2030
- 815,739 · +6.1%
- By 2040
- 903,489 · +17.5%
- By 2050
- 981,204 · +27.6%
- By 2075
- 1,155,542 · +50.3%
- By 2100
- 1,202,070 · +56.3%
Race, ethnicity, and origin ACS 2023
- Neighborhood character
- Predominantly White (73%)
- Race & ethnicity
- White 73% Two or more races 14% Hispanic / Latino 12% Black 4% Asian 2% Native American 1%
- Hispanic origin (detail)
- Mexican 6% Puerto Rican 1%
- Common ancestry
- Italian 4% Slovak 3% Portuguese 3%
- Foreign-born
- 4% · Canada, South Korea
- Languages at home
- 94% English-only · Spanish 5% Other Asian/Pacific 1%
Political lean MEDSL · El Paso
- 2024 margin
- Lean R (+9.8) · D 43.8% · R 53.5% · Other 2.7%
- 2008→2024 swing
- +9.0pp toward D · 2008: -18.8pp · 2024: -9.8pp
- All cycles
- 2024: R+9.8 2020: R+10.8 2016: R+22.6 2012: R+21.4 2008: R+18.8
Not yet ingested
- Civics
- —
Market trends
- HPI YoY
- ▼ -115.34%
- Current HPI
- 264.0763
- Rent YoY
- ▲ 3.09%
- Metro
- Colorado Springs, CO
- State GDP YoY
- ▲ 1.95%
- F500 in state
- 14
Industry mix (Fortune 500 HQ in CO)
| Industry | F500 HQs | Revenue |
|---|---|---|
| Technology Distribution | 1 | $31B |
|
||
| Food / Agriculture | 1 | $18B |
|
||
| Packaging | 1 | $14B |
|
||
| Healthcare | 1 | $13B |
|
||
| Energy | 1 | $10B |
|
||
| Technology | 1 | $4B |
|
||
Price history
-67.1% since first listed5 events — show timeline
- 2026-05-28 Listed $395,000 elevateMLS
- 2020-08-11 Sold (Public Records) $299,900 Public Records
- 2012-04-05 Sold (Public Records) $160,000 Public Records
- 2003-09-11 Sold (Public Records) $1,852,500 Public Records
- 2003-09-11 Sold (Public Records) $1,200,000 Public Records
Property tax history
+2.2%/yrLatest (2024): $1,626 · +7.0% YoY. Source: county tax records.
Cash-flow waterfall
monthlySold comps — $/sqft
last 12 mo · ≤1 miLoading sold comps…