 11-Plex
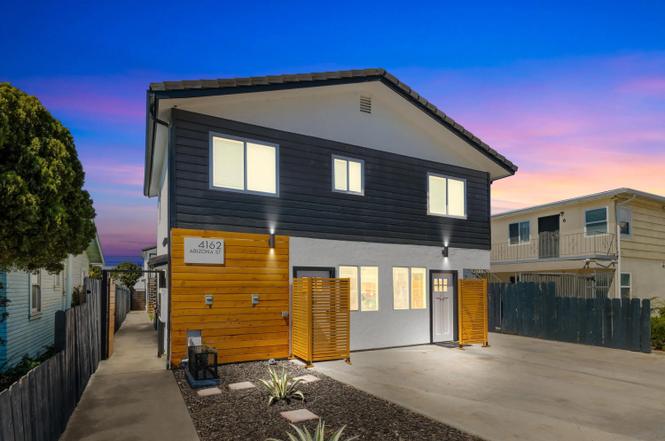
4162 Arizona St · San Diego, CA
Flood risk 1/10 · Minimal
- FEMA flood zone
- X (unshaded)
- Chance of flooding over 30 yrs
- 0.0%
- Est. flood insurance / yr
- $507 – $1,088
Fire risk 1/10 · Minimal
- Est. fire insurance / yr
- $659 – $1,223
Heat risk 4/10 · Minor
- Hot days now (above 89°F)
- 7 days/yr
- Hot days in 30 yrs
- 20 days/yr
Wind risk 1/10 · Minimal
- Chance of severe wind over 30 yrs
- —
Air-quality risk 3/10 · Minor
- Unhealthy air days now
- 4 days/yr
- Unhealthy air days in 30 yrs
- 4 days/yr
Risk factors via First Street. Map © Google.
Why this score? — see what drove the D- grade
The composite is a weighted blend of 9 inputs, each scored 0–100. Each bar is that input's sub-score; the figure is the points it added to the 100-point composite (weight × sub-score).
- Cash flow +13.7/30.0
- ARV discount +7.5/15.0
- DSCR +4.1/10.0
- Livability +3.8/5.0
- 1% rule +3.0/10.0
- Rent growth +2.8/5.0
- Condition / age +2.5/5.0
- Schools +2.2/10.0
- Appreciation +0.0/10.0
$4,195,000
🖨 Deal sheet 📄 Offer letter ✓ Due diligence
Multi-family units
County records classify this as Multi-Family (5+ Unit). Listing-text estimate: 11 units. confirmed
5+ unit building — per-unit beds/baths from public records are typically unavailable; the breakdown below (if shown) is an estimate from the listing text.
Listing remarks MLS
NEVER BEEN THE MARKET BEFORE ! 4/ 2 Bedroom 2 Bath units 829 sq. ft. / 2- 1 Bedroom 1 Bath units 628 sq, ft. s/ 4- 1 car garages. Month to month Tenants. FAMILY OWNED. GREAT AREA. Future rents. Perfect Value add property with lots of potential, within the opportunity zone with public transportation near by. 1031 exchange
Key facts
- Parking for 9 cars
- Completely renovated
- Listed 127 days
Tags
Property features AI
Finance
- Other: Listing held by San Diego Association of REALTOR; Listing broker: Marcus & Millichap; listing agent: Ben Sierpina
Exterior
- Home design: Residential income property (Commercial-Residential Income subtype)
- Exterior features: Lot measured in acres
Interior
- Bathrooms: 15 full bathrooms
- Interior features: Unbranded virtual tour available
Neighborhood map
What this means for you Summary
Snapshot
- This is a 11 × 10-bed/15.0-bath units multifamily listed at $4.20M.
Deal economics
- At list price, monthly cash flow is $313 ($4k/yr) — positive. Per door: $28/mo.
- The deal already cash-flows at list — no discount required.
- To meet the 1% rule (rent ≥ 1% of price), the offer needs to be $3.34M (20.4% below list).
- Recommended offer: $3.34M (20.4% below list) — sets the bar for 1% rule.
- Cap rate 6.4% vs local median 2.0% in San Diego — top-decile yield for the area; either an underpriced asset or a hidden risk that comps aren't pricing in. Stress-test before assuming the spread holds.
Location & tenants
- Location reads 75/100 on livability (#123 in CA, #4,206 nationally) — a middle-class / working-renter tenant base. Strengths: amenities A+, commute A+, employment A+; Watch: health & safety C-, crime D+, cost of living F.
- San Diego Unified (urban): math 19% / reading 29% proficiency, ranked #393 of 517 in CA (top 76%) — low school quality limits family demand, transient renter base, plan for 1-2y turnover.
- Market conditions: Rents rising (+1.4%/yr); 171 active listings in the ZIP; solid renter incomes; 11,759 units permitted in San Diego County in 2024 (7,244 in 5+ unit buildings).
- At $33,404/mo this rent would consume 426% of the median local household income ($94k/yr) (locally 3114% of renters already pay >50% of income on rent) — very limited rent-growth headroom before tenants either downsize or default.
Forward outlook
- Local home prices are declining (-3.0%/yr); year-one equity from $29k of loan paydown is wiped out by about $126k of value loss. Plan a longer hold.
- San Diego County population projected at +20% by 2050 — long-run rental-demand tailwind backs the buy-and-hold thesis.
Negotiation context
- It's been on market 128 days — a 12% lower offer ($3.69M) is reasonable based on typical stale-listing flexibility.
- 4 sale attempts since 2y ago with the ask held roughly flat each time — persistent listings suggest the price (not the market) is what's stuck; bring a comps-based counter.
- Current owner paid $2.17M; list at $4.20M implies a 93% gain — meaningful room to come down on a strong offer.
Questions for the listing agent
- It's been on market 128 days. Have you received any prior offers? Is the seller open to a 20% concession, seller financing, or rate buy-down credit?
- Can we see the unit-by-unit rent roll, current vacancy, and any below-market leases? What's the average tenancy length?
- What capital expenditures (roof, boiler, parking lot, exteriors) have been made in the last 5 years, and what's planned in the next 2?
- Why hasn't it sold? Are there any deal-killer items the seller is aware of (foundation, flood, title, zoning, code violations)?
- Is there a deadline driving the sale (1031 exchange, divorce, estate, relocation)? That informs how much negotiation room exists.
- Schools are B-rated — typically a magnet for longer-tenancy family renters. What's the average tenant stay here, and is there a school-zone premium baked into asking?
- Crime grade is D in this area — have there been break-ins, vandalism, or insurance claims at this property in the last 3 years? What carrier currently insures it and at what premium?
- The area grade is low — what's the realistic commute time and amenity access for the typical tenant pool here? Any planned neighborhood developments (good or bad) we should know about?
- What's the average days-on-market for RENTAL listings here right now (not sales)? A rising rental-DOM trend means longer vacancies and softer asking-rent achievability than the comps imply.
- What's the recent tenant-quality profile in this submarket — average credit score on applications, eviction rate, late-payment / NSF rate, and stable-employment percentage? A property-management company in the area should have these aggregated.
- How much new apartment / multifamily construction is in the pipeline within 1–3 miles? Heavy new supply (>2% of stock underway) typically softens rents 12–24 months out; light construction supports rent growth.
Investment metrics
- 1% rule
- 0.80% ✗
- Cap rate
- 6.38%
- Cash-on-cash
- 0.32%
- DSCR
- 1.01
- GRM
- 10.5
CMA / ARV
No comps found within radius.
Projected returns pro-forma
-3.0% appreciation · 1.38% rent growth · sell at horizon
- IRR
- -17.5%
- Equity multiple
- 0.39×
- Total profit
- $-714,697
- Equity at exit
- $625,488
- IRR
- -12.6%
- Equity multiple
- 0.31×
- Total profit
- $-814,728
- Equity at exit
- $362,707
Cash invested: $1,174,600 (down + closing). Projections, not guarantees.
Landlord ↔ Tenant lean methodology
- Overall (STATE)
- 18 Strongly Tenant-Friendly
- State California
- 18 Strongly Tenant-Friendly · D+13
- County
- — inherits STATE
- City
- — inherits STATE
ZIP-level market 92104
- Rents YoY
- 1.4%
- Active inventory
- 171
- Price-to-rent
- 115.1×
Monthly cashflow live
- Estimated rent
- $33,404 medium interval (Pro) →
- Mortgage (P&I)
- −$21,999
- Tax from tax record
- −$2,329 /mo · $27,948/yr
- Insurance
- −$1,748
- HOA
- −$0
- Vacancy / Maint / Mgmt
- −$7,015
- Net cashflow
- $313
Break-even live
11-unit breakdown (identical units grouped — click to expand)
| Units | Beds | Baths | Est. rent |
|---|---|---|---|
| 11× units | 10 | 15 | $33,407 |
| #1 | 10 | 15 | $3,037 |
| #2 | 10 | 15 | $3,037 |
| #3 | 10 | 15 | $3,037 |
| #4 | 10 | 15 | $3,037 |
| #5 | 10 | 15 | $3,037 |
| #6 | 10 | 15 | $3,037 |
| #7 | 10 | 15 | $3,037 |
| #8 | 10 | 15 | $3,037 |
| #9 | 10 | 15 | $3,037 |
| #10 | 10 | 15 | $3,037 |
| #11 | 10 | 15 | $3,037 |
| Total (11 units) | $33,404 | ||
UW: 25.0% down · 7.5% · 30yr · 1.5% tax · 5.0% vac · 8.0% maint · 8.0% mgmt
Financing live
Cash to close
- Down payment
- $1,048,750
- Closing costs
- $125,850
- Reserves months
- —
- Total cash needed
- —
Loan-product check · same deal, 3 products live
Conventional
25% down · 7.5% · 30yr
- Down + closing
- —
- Monthly P&I
- —
- Monthly cashflow
- —
- DSCR
- —
- Eligible?
- —
Personal DTI + credit; lowest rate.
DSCR
20% down · 8.5% · 30yr
- Down + closing
- —
- Monthly P&I
- —
- Monthly cashflow
- —
- DSCR
- —
- Eligible?
- —
No personal income docs; deal must DSCR.
Hard money
10% down · 12.0% · 12mo
- Down + closing
- —
- Monthly P&I
- —
- Monthly cashflow
- —
- DSCR
- —
- Eligible?
- —
Short-term bridge; refi at stabilization.
Listing history 29 events
-
2026-06-18days on market $4,195,000 Active 128 DOM
-
2026-06-17days on market $4,195,000 Active 127 DOM
-
2026-06-16days on market $4,195,000 Active 126 DOM
-
2026-06-15days on market $4,195,000 Active 125 DOM
-
2026-06-13days on market $4,195,000 Active 123 DOM
-
2026-06-10price $4,195,000 Active 119 DOM
-
2026-06-09days on market $4,225,000 Active 119 DOM
-
2026-06-08days on market $4,225,000 Active 118 DOM
-
2026-06-07days on market $4,225,000 Active 117 DOM
-
2026-06-04days on market $4,225,000 Active 114 DOM
-
2026-06-03days on market $4,225,000 Active 113 DOM
-
2026-06-01days on market $4,225,000 Active 111 DOM
-
2026-05-31days on market $4,225,000 Active 110 DOM
-
2026-04-07price $4,225,000
-
2026-03-25price $4,250,000
-
2026-03-06price $4,275,000
-
2026-02-11$4,295,000 Active
-
2025-11-06historical
-
2025-10-01price $4,295,000
-
2025-09-17price $4,345,000
-
2025-08-15status Active
-
2025-08-14historical
-
2025-08-12price $4,370,000
-
2025-07-01price $4,395,000
-
2025-05-12$4,450,000 Active
-
2024-02-23soldstatus $2,175,000 326-char remark
Show marketing remark (326 chars)
NEVER BEEN THE MARKET BEFORE ! 4/ 2 Bedroom 2 Bath units 829 sq. ft. / 2- 1 Bedroom 1 Bath units 628 sq, ft. s/ 4- 1 car garages. Month to month Tenants. FAMILY OWNED. GREAT AREA. Future rents. Perfect Value add property with lots of potential, within the opportunity zone with public transportation near by. 1031 exchange
-
2024-02-23soldstatus $2,175,000
Show marketing remark (326 chars)
NEVER BEEN THE MARKET BEFORE ! 4/ 2 Bedroom 2 Bath units 829 sq. ft. / 2- 1 Bedroom 1 Bath units 628 sq, ft. s/ 4- 1 car garages. Month to month Tenants. FAMILY OWNED. GREAT AREA. Future rents. Perfect Value add property with lots of potential, within the opportunity zone with public transportation near by. 1031 exchange
-
2024-01-23$2,100,000 326-char remark
Show marketing remark (326 chars)
NEVER BEEN THE MARKET BEFORE ! 4/ 2 Bedroom 2 Bath units 829 sq. ft. / 2- 1 Bedroom 1 Bath units 628 sq, ft. s/ 4- 1 car garages. Month to month Tenants. FAMILY OWNED. GREAT AREA. Future rents. Perfect Value add property with lots of potential, within the opportunity zone with public transportation near by. 1031 exchange
-
1985-05-09soldstatus $87,000
ⓘ Source: listings_history table (triggers on properties + properties_extension) + one-shot
backfill from property_details.listing_events for pre-trigger history.
Tax reassessment forecast CA · Resets to sale price
- Current annual tax
- $27,948 · $2,329/mo
- Projected year-2 tax
- $31,882 · $2,657/mo
- Expected delta
- +$3,934/yr (+$328/mo · 14.1%)
ⓘ Screening estimate from a state-policy table — verify with the county assessor before closing.
Climate risk First Street
- Flood 1/10 Low FEMA zone X (unshaded) · 0% chance over 30 yrs
- Wildfire 1/10 Low
- Heat 4/10 Moderate 7 d/yr ≥89°F today · 20 d/yr by 30 yrs out
- Wind 1/10 Low
- Air quality 3/10 Moderate 4 unhealthy d/yr today · 4 by 30 yrs out
Nearby sold comps map
Loading sold comps map…
Walkable amenities ~0.75 mi
Loading nearby amenities…
Taxation est. · year 1
- Rental income
- $400,848
- − Mortgage interest
- −$234,985
- − Property taxes
- −$27,948
- − Insurance
- −$20,975
- − Repairs & maintenance
- −$32,068
- − Management
- −$32,068
- − Depreciation
- −$122,036
- Taxable loss
- −$69,233
- Est. tax savings @ 24.0%
- +$16,616
- After-tax cash flow
- $20,374/yr
For passive investors: Depreciation is non-cash, so a rental often shows a tax loss while cash-flowing — sheltering income. Rental losses are passive: they offset passive income freely, and up to $25,000/yr can offset ordinary (W-2) income if you actively participate and your MAGI is under $100k (phasing out to $0 by $150k); unused losses carry forward. On sale, claimed depreciation is recaptured at up to 25%, and gains may owe capital-gains tax (a 1031 exchange can defer both). Figures are a year-1 estimate at your 24.0% rate — not tax advice; consult a CPA.
Schools (NCES district)
- District
- San Diego Unified
- NCES district ID
- 0634320
- Math proficiency
- 19% ▼ -29.00%
- Reading proficiency
- 29% ▼ -28.00%
- Median HH income
- $61,673
- Composite
- 22.31/100
- National rank
- #8135
- State rank
- #393 of 517 in CA
Livability — San Diego
- Score
- 75/100
- State rank
- #123
- US rank
- #4206
Category grades
Schools grade is shown separately in the Schools card above.
Census & demographics
- Census place
- San Diego, CA
- County
- San Diego County · 3,178,799 people
- City population
- 1,397,612
- Metro
- San Diego-Chula Vista-Carlsbad, CA
- Population (ZIP)
- 47,410
- Household income
- $94,014
- Rent vs Own
- Severe rent burden
- 3114.0
Population outlook (San Diego County) Hauer SSP2
- Today (2025)
- 3,678,185 people
- By 2030
- 3,856,546 · +4.8%
- By 2040
- 4,171,407 · +13.4%
- By 2050
- 4,421,607 · +20.2%
- By 2075
- 4,831,599 · +31.4%
- By 2100
- 4,832,502 · +31.4%
Race, ethnicity, and origin ACS 2023
- Neighborhood character
- Diverse neighborhood (Simpson 0.64)
- Race & ethnicity
- White 50% Hispanic / Latino 31% Two or more races 18% Black 7% Asian 6%
- Hispanic origin (detail)
- Mexican 24% Puerto Rican 1%
- Common ancestry
- Lithuanian 2% Italian 2% Slovak 2%
- Foreign-born
- 16% · Canada, Vietnam, Jamaica
- Languages at home
- 70% English-only · Spanish 22% Russian/Polish/Slavic 1% Tagalog/Filipino 1%
Political lean MEDSL · San Diego
- 2024 margin
- D (+16.8) · D 56.9% · R 40.1% · Other 2.9%
- 2008→2024 swing
- +6.6pp toward D · 2008: 10.2pp · 2024: 16.8pp
- All cycles
- 2024: D+16.8 2020: D+22.8 2016: D+17.8 2012: D+5.1 2008: D+10.2
Not yet ingested
- Civics
- —
Market trends
- HPI YoY
- ▼ -970.97%
- Current HPI
- 397.3028
- Rent YoY
- ▲ 1.38%
- Metro
- San Diego-Chula Vista-Carlsbad, CA
- State GDP YoY
- ▲ 3.21%
- F500 in state
- 116
Industry mix (Fortune 500 HQ in CA)
| Industry | F500 HQs | Revenue |
|---|---|---|
| Technology | 27 | $1,492B |
|
||
| Financial Services | 3 | $174B |
|
||
| Retail | 3 | $44B |
|
||
| Insurance | 3 | $26B |
|
||
| Media / Entertainment | 2 | $115B |
|
||
| Pharmaceuticals / Biotech | 2 | $62B |
|
||
Price history
+4756.3% since first listed16 events — show timeline
- 2026-04-07 Price Changed $4,225,000 SDMLS
- 2026-03-25 Price Changed $4,250,000 SDMLS
- 2026-03-06 Price Changed $4,275,000 SDMLS
- 2026-02-11 Listed $4,295,000 SDMLS
- 2025-11-06 Listing Removed — SDMLS
- 2025-10-01 Price Changed $4,295,000 SDMLS
- 2025-09-17 Price Changed $4,345,000 SDMLS
- 2025-08-15 Relisted — SDMLS
- 2025-08-14 Listing Removed — SDMLS
- 2025-08-12 Price Changed $4,370,000 SDMLS
- 2025-07-01 Price Changed $4,395,000 SDMLS
- 2025-05-12 Listed $4,450,000 SDMLS
- 2024-02-23 Sold (Public Records) $2,175,000 Public Records
- 2024-02-23 Sold (MLS) $2,175,000 SDMLS
- 2024-01-23 Listed $2,100,000 SDMLS
- 1985-05-09 Sold (Public Records) $87,000 Public Records
Property tax history
+13.2%/yrLatest (2025): $27,948 · +56.5% YoY. Source: county tax records.
Cash-flow waterfall
monthlySold comps — $/sqft
last 12 mo · ≤1 miLoading sold comps…