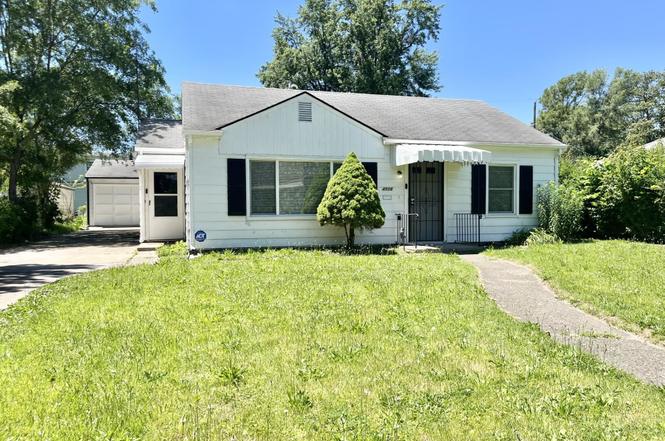
4506 S Colonial Ave · Fort Wayne, IN
Flood risk 1/10 · Minimal
- FEMA flood zone
- X (unshaded)
- Chance of flooding over 30 yrs
- 0.0%
- Est. flood insurance / yr
- $507 – $1,088
Fire risk 1/10 · Minimal
- Est. fire insurance / yr
- $717 – $1,331
Heat risk 3/10 · Minor
- Hot days now (above 100°F)
- 7 days/yr
- Hot days in 30 yrs
- 16 days/yr
Wind risk 2/10 · Minimal
- Chance of severe wind over 30 yrs
- —
Air-quality risk 3/10 · Minor
- Unhealthy air days now
- 2 days/yr
- Unhealthy air days in 30 yrs
- 3 days/yr
Risk factors via First Street. Map © Google.
Why this score? — see what drove the D+ grade
The composite is a weighted blend of 9 inputs, each scored 0–100. Each bar is that input's sub-score; the figure is the points it added to the 100-point composite (weight × sub-score).
- Cash flow +12.6/30.0
- ARV discount +12.5/15.0
- Livability +4.2/5.0
- DSCR +3.8/10.0
- Rent growth +3.7/5.0
- Schools +3.6/10.0
- 1% rule +2.7/10.0
- Condition / age +2.5/5.0
- Appreciation +0.0/10.0
$154,900
🖨 Deal sheet 📄 Offer letter ✓ Due diligence
Listing remarks MLS
THIS HOME FEATURES AN UPDATED EFFICIENT FURNACE AND CENTRAL AIR IN 2021. UPDATED PVC SANITARY SEWER LINE AND INSULATED ATTIC. THE FAMILY ROOM COULD BE USED AS A SPACIOUS 4TH BEDROOM BECAUSE IT HAS A DOUBLE DOOR CLOSET IN IT. SCHOOLS: SOUTHWICK ELEMENTARY PK-2, PRINCE CHAPMAN 3-6, PAUL HARDING 7-8 AND THEN NEW HAVEN HIGH SCHOOL OR POTENTIAL SCHOOL CHOICE FOR HIGH SCHOOL WITHIN EAC SCHOOL SYSTEM.
Key facts
- Updated gas range
- Interior paint
- Insulated attic
Tags
Property features AI
Finance
- HOA & community: Community sidewalks
Exterior
- Parking: Detached garage; One garage space; Concrete off-street parking
- Security: Smoke detector(s)
- Utilities: Public water; Public sewer
- Home design: Single-family residence (site-built); Single-story; Entry level on main floor; Facing direction not specified
- Construction: Aluminum siding; Asphalt roof; Slab foundation; Built as site-built home
- Exterior features: Level lot; Public maintained asphalt road access; No fencing; Sidewalks in the community
Interior
- Kitchen: Gas cooktop; Gas range; Exhaust fan
- Bedrooms: Total of 7 rooms (bedroom count not specified)
- Flooring: Vinyl flooring
- Bathrooms: Two full bathrooms, both on the main level
- Heating & cooling: Central air conditioning; Natural gas heating; Forced air heating; Floor furnace
- Interior features: Laminate counters; Insulated windows with blinds; One fireplace (none of the typical fireplace features listed)
- Laundry & utility: Washer hookup; Electric dryer hookup; Washer and dryer included; Main-level laundry
Neighborhood map
What this means for you Summary
Snapshot
- This is a 3-bed/2.0-bath single-family listed at $155k.
Deal economics
- At list price, monthly cash flow is $-20 ($-236/yr) — negative.
- To cash-flow at today's rent, offer at most $151k (2.2% below list).
- To meet the 1% rule (rent ≥ 1% of price), the offer needs to be $119k (23.1% below list).
- Recommended offer: $119k (23.1% below list) — sets the bar for 1% rule.
- Cap rate 6.1% vs local median 4.8% in Fort Wayne — meaningfully above typical; check what's discounted (condition, days-on-market, listing class) to confirm the premium yield is real.
Location & tenants
- Location reads 84/100 on livability (#6 in IN, #676 nationally) — a professional / high-income tenant draw. Strengths: amenities A+, commute A+, cost of living A+; Watch: crime C-, employment D+.
- East Allen County Schools (suburban): math 36% / reading 47% proficiency, ranked #122 of 301 in IN (top 40%) — families likely to look elsewhere, expect single-tenant / working-renter base with shorter leases.
- Zoned schools: Southwick Elementary School (606 students, 89% FRL); New Haven Jr/Sr High School (math 21% / reading 50%, grade F, #263 of 369 statewide, top 72%, 1,494 students, 67% FRL) — zoned schools average 78% FRL vs 43% district-wide (35 pts higher); higher-poverty schools than district average — tighter screening recommended.
- Market conditions: Rents rising fast (+4.9%/yr); 129 active listings in the ZIP; 14 comparable units currently listed for rent nearby; rentals at typical pace (median 14d on market — plan ~3-4 weeks tenant-placement turnaround); 1,861 units permitted in Allen County in 2024 (576 in 5+ unit buildings).
Forward outlook
- Local home prices are declining (-3.0%/yr); year-one equity from $1k of loan paydown is wiped out by about $5k of value loss. Plan a longer hold.
- Allen County population projected at +10% by 2050 — modest demand growth; plan on rents tracking national, not racing it.
Negotiation context
- Only 3 days on market — expect competitive offers; lowballing is unlikely to land.
- 2 sale attempts since 3y ago with the ask held roughly flat each time — persistent listings suggest the price (not the market) is what's stuck; bring a comps-based counter.
- Current owner paid $119k; 30% above their basis — modest negotiation headroom, anchor on the comps not their cost.
Risks & watch-outs
- Watch-outs: built in 1948 — expect roof / HVAC / electrical / plumbing capex.
Questions for the listing agent
- What do current leases actually rent for vs. the listed asking? Can we see a recent rent roll and the last 12 months of T-12 income?
- Built in 1948 — when were the roof, HVAC, electrical panel, plumbing, and water heater last replaced?
- Is there a deadline driving the sale (1031 exchange, divorce, estate, relocation)? That informs how much negotiation room exists.
- Schools are D-rated, which usually means shorter tenancies and higher turnover. Who's the typical renter profile here, and what's been the actual vacancy rate?
- The area grade is low — what's the realistic commute time and amenity access for the typical tenant pool here? Any planned neighborhood developments (good or bad) we should know about?
- What's the average days-on-market for RENTAL listings here right now (not sales)? A rising rental-DOM trend means longer vacancies and softer asking-rent achievability than the comps imply.
- What's the recent tenant-quality profile in this submarket — average credit score on applications, eviction rate, late-payment / NSF rate, and stable-employment percentage? A property-management company in the area should have these aggregated.
- How much new for-sale + rental construction is in the pipeline within 1–3 miles? Heavy new supply typically softens prices + rents 12–24 months out; constrained supply supports both.
Investment metrics
- 1% rule
- 0.77% ✗
- Cap rate
- 6.14%
- Cash-on-cash
- -0.54%
- DSCR
- 0.98
- GRM
- 10.8
CMA / ARV
- ARV (on-the-fly)
- $174,460
- Comps found
- 12
Show comp detail 12 sales within ~0.75 mi
| Address | Dist | Beds/Ba | Sqft | Sold | Price | $/sf | Match |
|---|---|---|---|---|---|---|---|
| 4926 Plaza Dr | 0.26mi | 3/2.0 | 1,315 (-8%) | 1mo | $229,900 | $175 | 74 |
| 2924 Schaper Dr | 0.52mi | 3/1.5 | 1,500 (+5%) | 7mo | $142,000 | $95 | 59 |
| 4310 Lillie St | 0.40mi | 3/1.0 | 1,290 (-10%) | 6mo | $120,000 | $93 | 56 |
| 4032 Abbott St | 0.41mi | 3/2.0 | 1,636 (+14%) | 3mo | $90,000 | $55 | 55 |
| 4816 Hessen Cassel Rd | 0.65mi | 4/2.0 (+1) | 1,500 (+5%) | 4mo | $185,000 | $123 | 53 |
| 5006 Hessen Cassel Rd | 0.69mi | 3/1.5 | 1,344 (-6%) | 5mo | $195,000 | $145 | 51 |
| 3212 Clermont Ave | 0.70mi | 3/1.5 | 1,350 (-6%) | 6mo | $199,900 | $148 | 50 |
| 4765 Bowser Ave | 0.51mi | 4/2.0 (+1) | 1,287 (-10%) | 5mo | $165,000 | $128 | 50 |
| 5505 Standish Dr | 0.52mi | 3/1.5 | 1,610 (+13%) | 3mo | $186,500 | $116 | 50 |
| 4523 Bowser Ave | 0.52mi | 3/2.0 | 1,225 (-14%) | 6mo | $150,000 | $122 | 47 |
| 3534 Autumn Ln | 0.74mi | 3/2.0 | 1,560 (+9%) | 8mo | $150,000 | $96 | 44 |
| 3728 Reed St | 0.74mi | 4/1.0 (+1) | 1,272 (-11%) | 8mo | $58,000 | $46 | 32 |
Match score weights: distance 35% · size 25% · config 20% · recency 20%. Top-matched comps best support the ARV.
Projected returns pro-forma
-3.0% appreciation · 4.93% rent growth · sell at horizon
- IRR
- -15.3%
- Equity multiple
- 0.45×
- Total profit
- $-24,048
- Equity at exit
- $23,096
- IRR
- -4.1%
- Equity multiple
- 0.71×
- Total profit
- $-12,697
- Equity at exit
- $13,393
Cash invested: $43,372 (down + closing). Projections, not guarantees.
Landlord ↔ Tenant lean methodology
- Overall (STATE)
- 90 Strongly Landlord-Friendly
- State Indiana
- 90 Strongly Landlord-Friendly · R+11
- County
- — inherits STATE
- City
- — inherits STATE
ZIP-level market 46806
- Home prices YoY
- -33.6%
- Rents YoY
- 4.9%
- Active inventory
- 129
- Price-to-rent
- 10.8×
Monthly cashflow live
- Estimated rent
- $1,191 high interval (Pro) →
- Mortgage (P&I)
- −$812
- Tax from tax record
- −$84 /mo · $1,002/yr
- Insurance
- −$65
- HOA
- −$0
- Vacancy / Maint / Mgmt
- −$250
- Net cashflow
- $-20
Break-even live
UW: 25.0% down · 7.5% · 30yr · 1.5% tax · 5.0% vac · 8.0% maint · 8.0% mgmt
Financing live
Cash to close
- Down payment
- $38,725
- Closing costs
- $4,647
- Reserves months
- —
- Total cash needed
- —
Loan-product check · same deal, 3 products live
Conventional
25% down · 7.5% · 30yr
- Down + closing
- —
- Monthly P&I
- —
- Monthly cashflow
- —
- DSCR
- —
- Eligible?
- —
Personal DTI + credit; lowest rate.
DSCR
20% down · 8.5% · 30yr
- Down + closing
- —
- Monthly P&I
- —
- Monthly cashflow
- —
- DSCR
- —
- Eligible?
- —
No personal income docs; deal must DSCR.
Hard money
10% down · 12.0% · 12mo
- Down + closing
- —
- Monthly P&I
- —
- Monthly cashflow
- —
- DSCR
- —
- Eligible?
- —
Short-term bridge; refi at stabilization.
Rent comps 14 comps
| Address | Beds | Baths | Sqft | Rent | $/sqft | DOM | Units | Dist |
|---|---|---|---|---|---|---|---|---|
| 4705 S Anthony Blvd Fort Wayne, IN | 3.0 | 1.0 | 1110 | $1,050 | $0.95 | 14d | 1 | 0.20mi |
| 4325 Werling Dr Fort Wayne, IN | 1.0–3.0 | 1.0–2.0 | 923 | $1,164 | $1.26 | 44d | 1 | 0.25mi |
| 4014 Oliver St Fort Wayne, IN | 3.0 | 1.0 | 936 | $1,050 | $1.12 | 14d | 1 | 0.79mi |
| 4405 S Park Dr Fort Wayne, IN | 2.0 | 1.0 | 1440 | $1,175 | $0.82 | 14d | 1 | 0.84mi |
| 3410 S Anthony Blvd Fort Wayne, IN | 3.0 | 1.0 | 900 | $1,200 | $1.33 | 44d | 1 | 0.87mi |
| 2754 E Paulding Rd Fort Wayne, IN | 1.0–3.0 | 1.0–2.5 | 997 | $1,089 | $1.09 | 14d | 14 | 0.90mi |
| 1023 Hamilton Ave Fort Wayne, IN | 3.0 | 1.0 | 1152 | $1,075 | $0.93 | 14d | 1 | 1.01mi |
| 3702 Trace Cir Fort Wayne, IN | 2.0–4.0 | 2.0 | 1571 | $1,903 | $1.21 | 44d | 6 | 1.04mi |
| 3009 Holton Ave Fort Wayne, IN | 3.0 | 1.0 | 1212 | $1,400 | $1.16 | 14d | 1 | 1.16mi |
| 2903 Queen St Fort Wayne, IN | 3.0 | 2.0 | 1460 | $1,200 | $0.82 | 44d | 1 | 1.22mi |
| 4133 Lafayette St Fort Wayne, IN | 4.0 | 2.0 | 1640 | $1,400 | $0.85 | 21d | 1 | 1.26mi |
| 2720 Queen St Fort Wayne, IN | 3.0 | 2.0 | 1316 | $1,395 | $1.06 | 14d | 1 | 1.29mi |
| 1024 Colerick St Fort Wayne, IN | 4.0 | 1.0 | 1388 | $1,065 | $0.77 | 21d | 1 | 1.30mi |
| 3801 Lafayette St Fort Wayne, IN | 2.0 | 1.0 | 1116 | $995 | $0.89 | 14d | 1 | 1.36mi |
Listing history 5 events
-
2026-06-16remarks 589-char remark
-
2026-06-15statusdays on market $154,900 Pending 3 DOM
-
2026-06-14days on market $154,900 Active 2 DOM
-
2026-06-13remarks 588-char remark
-
2026-06-13$154,900 Active 1 DOM
ⓘ Source: listings_history table (triggers on properties + properties_extension) + one-shot
backfill from property_details.listing_events for pre-trigger history.
Tax reassessment forecast IN · Partial reset (capped growth)
- Current annual tax
- $1,002 · $84/mo
- Projected year-2 tax
- $1,159 · $97/mo
- Expected delta
- +$157/yr (+$13/mo · 15.7%)
ⓘ Screening estimate from a state-policy table — verify with the county assessor before closing.
Climate risk First Street
- Flood 1/10 Low FEMA zone X (unshaded) · 0% chance over 30 yrs
- Wildfire 1/10 Low
- Heat 3/10 Moderate 7 d/yr ≥100°F today · 16 d/yr by 30 yrs out
- Wind 2/10 Low
- Air quality 3/10 Moderate 2 unhealthy d/yr today · 3 by 30 yrs out
Nearby sold comps map
Loading sold comps map…
Walkable amenities ~0.75 mi
Loading nearby amenities…
Taxation est. · year 1
- Rental income
- $14,289
- − Mortgage interest
- −$8,677
- − Property taxes
- −$1,002
- − Insurance
- −$774
- − Repairs & maintenance
- −$1,143
- − Management
- −$1,143
- − Depreciation
- −$4,506
- Taxable loss
- −$2,957
- Est. tax savings @ 24.0%
- +$710
- After-tax cash flow
- $473/yr
For passive investors: Depreciation is non-cash, so a rental often shows a tax loss while cash-flowing — sheltering income. Rental losses are passive: they offset passive income freely, and up to $25,000/yr can offset ordinary (W-2) income if you actively participate and your MAGI is under $100k (phasing out to $0 by $150k); unused losses carry forward. On sale, claimed depreciation is recaptured at up to 25%, and gains may owe capital-gains tax (a 1031 exchange can defer both). Figures are a year-1 estimate at your 24.0% rate — not tax advice; consult a CPA.
Schools (NCES district)
- District
- East Allen County Schools
- NCES district ID
- 1802850
- Math proficiency
- 36% ▼ -8.00%
- Reading proficiency
- 47% ▼ -4.00%
- Median HH income
- $50,524
- Composite
- 35.75/100
- National rank
- #4849
- State rank
- #122 of 301 in IN
Livability — Fort Wayne
- Score
- 84/100
- State rank
- #6
- US rank
- #676
Category grades
Schools grade is shown separately in the Schools card above.
Census & demographics
- Census place
- Fort Wayne, IN
- County
- Allen County · 326,813 people
- City population
- 326,813
- Metro
- Fort Wayne, IN
- Population (ZIP)
- 26,425
- Household income
- $47,895
- Rent vs Own
- Severe rent burden
- 1184.0
Population outlook (Allen County) Hauer SSP2
- Today (2025)
- 394,020 people
- By 2030
- 405,128 · +2.8%
- By 2040
- 423,476 · +7.5%
- By 2050
- 435,137 · +10.4%
- By 2075
- 450,293 · +14.3%
- By 2100
- 424,101 · +7.6%
Race, ethnicity, and origin ACS 2023
- Neighborhood character
- Highly diverse neighborhood (Simpson 0.74)
- Race & ethnicity
- Black 37% Hispanic / Latino 26% White 21% Asian 12% Two or more races 11% Native American 2%
- Hispanic origin (detail)
- Mexican 18% Puerto Rican 1%
- Common ancestry
- Italian 1% Romanian 1% Lithuanian 1%
- Foreign-born
- 19% · Canada, Philippines, South Korea
- Languages at home
- 71% English-only · Spanish 19% Other Asian/Pacific 9%
Political lean MEDSL · Allen
- 2024 margin
- R (+12.5) · D 42.9% · R 55.4% · Other 1.7%
- 2008→2024 swing
- -8.1pp toward R · 2008: -4.3pp · 2024: -12.5pp
- All cycles
- 2024: R+12.5 2020: R+11.2 2016: R+19.6 2012: R+16.8 2008: R+4.3
Not yet ingested
- Civics
- —
Market trends
- HPI YoY
- ▼ -148.00%
- Current HPI
- 291.8198
- Rent YoY
- ▲ 4.93%
- Metro
- Fort Wayne, IN
- State GDP YoY
- ▲ 2.90%
- F500 in state
- 18
Industry mix (Fortune 500 HQ in IN)
| Industry | F500 HQs | Revenue |
|---|---|---|
| Industrial Machinery | 2 | $37B |
|
||
| Healthcare | 1 | $177B |
|
||
| Pharmaceuticals | 1 | $45B |
|
||
| Metals / Steel | 1 | $18B |
|
||
| Agriculture | 1 | $17B |
|
||
| Packaging | 1 | $12B |
|
||
Price history
+30.3% since first listed4 events — show timeline
- 2026-06-11 Listed $154,900 IRMLS
- 2023-06-06 Sold (MLS) $118,900 IRMLS
- 2023-05-04 Pending — IRMLS
- 2023-05-02 Listed $118,900 IRMLS
Property tax history
+3.8%/yrLatest (2024): $1,002 · +271.5% YoY. Source: county tax records.
Cash-flow waterfall
monthlySold comps — $/sqft
last 12 mo · ≤1 miLoading sold comps…