4833 Esedra Ct #201 · Greenacres, FL
Flood risk 1/10 · Minimal
- FEMA flood zone
- X (unshaded)
- Chance of flooding over 30 yrs
- 0.0%
- Est. flood insurance / yr
- $507 – $1,088
Fire risk 3/10 · Minor
- Est. fire insurance / yr
- $947 – $1,759
Heat risk 10/10 · Severe
- Hot days now (above 106°F)
- 7 days/yr
- Hot days in 30 yrs
- 26 days/yr
Wind risk 10/10 · Severe
- Chance of severe wind over 30 yrs
- 99.0%
Air-quality risk 2/10 · Minimal
- Unhealthy air days now
- 0 days/yr
- Unhealthy air days in 30 yrs
- 2 days/yr
Risk factors via First Street. Map © Google.
Why this score? — see what drove the C+ grade
The composite is a weighted blend of 9 inputs, each scored 0–100. Each bar is that input's sub-score; the figure is the points it added to the 100-point composite (weight × sub-score).
- Cash flow +25.6/30.0
- 1% rule +10.0/10.0
- DSCR +8.5/10.0
- ARV discount +7.5/15.0
- Schools +4.3/10.0
- Livability +3.5/5.0
- Condition / age +2.5/5.0
- Rent growth +2.4/5.0
- Appreciation +0.0/10.0
$125,000
🖨 Deal sheet (PDF) 📄 Offer letter ✓ Due diligence
Listing remarks MLS
COMPLETELY RENOVATED CONVERTIBLE EVERTHING NEW TOP OF THE LINE APPLIANCES MOVE IN WITH YOUR FURNITURE NOTHING ELSE NEED BE DONE SEE FOR YOURSELF-MANNED GATES-MANDATORY MEMBERSHIP IN COUNTRY CLUB REQUIRED
Key facts
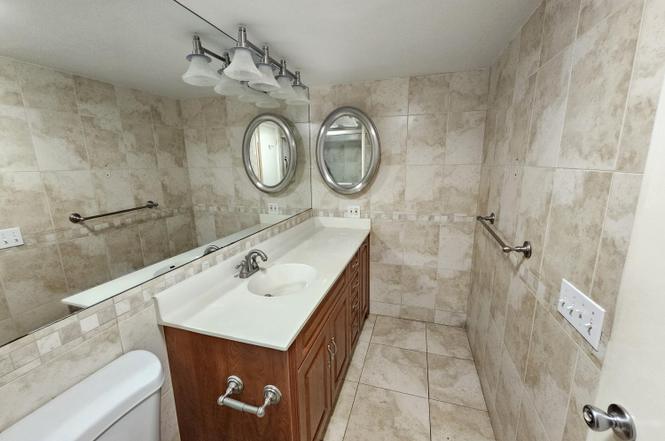
- Updated bathrooms
- Open den
- Plenty of cabinetry
Tags
Property features AI
Finance
- Other: Senior community; Pets not allowed
- HOA & community: Monthly HOA fee; Community pool; HOA covers insurance, sewer, water and common areas
Exterior
- Parking: Assigned parking; Guest parking
- Security: Gated community with guard
- Utilities: No utilities listed
- Home design: Condominium; 3-story building; Faces northeast; Resale condition
- Construction: Constructed with CBS and other materials
- Exterior features: Gated community with guard; No waterfront
Interior
- Bedrooms: 2 bedrooms on the main level
- Flooring: Carpet flooring
- Bathrooms: 2 full bathrooms (both on the main level)
- Heating & cooling: Heating present (other); Central air; Ceiling fans
- Interior features: Split bedroom layout; Unfurnished
- Laundry & utility: Laundry closet inside unit with washer and dryer hookups
Neighborhood map
What this means for you Summary
Snapshot
- This is a 3-bed/2.0-bath condo listed at $125k.
Deal economics
- At list price, monthly cash flow is $296 ($4k/yr) — positive.
- The deal already cash-flows at list — no discount required.
- Meets the 1% rule at list price ($3k rent vs $125k).
- Recommended offer: $110k (12.0% below list) — sets the bar for market timing.
Location & tenants
- Location reads 69/100 on livability (#490 in FL) — a middle-class / working-renter tenant base. Strengths: cost of living A+, housing A+, health & safety A; Watch: employment D, amenities F, commute F.
- Palm Beach (suburban): math 46% / reading 53% proficiency, ranked #34 of 73 in FL (top 47%) — families likely to look elsewhere, expect single-tenant / working-renter base with shorter leases.
- Zoned schools: Heritage Elementary School (math 35% / reading 39%, grade F, #1,609 of 2,144 statewide, top 77%, 786 students, 75% FRL); Woodlands Middle School (math 51% / reading 58%, grade B-, #183 of 571 statewide, top 34%, 1,551 students, 40% FRL); Santaluces Community High (math 22% / reading 39%, grade F, #434 of 667 statewide, top 66%, 2,675 students, 61% FRL).
- Market conditions: Rents soft (-0.4%/yr); 666 active listings in the ZIP; 40 comparable units currently listed for rent nearby; rentals at typical pace (median 26d on market — plan ~3-4 weeks tenant-placement turnaround); solid renter incomes; 3,974 units permitted in Palm Beach County in 2024 (1,012 in 5+ unit buildings).
- This rent runs 32% of the median local income ($96k/yr) — at the standard rent-burdened threshold; future hikes will face affordability resistance.
Forward outlook
- Local home prices are declining (-3.0%/yr); year-one equity from $864 of loan paydown is wiped out by about $4k of value loss. Plan a longer hold.
- Palm Beach County population projected at +30% by 2050 — long-run rental-demand tailwind backs the buy-and-hold thesis.
Negotiation context
- It's been on market 280 days — a 12% lower offer ($110k) is reasonable based on typical stale-listing flexibility.
- 3 sale attempts since 21y ago; this cycle's ask has dropped $55k (31%) from the opening price — seller is motivated, your offer sets the floor, not the list.
Risks & watch-outs
- Watch-outs: HOA is 38% of rent.
- Climate carrying-cost: severe wind risk, 99% chance of damaging wind over 30y; extreme-heat days projected 7→26/yr by 2055 (HVAC capex compounding) — expect insurance premiums to compound above CPI over the hold.
Questions for the listing agent
- It's been on market 280 days. Have you received any prior offers? Is the seller open to a 12% concession, seller financing, or rate buy-down credit?
- Built in 1973 — when were the roof, HVAC, electrical panel, plumbing, and water heater last replaced?
- What does the HOA fee cover, when was the last increase, and are there any pending special assessments or reserve-fund shortfalls?
- Any open or pending special assessments — roof, HVAC, plumbing, elevator, façade? What's the per-unit balance and payoff schedule, and is the seller paying it off at close or rolling it to the buyer?
- Why hasn't it sold? Are there any deal-killer items the seller is aware of (foundation, flood, title, zoning, code violations)?
- Is there a deadline driving the sale (1031 exchange, divorce, estate, relocation)? That informs how much negotiation room exists.
- Schools are D-rated, which usually means shorter tenancies and higher turnover. Who's the typical renter profile here, and what's been the actual vacancy rate?
- What's the average days-on-market for RENTAL listings here right now (not sales)? A rising rental-DOM trend means longer vacancies and softer asking-rent achievability than the comps imply.
- What's the recent tenant-quality profile in this submarket — average credit score on applications, eviction rate, late-payment / NSF rate, and stable-employment percentage? A property-management company in the area should have these aggregated.
- How much new apartment / multifamily construction is in the pipeline within 1–3 miles? Heavy new supply (>2% of stock underway) typically softens rents 12–24 months out; light construction supports rent growth.
Investment metrics
- 1% rule
- 2.02% ✓
- Cap rate
- 9.14%
- Cash-on-cash
- 10.15%
- DSCR
- 1.45
- GRM
- 4.1
CMA / ARV
No comps found within radius.
Projected returns pro-forma
-3.0% appreciation · 0.0% rent growth · sell at horizon
- IRR
- -6.7%
- Equity multiple
- 0.76×
- Total profit
- $-8,240
- Equity at exit
- $18,638
- IRR
- -5.3%
- Equity multiple
- 0.74×
- Total profit
- $-9,235
- Equity at exit
- $10,808
Cash invested: $35,000 (down + closing). Projections, not guarantees.
Landlord ↔ Tenant lean methodology
- Overall (STATE)
- 87 Strongly Landlord-Friendly
- State Florida
- 87 Strongly Landlord-Friendly · R+3
- County
- — inherits STATE
- City
- — inherits STATE
ZIP-level market 33467
- Rents YoY
- -0.4%
- Active inventory
- 666
- Price-to-rent
- 4.1×
Monthly cashflow live
- Estimated rent
- $2,524 high interval (Pro) →
- Mortgage (P&I)
- −$656
- Tax from tax record
- −$41 /mo · $491/yr
- Insurance
- −$52
- HOA
- −$949
- Vacancy / Maint / Mgmt
- −$530
- Net cashflow
- $296
Break-even live
Sensitivity live
| Price | -10% $367 | -5% $332 | +0% $296 | +5% $261 | +10% $225 |
|---|---|---|---|---|---|
| Rent | -10% $97 | -5% $196 | +0% $296 | +5% $396 | +10% $495 |
| Rate | -1.0pp $359 | -0.5pp $328 | base $296 | +0.5pp $264 | +1.0pp $231 |
UW: 25.0% down · 7.5% · 30yr · 1.5% tax · 5.0% vac · 8.0% maint · 8.0% mgmt
Financing live
Cash to close
- Down payment
- $31,250
- Closing costs
- $3,750
- Reserves months
- —
- Total cash needed
- —
Loan-product check · same deal, 3 products live
Conventional
25% down · 7.5% · 30yr
- Down + closing
- —
- Monthly P&I
- —
- Monthly cashflow
- —
- DSCR
- —
- Eligible?
- —
Personal DTI + credit; lowest rate.
DSCR
20% down · 8.5% · 30yr
- Down + closing
- —
- Monthly P&I
- —
- Monthly cashflow
- —
- DSCR
- —
- Eligible?
- —
No personal income docs; deal must DSCR.
Hard money
10% down · 12.0% · 12mo
- Down + closing
- —
- Monthly P&I
- —
- Monthly cashflow
- —
- DSCR
- —
- Eligible?
- —
Short-term bridge; refi at stabilization.
Rent comps 40 comps
| Address | Beds | Baths | Sqft | Rent | $/sqft | DOM | Units | Dist |
|---|---|---|---|---|---|---|---|---|
| 4832 Esedra Ct Lake Worth, FL | 1.0–3.0 | 1.0–2.0 | 1026 | $1,800 | $1.75 | 4d | 2 | 0.04mi |
| 4832 Esedra Ct #203 Lake Worth, FL | 3.0 | 2.0 | 1225 | $1,800 | $1.47 | 26d | 1 | 0.04mi |
| 4801 Esedra Ct Lake Worth, FL | 2.0 | 2.0 | 1027 | $2,075 | $2.02 | 12d | 2 | 0.10mi |
| 4801 Esedra Ct #201 Lake Worth, FL | 2.0 | 2.0 | 1005 | $2,300 | $2.29 | 26d | 1 | 0.10mi |
| 6909 Harbours Edge Ave Unit 6909 Greenacres, FL | 3.0 | 2.5 | 1695 | $3,000 | $1.77 | 9d | 1 | 0.20mi |
| 6909 Harbours Edge Ave Unit 6909 Greenacres, FL | 3.0 | 2.5 | 1695 | $3,000 | $1.77 | 26d | 1 | 0.20mi |
| 4266 Deste Ct #107 Greenacres, FL | 2.0 | 2.0 | 978 | $2,100 | $2.15 | 26d | 1 | 0.20mi |
| 4702 Fountains Dr S #207 Lake Worth, FL | 2.0 | 2.5 | 1434 | $2,600 | $1.81 | 26d | 1 | 0.21mi |
| 4702 Fountains Dr S #207 Lake Worth, FL | 2.0 | 2.5 | 1434 | $2,600 | $1.81 | 3d | 1 | 0.21mi |
| 443 Pine Glen Ln Unit B2 Greenacres, FL | 2.0 | 2.0 | 922 | $1,500 | $1.63 | 26d | 1 | 0.21mi |
| 441 Pine Glen Ln Unit A1 Greenacres, FL | 2.0 | 1.0 | 1700 | $1,600 | $0.94 | 26d | 1 | 0.24mi |
| 407 Pine Cir Unit C1 Greenacres, FL | 2.0 | 2.0 | 922 | $1,800 | $1.95 | 26d | 1 | 0.29mi |
| 407 Pine Cir Unit B1 Greenacres, FL | 2.0 | 2.0 | 922 | $1,750 | $1.90 | 26d | 1 | 0.29mi |
| 4242 Deste Ct Unit 208 Greenacres, FL | 2.0 | 2.0 | 978 | $2,500 | $2.56 | 26d | 1 | 0.29mi |
| 1204 Timberlane Cir Unit 12D Greenacres, FL | 3.0 | 2.0 | 1332 | $2,800 | $2.10 | 5d | 1 | 0.29mi |
| 4770 Fountains Dr S #303 Lake Worth, FL | 2.0 | 2.0 | 1434 | $2,200 | $1.53 | 4d | 1 | 0.34mi |
| 6615 Waterfront Xing Lake Worth, FL | 1.0–3.0 | 1.0–2.0 | 1087 | $3,604 | $3.31 | 1d | 23 | 0.37mi |
| 4535 Oak Terrace Dr Greenacres, FL | 3.0 | 2.0 | 1061 | $2,400 | $2.26 | 14d | 1 | 0.38mi |
| 4535 Oak Terrace Dr Greenacres, FL | 3.0 | 2.0 | 1061 | $2,500 | $2.36 | 17d | 1 | 0.38mi |
| 417 Pine Glen Ln Unit D2 Greenacres, FL | 2.0 | 2.0 | 922 | $1,550 | $1.68 | 26d | 1 | 0.39mi |
| 417 Pine Glen Ln Unit C2 Greenacres, FL | 2.0 | 2.0 | 922 | $1,800 | $1.95 | 26d | 1 | 0.39mi |
| 4360 Fountains Dr Lake Worth, FL | 3.0 | 3.0 | 1600 | $2,750 | $1.72 | 26d | 1 | 0.42mi |
| 4539 Luxemburg Ct Lake Worth, FL | 2.0 | 2.0 | 1027 | $2,250 | $2.19 | 7d | 1 | 0.42mi |
| 4539 Luxemburg Ct Lake Worth, FL | 2.0 | 2.0 | 1005 | $2,250 | $2.24 | 26d | 1 | 0.42mi |
| 4228 Deste Ct Greenacres, FL | 3.0 | 2.5 | 1497 | $3,000 | $2.00 | 20d | 1 | 0.43mi |
| 4557 Luxemburg Ct Lake Worth, FL | 2.0 | 1.5 | 1065 | $2,400 | $2.25 | 26d | 1 | 0.44mi |
| 5172 Fountains Dr S Lake Worth, FL | 2.0 | 2.0 | 1591 | $2,400 | $1.51 | 26d | 1 | 0.45mi |
| 4489 Luxemburg Ct #101 Lake Worth, FL | 2.0 | 2.0 | 1005 | $2,000 | $1.99 | 26d | 1 | 0.45mi |
| 4245 Oak Terrace Dr Greenacres, FL | 2.0 | 2.0 | 883 | $2,000 | $2.27 | 26d | 1 | 0.45mi |
| 4243 Oak Terrace Dr #4243 Greenacres, FL | 2.0 | 2.0 | 883 | $1,950 | $2.21 | 26d | 1 | 0.45mi |
| 4259 Oak Terrace Dr Unit 2 Greenacres, FL | 2.0 | 2.0 | 1400 | $2,000 | $1.43 | 26d | 1 | 0.46mi |
| 4259 Oak Terrace Dr Greenacres, FL | 2.0 | 2.0 | 883 | $1,900 | $2.15 | 26d | 1 | 0.46mi |
| 4471 Luxemburg Ct #101 Lake Worth, FL | 2.0 | 2.0 | 1005 | $2,300 | $2.29 | 20d | 1 | 0.46mi |
| 4471 Luxemburg Ct Lake Worth, FL | 2.0 | 2.0 | 1005 | $2,150 | $2.14 | 26d | 2 | 0.46mi |
| 4483 Luxemburg Ct #201 Lake Worth, FL | 3.0 | 2.0 | 1265 | $2,800 | $2.21 | 26d | 1 | 0.46mi |
| 4469 Luxemburg Ct Lake Worth, FL | 3.0 | 2.5 | 1502 | $3,400 | $2.26 | 26d | 1 | 0.47mi |
| 4345 Trevi Ct #204 Lake Worth, FL | 2.0 | 2.0 | 1005 | $2,100 | $2.09 | 22d | 1 | 0.48mi |
| 4416 Hammock Grove Dr Lake Worth, FL | 4.0 | 2.5 | 1750 | $3,600 | $2.06 | 26d | 1 | 0.48mi |
| 4221 Oak Terrace Dr Greenacres, FL | 2.0 | 2.0 | 883 | $1,900 | $2.15 | 26d | 1 | 0.48mi |
| 4185 Oak Terrace Dr Unit 21 Greenacres, FL | 2.0 | 2.0 | 1400 | $2,000 | $1.43 | 26d | 1 | 0.50mi |
HOA detail condo
- Monthly dues
- $949 · $11,388/yr
- Assessments
- None detected in remarks — confirm with the listing agent.
Listing history 14 events
-
2026-05-05status Pending
-
2026-04-23price $125,000
-
2026-03-28price $130,000
-
2026-03-20price $140,000
-
2026-02-19price $145,000
-
2026-01-23price $150,000
-
2025-12-30status Active
-
2025-12-29status Pending
-
2025-12-12price $171,000
-
2025-07-27$180,000 Active
-
2005-11-04soldstatus $190,000 203-char remark
Show marketing remark (203 chars)
COMPLETELY RENOVATED CONVERTIBLE EVERTHING NEW TOP OF THE LINE APPLIANCES MOVE IN WITH YOUR FURNITURE NOTHING ELSE NEED BE DONE SEE FOR YOURSELF-MANNED GATES-MANDATORY MEMBERSHIP IN COUNTRY CLUB REQUIRED
-
2005-08-22historical 203-char remark
Show marketing remark (203 chars)
COMPLETELY RENOVATED CONVERTIBLE EVERTHING NEW TOP OF THE LINE APPLIANCES MOVE IN WITH YOUR FURNITURE NOTHING ELSE NEED BE DONE SEE FOR YOURSELF-MANNED GATES-MANDATORY MEMBERSHIP IN COUNTRY CLUB REQUIRED
-
2005-07-15$199,900 203-char remark
Show marketing remark (203 chars)
COMPLETELY RENOVATED CONVERTIBLE EVERTHING NEW TOP OF THE LINE APPLIANCES MOVE IN WITH YOUR FURNITURE NOTHING ELSE NEED BE DONE SEE FOR YOURSELF-MANNED GATES-MANDATORY MEMBERSHIP IN COUNTRY CLUB REQUIRED
-
1974-01-01soldstatus $38,000
ⓘ Source: listings_history table (triggers on properties + properties_extension) + one-shot
backfill from property_details.listing_events for pre-trigger history.
Tax reassessment forecast FL · Resets to sale price
- Current annual tax
- $491 · $41/mo
- Projected year-2 tax
- $1,038 · $86/mo
- Expected delta
- +$547/yr (+$46/mo · 111.4%)
ⓘ Screening estimate from a state-policy table — verify with the county assessor before closing.
Climate risk First Street
- Flood 1/10 Low FEMA zone X (unshaded) · 0% chance over 30 yrs
- Wildfire 3/10 Moderate
- Heat 10/10 Extreme 7 d/yr ≥106°F today · 26 d/yr by 30 yrs out
- Wind 10/10 Extreme 99% chance of damaging wind over 30 yrs
- Air quality 2/10 Low 0 unhealthy d/yr today · 2 by 30 yrs out
Nearby sold comps map
Loading sold comps map…
Walkable amenities ~0.75 mi
Loading nearby amenities…
Taxation est. · year 1
- Rental income
- $30,283
- − Mortgage interest
- −$7,002
- − Property taxes
- −$491
- − Insurance
- −$625
- − Repairs & maintenance
- −$2,423
- − Management
- −$2,423
- − HOA
- −$11,388
- − Depreciation
- −$3,636
- Taxable income
- $2,295
- Est. tax owed @ 24.0%
- −$551
- After-tax cash flow
- $3,003/yr
For passive investors: Depreciation is non-cash, so a rental often shows a tax loss while cash-flowing — sheltering income. Rental losses are passive: they offset passive income freely, and up to $25,000/yr can offset ordinary (W-2) income if you actively participate and your MAGI is under $100k (phasing out to $0 by $150k); unused losses carry forward. On sale, claimed depreciation is recaptured at up to 25%, and gains may owe capital-gains tax (a 1031 exchange can defer both). Figures are a year-1 estimate at your 24.0% rate — not tax advice; consult a CPA.
Schools (NCES district)
- District
- Palm Beach
- NCES district ID
- 1201500
- Math proficiency
- 46% ▼ -16.00%
- Reading proficiency
- 53% ▼ -4.00%
- Median HH income
- $53,943
- Composite
- 42.72/100
- National rank
- #3160
- State rank
- #34 of 73 in FL
Livability — Greenacres
- Score
- 69/100
- State rank
- #490
- US rank
- #9008
Category grades
Schools grade is shown separately in the Schools card above.
Census & demographics
- County
- Palm Beach County · 1,438,312 people
- City population
- 65,478
- Metro
- Miami-Fort Lauderdale-Pompano Beach, FL
- Population (ZIP)
- 58,411
- Household income
- $95,739
- Rent vs Own
- Severe rent burden
- 960.0
Population outlook (Palm Beach County) Hauer SSP2
- Today (2025)
- 1,637,487 people
- By 2030
- 1,743,255 · +6.5%
- By 2040
- 1,948,712 · +19.0%
- By 2050
- 2,132,979 · +30.3%
- By 2075
- 2,530,027 · +54.5%
- By 2100
- 2,706,979 · +65.3%
Race, ethnicity, and origin ACS 2023
- Neighborhood character
- Diverse neighborhood (Simpson 0.59)
- Race & ethnicity
- White 59% Hispanic / Latino 22% Two or more races 13% Black 10% Asian 4%
- Hispanic origin (detail)
- Mexican 2% Puerto Rican 4% Cuban 4% Dominican 2%
- Common ancestry
- Romanian 4% Scotch-Irish 3% Hispanic 3%
- Foreign-born
- 24% · Canada, Jamaica, Vietnam
- Languages at home
- 71% English-only · Spanish 17% French/Haitian/Cajun 5% Other Indo-European 3%
Political lean MEDSL · Palm Beach
- 2024 margin
- Toss-up / Even · D 50.0% · R 49.2%
- 2008→2024 swing
- -22.1pp toward R · 2008: 22.9pp · 2024: 0.8pp
- All cycles
- 2024: D+0.8 2020: D+12.8 2016: D+15.3 2012: D+17.0 2008: D+22.9
Not yet ingested
- Civics
- —
Market trends
- HPI YoY
- ▼ -288.94%
- Current HPI
- 343.7738
- Rent YoY
- ▼ -0.40%
- Metro
- Miami-Fort Lauderdale-Pompano Beach, FL
- State GDP YoY
- ▲ 3.28%
- F500 in state
- 36
Industry mix (Fortune 500 HQ in FL)
| Industry | F500 HQs | Revenue |
|---|---|---|
| Industrial Technology | 2 | $29B |
|
||
| Insurance | 2 | $17B |
|
||
| Retail | 1 | $60B |
|
||
| Technology Distribution | 1 | $58B |
|
||
| Homebuilding | 1 | $35B |
|
||
| Technology Manufacturing | 1 | $35B |
|
||
Price history
+228.9% since first listed14 events — show timeline
- 2026-05-05 Pending — Beaches MLS
- 2026-04-23 Price Changed $125,000 Beaches MLS
- 2026-03-28 Price Changed $130,000 Beaches MLS
- 2026-03-20 Price Changed $140,000 Beaches MLS
- 2026-02-19 Price Changed $145,000 Beaches MLS
- 2026-01-23 Price Changed $150,000 Beaches MLS
- 2025-12-30 Relisted — Beaches MLS
- 2025-12-29 Pending — Beaches MLS
- 2025-12-12 Price Changed $171,000 Beaches MLS
- 2025-07-27 Listed $180,000 Beaches MLS
- 2005-11-04 Sold (MLS) $190,000 Beaches MLS
- 2005-08-22 Listing Removed — Beaches MLS
- 2005-07-15 Listed $199,900 Beaches MLS
- 1974-01-01 Sold (Public Records) $38,000 Public Records
Property tax history
+1.7%/yrLatest (2025): $491 · +5.9% YoY. Source: county tax records.
Cash-flow waterfall
monthlySold comps — $/sqft
last 12 mo · ≤1 miLoading sold comps…