 Duplex
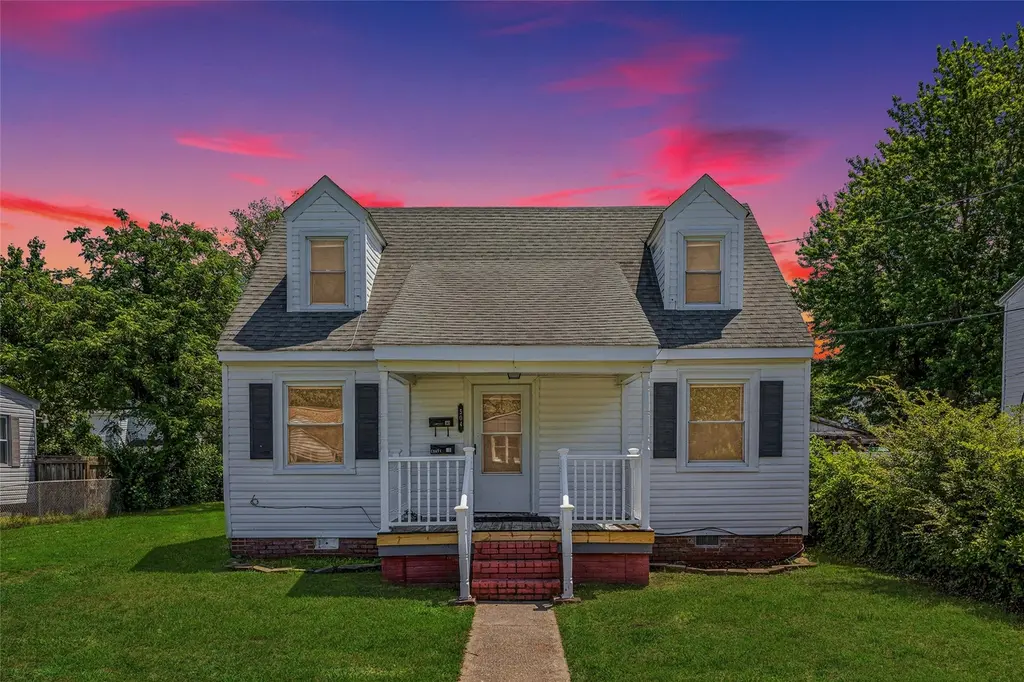
504 Highland Ave · Hampton, VA
Flood risk 3/10 · Minor
- FEMA flood zone
- X (unshaded)
- Chance of flooding over 30 yrs
- 0.12%
- Est. flood insurance / yr
- $473 – $860
Fire risk 1/10 · Minimal
- Est. fire insurance / yr
- $666 – $1,236
Heat risk 9/10 · Severe
- Hot days now (above 105°F)
- 7 days/yr
- Hot days in 30 yrs
- 16 days/yr
Wind risk 8/10 · Major
- Chance of severe wind over 30 yrs
- 80.0%
Air-quality risk 2/10 · Minimal
- Unhealthy air days now
- 1 days/yr
- Unhealthy air days in 30 yrs
- 1 days/yr
Risk factors via First Street. Map © Google.
Why this score? — see what drove the B grade
The composite is a weighted blend of 9 inputs, each scored 0–100. Each bar is that input's sub-score; the figure is the points it added to the 100-point composite (weight × sub-score).
- Cash flow +29.3/30.0
- DSCR +10.0/10.0
- 1% rule +7.6/10.0
- ARV discount +7.5/15.0
- Schools +5.5/10.0
- Rent growth +5.0/5.0
- Livability +3.8/5.0
- Condition / age +2.5/5.0
- Appreciation +0.0/10.0
$255,000
🖨 Deal sheet (PDF) 📄 Offer letter ✓ Due diligence
Multi-family units
County records classify this as Multi-Family (2-4 Unit). Listing-text estimate: 2 units. confirmed
Listing remarks MLS
House hack opportunity in the heart of Hampton! Welcome to 504 Highland Avenue, a charming duplex full of potential just minutes from downtown Hampton, Langley Air Force Base, I-64, shopping, dining, and the waterfront. Built in 1941, this property blends character, flexibility, and opportunity all in one. Live comfortably in the spacious first-floor unit offering approximately 900 sq ft with 2 bedrooms and 1 bath while renting out the upstairs 1-bedroom, 1-bath unit for additional income. Both units are currently vacant, giving the next owner the chance to set market rents, offset their mortgage, or expand their investment portfolio. Whether you’re looking for your first home, a smart house hack, or a long-term rental property, this duplex offers endless potential in a growing Hampton market. Opportunities like this don’t come frequently!
Key facts
- Vacant units
- Investment portfolio
- Duplex
Tags
Property features AI
Finance
- Financial info: Unit 1 rent: $1,250 (year lease); Unit 2 rent: $1,000 (year lease)
Exterior
- Parking: Driveway; Street parking
- Utilities: Separate electric meters; City/County water; City/County sewer; Electric water heater
- Home design: Duplex; Over/Under style; Simple ownership; Entry level: Over/Under configuration
- Construction: Asphalt shingle roof; Crawl foundation
- Exterior features: Vinyl siding; Driveway and street parking (units 1 and 2)
Interior
- Kitchen: Unit 1: Dishwasher, Electric range, Refrigerator, Disposal; Unit 2: Electric range
- Bedrooms: Unit 1: 2 bedrooms (1st floor master); Unit 2: 1 bedroom
- Flooring: Carpet (units 1 and 3)
- Bathrooms: Unit 1: 1 bath; Unit 2: 1 bath
- Heating & cooling: Electric heating and heat pump (units 1 and 2); Central air with heat pump (units 1 and 2)
- Interior features: Window treatments
- Laundry & utility: Unit 1: Washer hookup, Dryer hookup, Utility room; Unit 2: Utility closet
Neighborhood map
What this means for you Summary
Snapshot
- This is a 2 × 3-bed/2.0-bath units multifamily listed at $255k.
Deal economics
- At list price, monthly cash flow is $893 ($11k/yr) — positive. Per door: $446/mo.
- The deal already cash-flows at list — no discount required.
- Meets the 1% rule at list price ($3k rent vs $255k).
- Cap rate 10.5% vs local median 4.5% in Hampton — top-decile yield for the area; either an underpriced asset or a hidden risk that comps aren't pricing in. Stress-test before assuming the spread holds.
Location & tenants
- Location reads 75/100 on livability (#133 in VA, #4,302 nationally) — a middle-class / working-renter tenant base. Strengths: housing A+, health & safety A+, cost of living A; Watch: crime C-, amenities D+, commute F.
- Hampton City Public School District (urban): math 60% / reading 70% proficiency, ranked #40 of 131 in VA (top 30%) — acceptable for families but not a draw, mixed tenant base, ~2y average lease.
- Zoned schools: Hunter B. Andrews (math 65% / reading 72%, grade B+, #357 of 1,108 statewide, top 33%, 1,131 students, 81% FRL); Hampton High (math 60% / reading 75%, grade B, #183 of 319 statewide, top 58%, 1,359 students, 86% FRL) — zoned schools average 84% FRL vs 49% district-wide (35 pts higher); higher-poverty schools than district average — tighter screening recommended.
- Market conditions: Rents rising fast (+21.4%/yr); 124 active listings in the ZIP; 26 comparable units currently listed for rent nearby; rentals at typical pace (median 25d on market — plan ~3-4 weeks tenant-placement turnaround); 42% of comp listings sitting > 30 days — soft ceiling on asking rent; 68 units permitted in Hampton city in 2024 (0 in 5+ unit buildings).
- At $3,211/mo this rent would consume 59% of the median local household income ($65k/yr) (locally 704% of renters already pay >50% of income on rent) — very limited rent-growth headroom before tenants either downsize or default.
Forward outlook
- Local home prices are declining (-3.0%/yr); year-one equity from $2k of loan paydown is wiped out by about $8k of value loss. Plan a longer hold.
- Hampton County population projected at -13% by 2050 — secular population decline; favor cash flow + early exit over multi-decade hold.
- At projected returns (-3.0% appreciation + 8.0% rent growth), your $71k cash investment doubles in ~6 years — after that, you're playing with house money.
Negotiation context
- Only 10 days on market — expect competitive offers; lowballing is unlikely to land.
- 5 sale attempts since 5y ago with the ask held roughly flat each time — persistent listings suggest the price (not the market) is what's stuck; bring a comps-based counter.
- Current owner paid $190k; 34% above their basis — modest negotiation headroom, anchor on the comps not their cost.
Risks & watch-outs
- Watch-outs: built in 1941 — expect roof / HVAC / electrical / plumbing capex.
- Climate carrying-cost: severe wind risk, 80% chance of damaging wind over 30y; extreme-heat days projected 7→16/yr by 2055 (HVAC capex compounding) — expect insurance premiums to compound above CPI over the hold.
Questions for the listing agent
- Can we see the unit-by-unit rent roll, current vacancy, and any below-market leases? What's the average tenancy length?
- What capital expenditures (roof, boiler, parking lot, exteriors) have been made in the last 5 years, and what's planned in the next 2?
- Built in 1941 — when were the roof, HVAC, electrical panel, plumbing, and water heater last replaced?
- Is there a deadline driving the sale (1031 exchange, divorce, estate, relocation)? That informs how much negotiation room exists.
- Schools are B-rated — typically a magnet for longer-tenancy family renters. What's the average tenant stay here, and is there a school-zone premium baked into asking?
- What's the average days-on-market for RENTAL listings here right now (not sales)? A rising rental-DOM trend means longer vacancies and softer asking-rent achievability than the comps imply.
- What's the recent tenant-quality profile in this submarket — average credit score on applications, eviction rate, late-payment / NSF rate, and stable-employment percentage? A property-management company in the area should have these aggregated.
- How much new apartment / multifamily construction is in the pipeline within 1–3 miles? Heavy new supply (>2% of stock underway) typically softens rents 12–24 months out; light construction supports rent growth.
Investment metrics
- 1% rule
- 1.26% ✓
- Cap rate
- 10.49%
- Cash-on-cash
- 15.00%
- DSCR
- 1.67
- GRM
- 6.6
CMA / ARV
No comps found within radius.
Projected returns pro-forma
-3.0% appreciation · 8.0% rent growth · sell at horizon
- IRR
- 10.9%
- Equity multiple
- 1.45×
- Total profit
- $32,483
- Equity at exit
- $38,021
- IRR
- 23.5%
- Equity multiple
- 3.50×
- Total profit
- $178,638
- Equity at exit
- $22,048
Cash invested: $71,400 (down + closing). Projections, not guarantees.
Landlord ↔ Tenant lean methodology
- Overall (STATE)
- 55 Moderately Landlord-Leaning
- State Virginia
- 55 Moderately Landlord-Leaning · D+2
- County
- — inherits STATE
- City
- — inherits STATE
ZIP-level market 23661
- Home prices YoY
- -16.7%
- Rents YoY
- 21.4%
- Active inventory
- 124
- Price-to-rent
- 13.2×
Monthly cashflow live
- Estimated rent
- $3,211 medium interval (Pro) →
- Mortgage (P&I)
- −$1,337
- Tax from tax record
- −$200 /mo · $2,405/yr
- Insurance
- −$106
- HOA
- −$0
- Vacancy / Maint / Mgmt
- −$674
- Net cashflow
- $893
Break-even live
Sensitivity live
| Price | -10% $1,037 | -5% $965 | +0% $893 | +5% $821 | +10% $748 |
|---|---|---|---|---|---|
| Rent | -10% $639 | -5% $766 | +0% $893 | +5% $1,020 | +10% $1,146 |
| Rate | -1.0pp $1,021 | -0.5pp $958 | base $893 | +0.5pp $827 | +1.0pp $759 |
2-unit breakdown (identical units grouped — click to expand)
| Units | Beds | Baths | Est. rent |
|---|---|---|---|
| 2× units | 3 | 2 | $3,210 |
| #1 | 3 | 2 | $1,605 |
| #2 | 3 | 2 | $1,605 |
| Total (2 units) | $3,211 | ||
UW: 25.0% down · 7.5% · 30yr · 1.5% tax · 5.0% vac · 8.0% maint · 8.0% mgmt
Financing live
Cash to close
- Down payment
- $63,750
- Closing costs
- $7,650
- Reserves months
- —
- Total cash needed
- —
Loan-product check · same deal, 3 products live
Conventional
25% down · 7.5% · 30yr
- Down + closing
- —
- Monthly P&I
- —
- Monthly cashflow
- —
- DSCR
- —
- Eligible?
- —
Personal DTI + credit; lowest rate.
DSCR
20% down · 8.5% · 30yr
- Down + closing
- —
- Monthly P&I
- —
- Monthly cashflow
- —
- DSCR
- —
- Eligible?
- —
No personal income docs; deal must DSCR.
Hard money
10% down · 12.0% · 12mo
- Down + closing
- —
- Monthly P&I
- —
- Monthly cashflow
- —
- DSCR
- —
- Eligible?
- —
Short-term bridge; refi at stabilization.
Rent comps 26 comps
| Address | Beds | Baths | Sqft | Rent | $/sqft | DOM | Units | Dist |
|---|---|---|---|---|---|---|---|---|
| 507 Highland Ave Hampton, VA | 2.0 | 1.0 | 925 | $1,500 | $1.62 | 16d | 1 | 0.06mi |
| 534 Brightwood Ave Hampton, VA | 3.0 | 3.0 | 1528 | $2,095 | $1.37 | 45d | 1 | 0.20mi |
| 708 Westwood Ave Hampton, VA | 3.0 | 2.5 | 1300 | $2,300 | $1.77 | 16d | 1 | 0.24mi |
| 702 Rutherford St Hampton, VA | 3.0 | 2.0 | 1445 | $1,795 | $1.24 | 25d | 1 | 0.38mi |
| 310 Lasalle Ave Hampton, VA | 3.0 | 2.0 | 1858 | $2,200 | $1.18 | 45d | 1 | 0.38mi |
| 607 Lee St Hampton, VA | 3.0 | 1.5 | 1404 | $2,150 | $1.53 | 45d | 1 | 0.55mi |
| 626 Chapel St Hampton, VA | 4.0 | 2.0 | 1470 | $1,900 | $1.29 | 14d | 1 | 0.61mi |
| 3750 Kecoughtan Rd Hampton, VA | 2.0 | 1.5 | 1300 | $1,600 | $1.23 | 45d | 1 | 0.67mi |
| 901 W Queen St Hampton, VA | 2.0–3.0 | 1.5–2.5 | 1096 | $1,600 | $1.46 | 45d | 1 | 0.71mi |
| 448 Chapel St Hampton, VA | 3.0 | 2.0 | 1425 | $1,850 | $1.30 | 4d | 1 | 0.74mi |
| 1625 W Pembroke Ave Hampton, VA | 2.0 | 1.5 | 950 | $1,250 | $1.32 | 25d | 1 | 0.78mi |
| 1625 W Pembroke Ave Unit 7 Hampton, VA | 2.0 | 1.5 | 950 | $1,250 | $1.32 | 45d | 1 | 0.79mi |
| 63 Algonquin Rd Hampton, VA | 2.0 | 1.0 | 1100 | $1,495 | $1.36 | 45d | 1 | 0.87mi |
| 236 Pocahontas Pl Hampton, VA | 2.0 | 1.0 | 1262 | $1,795 | $1.42 | 3d | 1 | 1.08mi |
| 640 Rolfe St Hampton, VA | 3.0 | 2.0 | 1100 | $2,000 | $1.82 | 45d | 1 | 1.10mi |
| 130 Pocahontas Pl Hampton, VA | 3.0 | 1.0 | 1415 | $1,695 | $1.20 | 45d | 1 | 1.14mi |
| 27 Capps Qtrs #1 Hampton, VA | 3.0 | 2.5 | 1734 | $2,200 | $1.27 | 45d | 1 | 1.23mi |
| 101 Prince James Dr Hampton, VA | 3.0 | 1.0 | 1766 | $1,645 | $0.93 | 16d | 1 | 1.23mi |
| 2113 Victoria Blvd Hampton, VA | 3.0 | 1.0 | 1005 | $1,595 | $1.59 | 45d | 1 | 1.28mi |
| 100 Chesterfield Rd Hampton, VA | 3.0 | 1.5 | 1742 | $2,200 | $1.26 | 5d | 1 | 1.28mi |
| 1943 Kecoughtan Rd Hampton, VA | 2.0 | 1.0 | 900 | $1,150 | $1.28 | 5d | 1 | 1.38mi |
| 1943 Kecoughtan Rd Unit G Hampton, VA | 2.0 | 1.0 | 900 | $1,150 | $1.28 | 13d | 1 | 1.38mi |
| 316 Fountain Way Hampton, VA | 3.0 | 2.5 | 1850 | $2,600 | $1.41 | 18d | 1 | 1.40mi |
| 613 Delaware Ave Hampton, VA | 3.0 | 2.0 | 1082 | $1,900 | $1.76 | 4d | 1 | 1.41mi |
| 624 Pennsylvania Ave Hampton, VA | 3.0 | 1.0 | 912 | $1,600 | $1.75 | 25d | 1 | 1.42mi |
| 600 Freeman Dr Hampton, VA | 1.0–2.0 | 1.0–2.0 | 892 | $2,008 | $2.25 | 3d | 8 | 1.49mi |
Listing history 6 events
-
2026-06-08statusdays on market $255,000 Under Contract 10 DOM
-
2026-06-07days on market $255,000 Active 9 DOM
-
2026-06-03days on market $255,000 Active 5 DOM
-
2026-06-02days on market $255,000 Active 4 DOM
-
2026-06-01days on market $255,000 Active 3 DOM
-
2026-05-31days on market $255,000 Active 2 DOM
ⓘ Source: listings_history table (triggers on properties + properties_extension) + one-shot
backfill from property_details.listing_events for pre-trigger history.
Tax reassessment forecast VA · Resets to sale price
- Current annual tax
- $2,405 · $200/mo
- Projected year-2 tax
- $2,405 · $200/mo
- Expected delta
- $0/yr ($0/mo · 0.0%)
ⓘ Screening estimate from a state-policy table — verify with the county assessor before closing.
Climate risk First Street
- Flood 3/10 Moderate FEMA zone X (unshaded) · 12% chance over 30 yrs
- Wildfire 1/10 Low
- Heat 9/10 Extreme 7 d/yr ≥105°F today · 16 d/yr by 30 yrs out
- Wind 8/10 Severe 80% chance of damaging wind over 30 yrs
- Air quality 2/10 Low 1 unhealthy d/yr today · 1 by 30 yrs out
Nearby sold comps map
Loading sold comps map…
Walkable amenities ~0.75 mi
Loading nearby amenities…
Taxation est. · year 1
- Rental income
- $38,532
- − Mortgage interest
- −$14,284
- − Property taxes
- −$2,405
- − Insurance
- −$1,275
- − Repairs & maintenance
- −$3,083
- − Management
- −$3,083
- − Depreciation
- −$7,418
- Taxable income
- $6,984
- Est. tax owed @ 24.0%
- −$1,676
- After-tax cash flow
- $9,037/yr
For passive investors: Depreciation is non-cash, so a rental often shows a tax loss while cash-flowing — sheltering income. Rental losses are passive: they offset passive income freely, and up to $25,000/yr can offset ordinary (W-2) income if you actively participate and your MAGI is under $100k (phasing out to $0 by $150k); unused losses carry forward. On sale, claimed depreciation is recaptured at up to 25%, and gains may owe capital-gains tax (a 1031 exchange can defer both). Figures are a year-1 estimate at your 24.0% rate — not tax advice; consult a CPA.
Schools (NCES district)
- District
- Hampton City Public School District
- NCES district ID
- 5101800
- Math proficiency
- 60% ▼ -21.00%
- Reading proficiency
- 70% ▼ -4.00%
- Median HH income
- $50,089
- Composite
- 55.19/100
- National rank
- #1272
- State rank
- #40 of 131 in VA
Livability — Hampton
- Score
- 75/100
- State rank
- #133
- US rank
- #4302
Category grades
Schools grade is shown separately in the Schools card above.
Census & demographics
- Census place
- Hampton, VA
- County
- Hampton City · 132,421 people
- City population
- 132,421
- Metro
- Virginia Beach-Norfolk-Newport News, VA-NC
- Population (ZIP)
- 14,005
- Household income
- $65,446
- Rent vs Own
- Severe rent burden
- 704.0
Population outlook (Hampton County) Hauer SSP2
- Today (2025)
- 134,055 people
- By 2030
- 131,753 · -1.7%
- By 2040
- 125,017 · -6.7%
- By 2050
- 116,825 · -12.9%
- By 2075
- 97,033 · -27.6%
- By 2100
- 76,188 · -43.2%
Race, ethnicity, and origin ACS 2023
- Neighborhood character
- Diverse neighborhood (Simpson 0.56)
- Race & ethnicity
- Black 59% White 31% Two or more races 6% Hispanic / Latino 4%
- Common ancestry
- Serbian 2% Italian 2% Romanian 1%
- Foreign-born
- 3% · Canada
- Languages at home
- 95% English-only · Spanish 2% French/Haitian/Cajun 1% Arabic 1%
Political lean MEDSL · Hampton
- 2024 margin
- Solid D (+39.9) · D 69.2% · R 29.4% · Other 1.4%
- 2008→2024 swing
- +1.0pp no change · 2008: 38.9pp · 2024: 39.9pp
- All cycles
- 2024: D+39.9 2020: D+42.2 2016: D+37.8 2012: D+45.4 2008: D+38.9
Not yet ingested
- Civics
- —
Market trends
- HPI YoY
- ▼ -54.95%
- Current HPI
- 274.2769
- Rent YoY
- ▲ 21.35%
- Metro
- Virginia Beach-Norfolk-Newport News, VA-NC
- State GDP YoY
- ▲ 2.40%
- F500 in state
- 50
Industry mix (Fortune 500 HQ in VA)
| Industry | F500 HQs | Revenue |
|---|---|---|
| Aerospace / Defense | 4 | $236B |
|
||
| Technology / Defense | 3 | $32B |
|
||
| Financial Services | 2 | $176B |
|
||
| Utilities | 2 | $27B |
|
||
| Insurance | 2 | $25B |
|
||
| Technology | 2 | $15B |
|
||
Price history
+240.0% since first listed16 events — show timeline
- 2026-05-29 Listed $255,000 WMLS
- 2026-05-21 Listed $255,000 REINMLS
- 2022-03-15 Sold (Public Records) $190,000 Public Records
- 2022-03-02 Pending — REINMLS
- 2022-02-28 Listed $199,900 REINMLS
- 2021-05-27 Pending — REINMLS
- 2021-05-27 Relisted — REINMLS
- 2021-05-27 Listing Removed — REINMLS
- 2021-05-17 Listing Removed — REINMLS
- 2021-05-10 Contingent — REINMLS
- 2021-05-03 Price Changed $159,900 REINMLS
- 2021-04-26 Price Changed $164,500 REINMLS
- 2021-04-22 Price Changed $174,500 REINMLS
- 2021-04-16 Listed $184,500 REINMLS
- 2006-06-07 Sold (Public Records) $153,000 Public Records
- 2005-07-13 Sold (Public Records) $75,000 Public Records
Property tax history
+8.3%/yrLatest (2025): $2,405 · +8.4% YoY. Source: county tax records.
Cash-flow waterfall
monthlySold comps — $/sqft
last 12 mo · ≤1 miLoading sold comps…