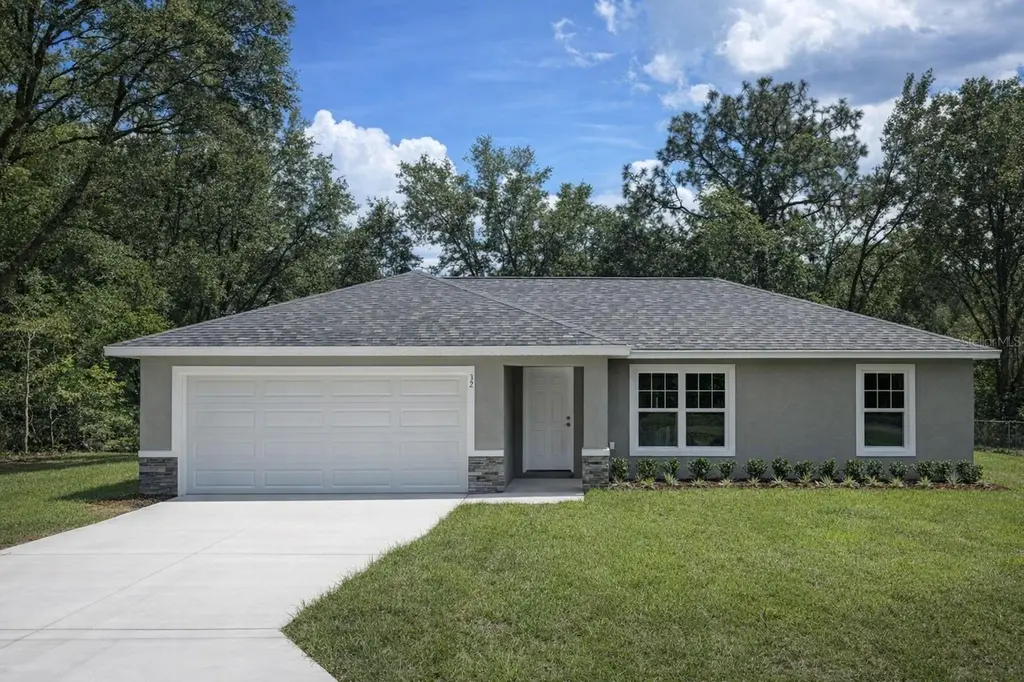
6772 Hemlock Rd · Silver Springs Shores, FL
Flood risk 5/10 · Moderate
- FEMA flood zone
- X (unshaded)
- Chance of flooding over 30 yrs
- 0.5%
- Est. flood insurance / yr
- $507 – $1,088
Fire risk 4/10 · Minor
- Est. fire insurance / yr
- $947 – $1,759
Heat risk 8/10 · Major
- Hot days now (above 108°F)
- 7 days/yr
- Hot days in 30 yrs
- 22 days/yr
Wind risk 9/10 · Severe
- Chance of severe wind over 30 yrs
- 99.0%
Air-quality risk 3/10 · Minor
- Unhealthy air days now
- 3 days/yr
- Unhealthy air days in 30 yrs
- 4 days/yr
Risk factors via First Street. Map © Google.
Why this score? — see what drove the F grade
The composite is a weighted blend of 9 inputs, each scored 0–100. Each bar is that input's sub-score; the figure is the points it added to the 100-point composite (weight × sub-score).
- Appreciation +8.0/10.0
- Cash flow +7.9/30.0
- Condition / age +4.2/5.0
- Schools +3.6/10.0
- Livability +3.4/5.0
- Rent growth +2.5/5.0
- 1% rule +2.4/10.0
- DSCR +1.9/10.0
- ARV discount +0.0/15.0
$235,000
🖨 Deal sheet (PDF) 📄 Offer letter ✓ Due diligence
Listing remarks
One or more photo(s) has been virtually staged. One or more photo(s) has been virtually staged. Situated on . 29 acres!! Welcome home to this charming new construction that’s light, bright, and move-in ready! This home features an open-concept layout with luxury vinyl plank flooring throughout, no carpet! The kitchen boasts elegant quartz countertops and white shaker cabinets. Enjoy your private backyard, perfect for relaxing or entertaining in a quite country setting. Builder’s warranty included for peace of mind. Conveniently located near Ocala and The Villages for easy access to shopping, dining, and entertainment
Key facts
- Quartz countertops
- New construction
- Private backyard
Tags
Property features AI
Finance
- Other: Property zoned R1; Builder license number 232659; Living area reported as 1,083 (builder source); total building area 1,531
- HOA & community: No association indicated
Exterior
- Parking: Attached 2-car garage (approximately 20 x 18)
- Utilities: Well water; Septic tank; Private utilities
- Home design: Single-family residence; One story; East-facing; New construction; Completed condition
- Construction: Block, concrete and stucco construction; Shingle roof; Slab foundation; Built by Aldana (model: Rachel)
- Exterior features: Sliding doors; Vinyl fencing; Paved road access; Lot approximately 0.3 acres (150 x 86)
Interior
- Kitchen: Dishwasher; Microwave; Range; Refrigerator; Stone (granite) countertops
- Bedrooms: 3 bedrooms (one-level home)
- Flooring: Granite; Tile
- Bathrooms: 2 full bathrooms
- Heating & cooling: Electric heating; Central air conditioning
- Interior features: Cathedral ceilings; Vaulted ceilings; High ceilings; Ceiling fans; Open floor plan; Split-bedroom layout; Stone counters; Thermostat
- Laundry & utility: Laundry area located in the garage
Neighborhood map
What this means for you Summary
Snapshot
- This is a 3-bed/2.0-bath single-family listed at $235k. Condition is rated good.
Deal economics
- At list price, monthly cash flow is $-254 ($-3k/yr) — negative.
- To cash-flow at today's rent, offer at most $198k (15.6% below list).
- To meet the 1% rule (rent ≥ 1% of price), the offer needs to be $173k (26.2% below list).
- Recommended offer: $173k (26.2% below list) — sets the bar for 1% rule.
Location & tenants
- Location reads 68/100 on livability (#527 in FL) — a middle-class / working-renter tenant base. Strengths: cost of living A+, housing A+, health & safety A-; Watch: crime C-, employment D, amenities F.
- Marion (rural): math 42% / reading 43% proficiency, ranked #61 of 73 in FL (top 84%) — families likely to look elsewhere, expect single-tenant / working-renter base with shorter leases; 61% free/reduced lunch — lower-income household profile, screen leases tightly.
- Zoned schools: Greenway Elementary School (math 33% / reading 35%, grade F, #1,744 of 2,144 statewide, top 82%, 736 students, 67% FRL); Fort King Middle School (math 37% / reading 35%, grade F, #410 of 571 statewide, top 72%, 1,092 students, 71% FRL); Forest High School (math 36% / reading 54%, grade D-, #228 of 667 statewide, top 35%, 2,325 students, 42% FRL) — zoned schools at 60% FRL track the district average.
- Market conditions: Rents flat; 683 active listings in the ZIP; 20 comparable units currently listed for rent nearby; rentals at typical pace (median 23d on market — plan ~3-4 weeks tenant-placement turnaround); 7,071 units permitted in Marion County in 2024 (534 in 5+ unit buildings).
- This rent runs 32% of the median local income ($64k/yr) — at the standard rent-burdened threshold; future hikes will face affordability resistance.
Forward outlook
- In year one you build about $16k of equity ($2k loan paydown + $14k appreciation (5.9% local appreciation)).
- Marion County population projected at +13% by 2050 — modest demand growth; plan on rents tracking national, not racing it.
- By year 3, paydown + projected appreciation supports a ~$39k cash-out refi (75% LTV) — recoverable capital for the next deal without selling this one.
Negotiation context
- Only 4 days on market — expect competitive offers; lowballing is unlikely to land.
Risks & watch-outs
- Climate carrying-cost: moderate flood risk; severe wind risk, 99% chance of damaging wind over 30y; extreme-heat days projected 7→22/yr by 2055 (HVAC capex compounding) — expect insurance premiums to compound above CPI over the hold.
Questions for the listing agent
- What do current leases actually rent for vs. the listed asking? Can we see a recent rent roll and the last 12 months of T-12 income?
- Is there a deadline driving the sale (1031 exchange, divorce, estate, relocation)? That informs how much negotiation room exists.
- Schools are F-rated, which usually means shorter tenancies and higher turnover. Who's the typical renter profile here, and what's been the actual vacancy rate?
- The area grade is low — what's the realistic commute time and amenity access for the typical tenant pool here? Any planned neighborhood developments (good or bad) we should know about?
- What's the average days-on-market for RENTAL listings here right now (not sales)? A rising rental-DOM trend means longer vacancies and softer asking-rent achievability than the comps imply.
- What's the recent tenant-quality profile in this submarket — average credit score on applications, eviction rate, late-payment / NSF rate, and stable-employment percentage? A property-management company in the area should have these aggregated.
- How much new for-sale + rental construction is in the pipeline within 1–3 miles? Heavy new supply typically softens prices + rents 12–24 months out; constrained supply supports both.
Investment metrics
- 1% rule
- 0.74% ✗
- Cap rate
- 5.00%
- Cash-on-cash
- -4.63%
- DSCR
- 0.79
- GRM
- 11.3
CMA / ARV
- ARV (on-the-fly)
- $186,276
- Comps found
- 5
Show comp detail 5 sales within ~0.75 mi
| Address | Dist | Beds/Ba | Sqft | Sold | Price | $/sf | Match |
|---|---|---|---|---|---|---|---|
| 18 Pine Court Loop | 0.29mi | 3/2.0 | 1,091 (+1%) | 6mo | $235,000 | $215 | 80 |
| 6915 SE 54th Ln | 0.30mi | 3/2.0 | 1,134 (+5%) | 18mo | $170,000 | $150 | 64 |
| 9 Hemlock Terrace Pass | 0.46mi | 3/2.0 | 1,153 (+6%) | 13mo | $243,000 | $211 | 57 |
| 8 Pecan Course Loop | 0.52mi | 3/2.0 | 1,221 (+13%) | 21mo | $210,000 | $172 | 37 |
| 8 Pecan Course Trce | 0.65mi | 3/2.0 | 1,231 (+14%) | 22mo | $185,000 | $150 | 29 |
Match score weights: distance 35% · size 25% · config 20% · recency 20%. Top-matched comps best support the ARV.
Projected returns pro-forma
5.93% appreciation · 0.17% rent growth · sell at horizon
- IRR
- 10.4%
- Equity multiple
- 1.70×
- Total profit
- $45,964
- Equity at exit
- $146,730
- IRR
- 10.8%
- Equity multiple
- 3.12×
- Total profit
- $139,481
- Equity at exit
- $265,228
Cash invested: $65,800 (down + closing). Projections, not guarantees.
Landlord ↔ Tenant lean methodology
- Overall (STATE)
- 87 Strongly Landlord-Friendly
- State Florida
- 87 Strongly Landlord-Friendly · R+3
- County
- — inherits STATE
- City
- — inherits STATE
ZIP-level market 34472
- Home prices YoY
- 2.4%
- Rents YoY
- 0.2%
- Active inventory
- 683
- Price-to-rent
- 11.3×
Monthly cashflow live
- Estimated rent
- $1,734 high interval (Pro) →
- Mortgage (P&I)
- −$1,232
- Tax est. 1.5%
- −$294 /mo · $3,525/yr
- Insurance
- −$98
- HOA
- −$0
- Vacancy / Maint / Mgmt
- −$364
- Net cashflow
- $-254
Break-even live
Sensitivity live
| Price | -10% $-91 | -5% $-173 | +0% $-254 | +5% $-335 | +10% $-416 |
|---|---|---|---|---|---|
| Rent | -10% $-391 | -5% $-322 | +0% $-254 | +5% $-185 | +10% $-117 |
| Rate | -1.0pp $-136 | -0.5pp $-194 | base $-254 | +0.5pp $-315 | +1.0pp $-377 |
UW: 25.0% down · 7.5% · 30yr · 1.5% tax · 5.0% vac · 8.0% maint · 8.0% mgmt
Financing live
Cash to close
- Down payment
- $58,750
- Closing costs
- $7,050
- Reserves months
- —
- Total cash needed
- —
Loan-product check · same deal, 3 products live
Conventional
25% down · 7.5% · 30yr
- Down + closing
- —
- Monthly P&I
- —
- Monthly cashflow
- —
- DSCR
- —
- Eligible?
- —
Personal DTI + credit; lowest rate.
DSCR
20% down · 8.5% · 30yr
- Down + closing
- —
- Monthly P&I
- —
- Monthly cashflow
- —
- DSCR
- —
- Eligible?
- —
No personal income docs; deal must DSCR.
Hard money
10% down · 12.0% · 12mo
- Down + closing
- —
- Monthly P&I
- —
- Monthly cashflow
- —
- DSCR
- —
- Eligible?
- —
Short-term bridge; refi at stabilization.
Rent comps 20 comps
| Address | Beds | Baths | Sqft | Rent | $/sqft | DOM | Units | Dist |
|---|---|---|---|---|---|---|---|---|
| 7044 Hemlock Crse Ocala, FL | 3.0 | 2.0 | 1270 | $1,897 | $1.49 | 15d | 1 | 0.40mi |
| 13 Redwood Trace Ln Ocala, FL | 3.0 | 2.0 | 1337 | $1,595 | $1.19 | 23d | 1 | 0.68mi |
| 7215 Midway Ter Ocala, FL | 2.0 | 2.0 | 975 | $1,175 | $1.21 | 23d | 1 | 0.75mi |
| 45 Redwood Run Ocala, FL | 3.0 | 2.0 | 1435 | $1,695 | $1.18 | 23d | 1 | 0.78mi |
| 492 Hickory Course Loop Ocala, FL | 4.0 | 2.0 | 1483 | $1,750 | $1.18 | 23d | 1 | 0.79mi |
| 98 Dogwood Drive Cir Ocala, FL | 3.0 | 2.0 | 1337 | $1,695 | $1.27 | 23d | 1 | 0.95mi |
| 6 Cedar Dr Ocala, FL | 3.0 | 2.0 | 1477 | $1,675 | $1.13 | 23d | 1 | 1.04mi |
| 308 Hickory Course Radl Ocala, FL | 3.0 | 2.0 | 1397 | $1,650 | $1.18 | 23d | 1 | 1.04mi |
| 5614 Pecan Rd Ocala, FL | 3.0 | 2.0 | 1337 | $1,595 | $1.19 | 23d | 1 | 1.05mi |
| 7455 Midway Ter Unit K Ocala, FL | 2.0 | 1.0 | 904 | $1,249 | $1.38 | 23d | 1 | 1.10mi |
| 57 Pine Cir Ocala, FL | 3.0 | 2.0 | 1270 | $1,897 | $1.49 | 15d | 1 | 1.13mi |
| 7184 Hemlock Loop Ocala, FL | 3.0 | 2.0 | 1392 | $1,675 | $1.20 | 23d | 1 | 1.13mi |
| 9 Dogwood Trail Dr Ocala, FL | 3.0 | 2.0 | 1110 | $1,595 | $1.44 | 23d | 1 | 1.14mi |
| 19 Pecan Pass Ter Ocala, FL | 3.0 | 2.0 | 1368 | $1,750 | $1.28 | 23d | 1 | 1.16mi |
| 43 Bahia Pass Ocala, FL | 3.0 | 2.0 | 1188 | $1,475 | $1.24 | 23d | 1 | 1.29mi |
| 96 Redwood Rd Ocala, FL | 3.0 | 2.0 | 1188 | $1,650 | $1.39 | 15d | 1 | 1.31mi |
| 106 Redwood Track Crse Ocala, FL | 3.0 | 2.0 | 1412 | $1,675 | $1.19 | 15d | 1 | 1.32mi |
| 36 Pecan Run Crse Ocala, FL | 3.0 | 2.0 | 1188 | $1,850 | $1.56 | 15d | 1 | 1.32mi |
| 21 Dogwood Drive Pass Ocala, FL | 3.0 | 2.0 | 1390 | $1,595 | $1.15 | 23d | 1 | 1.34mi |
| 162 Bahia Terrace Dr Ocala, FL | 2.0 | 2.0 | 984 | $1,375 | $1.40 | 23d | 1 | 1.38mi |
Listing history 2 events
-
2026-05-15status Pending
-
2026-05-11$235,000 Active
ⓘ Source: listings_history table (triggers on properties + properties_extension) + one-shot
backfill from property_details.listing_events for pre-trigger history.
Climate risk First Street
- Flood 5/10 Major FEMA zone X (unshaded) · 50% chance over 30 yrs
- Wildfire 4/10 Moderate
- Heat 8/10 Severe 7 d/yr ≥108°F today · 22 d/yr by 30 yrs out
- Wind 9/10 Extreme 99% chance of damaging wind over 30 yrs
- Air quality 3/10 Moderate 3 unhealthy d/yr today · 4 by 30 yrs out
Nearby sold comps map
Loading sold comps map…
Walkable amenities ~0.75 mi
Loading nearby amenities…
Taxation est. · year 1
- Rental income
- $20,813
- − Mortgage interest
- −$13,164
- − Property taxes
- −$3,525
- − Insurance
- −$1,175
- − Repairs & maintenance
- −$1,665
- − Management
- −$1,665
- − Depreciation
- −$6,836
- Taxable loss
- −$7,217
- Est. tax savings @ 24.0%
- +$1,732
- After-tax cash flow
- $-1,314/yr
For passive investors: Depreciation is non-cash, so a rental often shows a tax loss while cash-flowing — sheltering income. Rental losses are passive: they offset passive income freely, and up to $25,000/yr can offset ordinary (W-2) income if you actively participate and your MAGI is under $100k (phasing out to $0 by $150k); unused losses carry forward. On sale, claimed depreciation is recaptured at up to 25%, and gains may owe capital-gains tax (a 1031 exchange can defer both). Figures are a year-1 estimate at your 24.0% rate — not tax advice; consult a CPA.
Condition & rehab AI · 12 photos
This move-in ready home features an open-concept layout with luxury vinyl plank flooring and modern finishes, making it an excellent investment opportunity.
Value-add opportunities
- Both Paint exterior trim — Enhances curb appeal and value
- Both Install smart home devices — Improves convenience and marketability
- Both Add outdoor lighting — Enhances safety and curb appeal
Renovation cost estimate screening
Value-add ROI direction
- Both Paint exterior trim — Enhances curb appeal and value ↑
- Both Install smart home devices — Improves convenience and marketability ↑
- Both Add outdoor lighting — Enhances safety and curb appeal ↑
ⓘ Cost ranges are severity-bucket heuristics (US national rule-of-thumb). Get contractor quotes + a written scope before underwriting a rehab budget.
Schools (NCES district)
- District
- Marion
- NCES district ID
- 1201260
- Math proficiency
- 42% ▼ -7.00%
- Reading proficiency
- 43% ▼ -4.00%
- Median HH income
- $40,015
- Composite
- 35.61/100
- National rank
- #4890
- State rank
- #61 of 73 in FL
Livability — Silver Springs Shores
- Score
- 68/100
- State rank
- #527
- US rank
- #9854
Category grades
Schools grade is shown separately in the Schools card above.
Census & demographics
- Census place
- Silver Springs Shores, FL
- County
- Marion County · 315,796 people
- City population
- 34,665
- Metro
- Ocala, FL
- Population (ZIP)
- 35,851
- Household income
- $64,208
- Rent vs Own
- Severe rent burden
- 655.0
Population outlook (Marion County) Hauer SSP2
- Today (2025)
- 365,905 people
- By 2030
- 376,768 · +3.0%
- By 2040
- 396,555 · +8.4%
- By 2050
- 412,723 · +12.8%
- By 2075
- 446,090 · +21.9%
- By 2100
- 436,193 · +19.2%
Race, ethnicity, and origin ACS 2023
- Neighborhood character
- Diverse neighborhood (Simpson 0.65)
- Race & ethnicity
- White 50% Hispanic / Latino 25% Black 21% Two or more races 18% Asian 2%
- Hispanic origin (detail)
- Mexican 2% Puerto Rican 14% Cuban 3%
- Common ancestry
- Romanian 2% Iranian 1% Lithuanian 1%
- Foreign-born
- 11% · Canada, Jamaica, China
- Languages at home
- 78% English-only · Spanish 19% Other Indo-European 1%
Political lean MEDSL · Marion
- 2024 margin
- Solid R (+31.6) · D 33.8% · R 65.5%
- 2008→2024 swing
- -20.0pp toward R · 2008: -11.6pp · 2024: -31.6pp
- All cycles
- 2024: R+31.6 2020: R+25.9 2016: R+26.2 2012: R+16.2 2008: R+11.6
Not yet ingested
- Civics
- —
Market trends
- HPI YoY
- ▲ 5.93%
- Current HPI
- 255.0714
- Rent YoY
- ▲ 0.17%
- Metro
- Ocala, FL
- State GDP YoY
- ▲ 3.28%
- F500 in state
- 36
Industry mix (Fortune 500 HQ in FL)
| Industry | F500 HQs | Revenue |
|---|---|---|
| Industrial Technology | 2 | $29B |
|
||
| Insurance | 2 | $17B |
|
||
| Retail | 1 | $60B |
|
||
| Technology Distribution | 1 | $58B |
|
||
| Homebuilding | 1 | $35B |
|
||
| Technology Manufacturing | 1 | $35B |
|
||
Price history
2 events — show timeline
- 2026-05-15 Pending — Stellar MLS as Distributed by MLS Grid
- 2026-05-11 Listed $235,000 Stellar MLS as Distributed by MLS Grid
Cash-flow waterfall
monthlySold comps — $/sqft
last 12 mo · ≤1 miLoading sold comps…