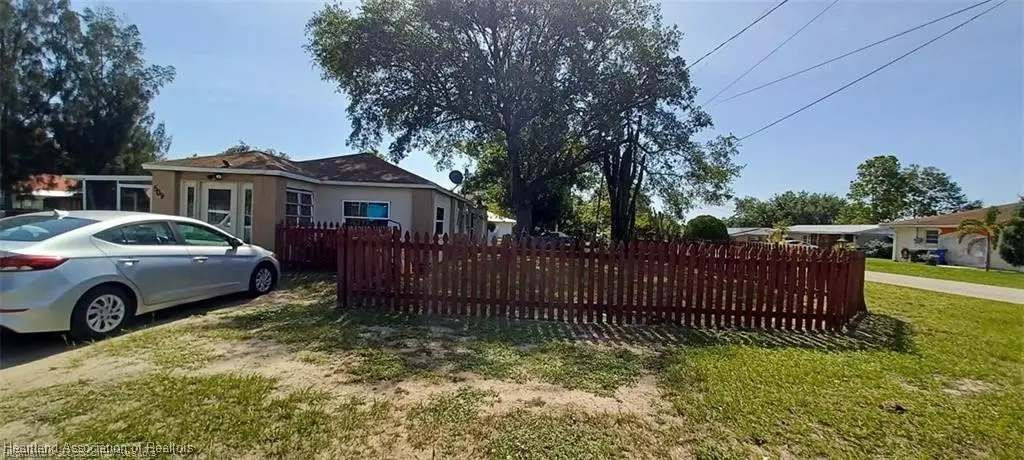
509 S Florida Ave · Avon Park, FL
Flood risk 1/10 · Minimal
- FEMA flood zone
- X (unshaded)
- Chance of flooding over 30 yrs
- 0.0%
- Est. flood insurance / yr
- $507 – $1,088
Fire risk 4/10 · Minor
- Est. fire insurance / yr
- $947 – $1,759
Heat risk 9/10 · Severe
- Hot days now (above 108°F)
- 7 days/yr
- Hot days in 30 yrs
- 25 days/yr
Wind risk 9/10 · Severe
- Chance of severe wind over 30 yrs
- 99.0%
Air-quality risk 2/10 · Minimal
- Unhealthy air days now
- 2 days/yr
- Unhealthy air days in 30 yrs
- 2 days/yr
Risk factors via First Street. Map © Google.
Why this score? — see what drove the B- grade
The composite is a weighted blend of 9 inputs, each scored 0–100. Each bar is that input's sub-score; the figure is the points it added to the 100-point composite (weight × sub-score).
- Cash flow +25.0/30.0
- ARV discount +15.0/15.0
- DSCR +8.2/10.0
- 1% rule +5.4/10.0
- Schools +3.6/10.0
- Livability +3.6/5.0
- Rent growth +2.5/5.0
- Condition / age +2.5/5.0
- Appreciation +0.0/10.0
$135,000
🖨 Deal sheet (PDF) 📄 Offer letter ✓ Due diligence
Listing remarks MLS
Good Investment Opportunity, great corner lot- almost 1/2 acre in Avon Park. 3 bedrooms, 2 baths, Sold As-Is. close to US Hwy 27, downtown, restaurants, schools etc. , this house needs TLC. , it will be a magnificent investment.
Key facts
- Close to us hwy 27
- Close to restaurants
- Close to schools
Tags
Property features AI
Finance
- Financial info: Pets allowed with no restrictions
Exterior
- Parking: Driveway
- Utilities: Public water; Public sewer; Electric with fuses
- Home design: Single-story; Faces south; Effective year built listed
- Construction: Block construction; Shingle roof
- Exterior features: Enclosed porch; Screened porch; Fence; Room for pool; Shed(s)
Interior
- Kitchen: Refrigerator
- Bedrooms: Bedroom 2 (12 x 10); Bedroom 3 (10 x 9)
- Flooring: Tile; Vinyl
- Bathrooms: 2 full bathrooms
- Heating & cooling: Wall/window cooling units
- Interior features: First floor entry; Bedroom on main level
- Laundry & utility: Washer; Dryer; Washer hookup; Dryer hookup; Electric water heater
Neighborhood map
What this means for you Summary
Snapshot
- This is a 3-bed/2.0-bath single-family listed at $135k.
Deal economics
- At list price, monthly cash flow is $296 ($4k/yr) — positive.
- The deal already cash-flows at list — no discount required.
- Meets the 1% rule at list price ($1k rent vs $135k).
- Recommended offer: $133k (1.5% below list) — sets the bar for market timing.
- Cap rate 8.9% vs local median 3.9% in Avon Park — top-decile yield for the area; either an underpriced asset or a hidden risk that comps aren't pricing in. Stress-test before assuming the spread holds.
Location & tenants
- Location reads 71/100 on livability (#407 in FL) — a middle-class / working-renter tenant base. Strengths: cost of living A+, housing A+, health & safety A+; Watch: crime D+, schools F, amenities F.
- Highlands (other): math 45% / reading 43% proficiency, ranked #54 of 73 in FL (top 74%) — families likely to look elsewhere, expect single-tenant / working-renter base with shorter leases; 68% free/reduced lunch — lower-income household profile, screen leases tightly.
- Market conditions: 475 active listings in the ZIP; 1 comparable units currently listed for rent nearby; 980 units permitted in Highlands County in 2024 (80 in 5+ unit buildings).
- This rent runs 36% of the median local income ($47k/yr) — at the standard rent-burdened threshold; future hikes will face affordability resistance.
Forward outlook
- Local home prices are declining (-3.0%/yr); year-one equity from $933 of loan paydown is wiped out by about $4k of value loss. Plan a longer hold.
Negotiation context
- It's been on market 18 days — a 2% lower offer ($133k) is reasonable based on typical stale-listing flexibility.
- 4 sale attempts since 3y ago with the ask held roughly flat each time — persistent listings suggest the price (not the market) is what's stuck; bring a comps-based counter.
- Current owner paid $20k; list at $135k implies a 582% gain — meaningful room to come down on a strong offer.
Risks & watch-outs
- Watch-outs: built in 1945 — expect roof / HVAC / electrical / plumbing capex.
- Climate carrying-cost: severe wind risk, 99% chance of damaging wind over 30y; extreme-heat days projected 7→25/yr by 2055 (HVAC capex compounding) — expect insurance premiums to compound above CPI over the hold.
Questions for the listing agent
- Built in 1945 — when were the roof, HVAC, electrical panel, plumbing, and water heater last replaced?
- Is there a deadline driving the sale (1031 exchange, divorce, estate, relocation)? That informs how much negotiation room exists.
- Schools are F-rated, which usually means shorter tenancies and higher turnover. Who's the typical renter profile here, and what's been the actual vacancy rate?
- Crime grade is D in this area — have there been break-ins, vandalism, or insurance claims at this property in the last 3 years? What carrier currently insures it and at what premium?
- What's the average days-on-market for RENTAL listings here right now (not sales)? A rising rental-DOM trend means longer vacancies and softer asking-rent achievability than the comps imply.
- What's the recent tenant-quality profile in this submarket — average credit score on applications, eviction rate, late-payment / NSF rate, and stable-employment percentage? A property-management company in the area should have these aggregated.
- How much new for-sale + rental construction is in the pipeline within 1–3 miles? Heavy new supply typically softens prices + rents 12–24 months out; constrained supply supports both.
Investment metrics
- 1% rule
- 1.04% ✓
- Cap rate
- 8.92%
- Cash-on-cash
- 9.38%
- DSCR
- 1.42
- GRM
- 8.1
CMA / ARV
- ARV (on-the-fly)
- $167,076
- Comps found
- 12
Show comp detail 12 sales within ~0.75 mi
| Address | Dist | Beds/Ba | Sqft | Sold | Price | $/sf | Match |
|---|---|---|---|---|---|---|---|
| 907 Gwendolynn St | 0.22mi | 3/2.0 | 1,030 (-4%) | 2mo | $62,000 | $60 | 82 |
| 213 S Florida Ave | 0.20mi | 2/2.0 (-1) | 1,128 (+5%) | 15mo | $199,000 | $176 | 64 |
| 514 W Hall Mcrae Blvd | 0.38mi | 3/1.0 | 1,102 (+3%) | 15mo | $155,000 | $141 | 61 |
| 411 W Hall St | 0.19mi | 2/1.0 (-1) | 1,210 (+13%) | 2mo | $100,000 | $83 | 59 |
| 94 S Desoto Ave | 0.29mi | 3/2.0 | 1,012 (-6%) | 22mo | $205,000 | $203 | 59 |
| 907 W Circle St | 0.67mi | 3/2.0 | 1,056 (-1%) | 13mo | $149,900 | $142 | 56 |
| 920 W Hill St | 0.45mi | 3/2.0 | 1,152 (+8%) | 14mo | $217,000 | $188 | 55 |
| 12 N Desoto Ave | 0.43mi | 3/2.0 | 966 (-10%) | 20mo | $194,900 | $202 | 47 |
| 109 E State St | 0.67mi | 2/2.0 (-1) | 1,026 (-4%) | 14mo | $160,300 | $156 | 45 |
| 903 W Pleasant St | 0.60mi | 2/1.0 (-1) | 1,039 (-3%) | 19mo | $160,500 | $154 | 42 |
| 605 S Verona Ave | 0.63mi | 3/2.0 | 1,200 (+12%) | 13mo | $200,000 | $167 | 39 |
| 131 E Camphor St | 0.71mi | 2/2.0 (-1) | 957 (-11%) | 6mo | $128,000 | $134 | 39 |
Match score weights: distance 35% · size 25% · config 20% · recency 20%. Top-matched comps best support the ARV.
Projected returns pro-forma
-3.0% appreciation · 3.0% rent growth · sell at horizon
- IRR
- -2.2%
- Equity multiple
- 0.92×
- Total profit
- $-3,105
- Equity at exit
- $20,129
- IRR
- 7.5%
- Equity multiple
- 1.56×
- Total profit
- $21,313
- Equity at exit
- $11,672
Cash invested: $37,800 (down + closing). Projections, not guarantees.
Landlord ↔ Tenant lean methodology
- Overall (STATE)
- 87 Strongly Landlord-Friendly
- State Florida
- 87 Strongly Landlord-Friendly · R+3
- County
- — inherits STATE
- City
- — inherits STATE
ZIP-level market 33825
- Home prices YoY
- -25.9%
- Active inventory
- 475
- Price-to-rent
- 8.1×
Monthly cashflow live
- Estimated rent
- $1,397 medium interval (Pro) →
- Mortgage (P&I)
- −$708
- Tax from tax record
- −$44 /mo · $529/yr
- Insurance
- −$56
- HOA
- −$0
- Vacancy / Maint / Mgmt
- −$293
- Net cashflow
- $296
Break-even live
Sensitivity live
| Price | -10% $372 | -5% $334 | +0% $296 | +5% $257 | +10% $219 |
|---|---|---|---|---|---|
| Rent | -10% $185 | -5% $240 | +0% $296 | +5% $351 | +10% $406 |
| Rate | -1.0pp $364 | -0.5pp $330 | base $296 | +0.5pp $261 | +1.0pp $225 |
UW: 25.0% down · 7.5% · 30yr · 1.5% tax · 5.0% vac · 8.0% maint · 8.0% mgmt
Financing live
Cash to close
- Down payment
- $33,750
- Closing costs
- $4,050
- Reserves months
- —
- Total cash needed
- —
Loan-product check · same deal, 3 products live
Conventional
25% down · 7.5% · 30yr
- Down + closing
- —
- Monthly P&I
- —
- Monthly cashflow
- —
- DSCR
- —
- Eligible?
- —
Personal DTI + credit; lowest rate.
DSCR
20% down · 8.5% · 30yr
- Down + closing
- —
- Monthly P&I
- —
- Monthly cashflow
- —
- DSCR
- —
- Eligible?
- —
No personal income docs; deal must DSCR.
Hard money
10% down · 12.0% · 12mo
- Down + closing
- —
- Monthly P&I
- —
- Monthly cashflow
- —
- DSCR
- —
- Eligible?
- —
Short-term bridge; refi at stabilization.
Rent comps 1 comps
| Address | Beds | Baths | Sqft | Rent | $/sqft | DOM | Units | Dist |
|---|---|---|---|---|---|---|---|---|
| 565 Luminary LOOP Avon Park, FL | 2.0–3.0 | 1.5–2.0 | 1142 | $1,140 | $1.00 | 24d | 6 | 0.46mi |
Listing history 21 events
-
2026-06-19days on market $135,000 Active 18 DOM
-
2026-06-18days on market $135,000 Active 17 DOM
-
2026-06-17days on market $135,000 Active 16 DOM
-
2026-06-16days on market $135,000 Active 15 DOM
-
2026-06-15days on market $135,000 Active 14 DOM
-
2026-06-14days on market $135,000 Active 12 DOM
-
2026-06-10days on market $135,000 Active 130 DOM
-
2026-06-09days on market $135,000 Active 129 DOM
-
2026-06-08days on market $135,000 Active 128 DOM
-
2026-06-07days on market $135,000 Active 127 DOM
-
2026-06-03days on market $135,000 Active 122 DOM
-
2026-06-01days on market $135,000 Active 1 DOM
-
2026-02-16historical
-
2026-01-25$135,000 Active 228-char remark
Show marketing remark (228 chars)
Good Investment Opportunity, great corner lot- almost 1/2 acre in Avon Park. 3 bedrooms, 2 baths, Sold As-Is. close to US Hwy 27, downtown, restaurants, schools etc. , this house needs TLC. , it will be a magnificent investment.
-
2026-01-25$135,000 Active
Show marketing remark (228 chars)
Good Investment Opportunity, great corner lot- almost 1/2 acre in Avon Park. 3 bedrooms, 2 baths, Sold As-Is. close to US Hwy 27, downtown, restaurants, schools etc. , this house needs TLC. , it will be a magnificent investment.
-
2025-11-14$25,000 Active
-
2024-02-19historical Active Under Contract
-
2023-11-27price $145,500
-
2023-09-16price $168,900
-
2023-09-16$157,900 Active
-
1998-08-01soldstatus $19,800
ⓘ Source: listings_history table (triggers on properties + properties_extension) + one-shot
backfill from property_details.listing_events for pre-trigger history.
Tax reassessment forecast FL · Resets to sale price
- Current annual tax
- $529 · $44/mo
- Projected year-2 tax
- $1,120 · $93/mo
- Expected delta
- +$591/yr (+$49/mo · 111.7%)
ⓘ Screening estimate from a state-policy table — verify with the county assessor before closing.
Climate risk First Street
- Flood 1/10 Low FEMA zone X (unshaded) · 0% chance over 30 yrs
- Wildfire 4/10 Moderate
- Heat 9/10 Extreme 7 d/yr ≥108°F today · 25 d/yr by 30 yrs out
- Wind 9/10 Extreme 99% chance of damaging wind over 30 yrs
- Air quality 2/10 Low 2 unhealthy d/yr today · 2 by 30 yrs out
Nearby sold comps map
Loading sold comps map…
Walkable amenities ~0.75 mi
Loading nearby amenities…
Taxation est. · year 1
- Rental income
- $16,768
- − Mortgage interest
- −$7,562
- − Property taxes
- −$529
- − Insurance
- −$675
- − Repairs & maintenance
- −$1,341
- − Management
- −$1,341
- − Depreciation
- −$3,927
- Taxable income
- $1,392
- Est. tax owed @ 24.0%
- −$334
- After-tax cash flow
- $3,213/yr
For passive investors: Depreciation is non-cash, so a rental often shows a tax loss while cash-flowing — sheltering income. Rental losses are passive: they offset passive income freely, and up to $25,000/yr can offset ordinary (W-2) income if you actively participate and your MAGI is under $100k (phasing out to $0 by $150k); unused losses carry forward. On sale, claimed depreciation is recaptured at up to 25%, and gains may owe capital-gains tax (a 1031 exchange can defer both). Figures are a year-1 estimate at your 24.0% rate — not tax advice; consult a CPA.
Schools (NCES district)
- District
- Highlands
- NCES district ID
- 1200840
- Math proficiency
- 45% ▼ -7.00%
- Reading proficiency
- 43% ▼ -3.00%
- Median HH income
- $35,276
- Composite
- 36.42/100
- National rank
- #4672
- State rank
- #54 of 73 in FL
Livability — Avon Park
- Score
- 71/100
- State rank
- #407
- US rank
- #7205
Category grades
Schools grade is shown separately in the Schools card above.
Census & demographics
- Census place
- Avon Park, FL
- County
- Highlands County · 98,898 people
- City population
- 25,501
- Metro
- Sebring-Avon Park, FL
- Population (ZIP)
- 25,501
- Household income
- $46,949
- Rent vs Own
- Severe rent burden
- 691.0
Population outlook (Highlands County) Hauer SSP2
- Today (2025)
- 99,674 people
- By 2030
- 99,615 · -0.1%
- By 2040
- 99,342 · -0.3%
- By 2050
- 98,242 · -1.4%
- By 2075
- 93,291 · -6.4%
- By 2100
- 79,894 · -19.8%
Race, ethnicity, and origin ACS 2023
- Neighborhood character
- Diverse neighborhood (Simpson 0.64)
- Race & ethnicity
- White 51% Hispanic / Latino 27% Black 17% Two or more races 11% Asian 1%
- Hispanic origin (detail)
- Mexican 8% Puerto Rican 13% Cuban 2%
- Common ancestry
- Slovak 2% Lithuanian 2% Iranian 1%
- Foreign-born
- 10% · Canada, Vietnam, Guatemala
- Languages at home
- 74% English-only · Spanish 24% Tagalog/Filipino 1%
Political lean MEDSL · Highlands
- 2024 margin
- Solid R (+40.8) · D 29.3% · R 70.1%
- 2008→2024 swing
- -22.7pp toward R · 2008: -18.1pp · 2024: -40.8pp
- All cycles
- 2024: R+40.8 2020: R+34.4 2016: R+32.0 2012: R+23.0 2008: R+18.1
Not yet ingested
- Civics
- —
Market trends
- HPI YoY
- ▼ -98.54%
- Current HPI
- 281.8067
- Rent YoY
- —
- Metro
- Sebring-Avon Park, FL
- State GDP YoY
- ▲ 3.28%
- F500 in state
- 36
Industry mix (Fortune 500 HQ in FL)
| Industry | F500 HQs | Revenue |
|---|---|---|
| Industrial Technology | 2 | $29B |
|
||
| Insurance | 2 | $17B |
|
||
| Retail | 1 | $60B |
|
||
| Technology Distribution | 1 | $58B |
|
||
| Homebuilding | 1 | $35B |
|
||
| Technology Manufacturing | 1 | $35B |
|
||
Price history
+581.8% since first listed9 events — show timeline
- 2026-02-16 Listing Removed — MARMLS
- 2026-01-25 Listed $135,000 HAOR as distributed by MLS GRID
- 2026-01-25 Listed $135,000 MARMLS
- 2025-11-14 Listed $25,000 MARMLS
- 2024-02-19 Contingent — HAOR as distributed by MLS GRID
- 2023-11-27 Price Changed $145,500 HAOR as distributed by MLS GRID
- 2023-09-16 Price Changed $168,900 HAOR as distributed by MLS GRID
- 2023-09-16 Listed $157,900 HAOR as distributed by MLS GRID
- 1998-08-01 Sold (Public Records) $19,800 Public Records
Property tax history
+5.2%/yrLatest (2025): $529 · +12.9% YoY. Source: county tax records.
Cash-flow waterfall
monthlySold comps — $/sqft
last 12 mo · ≤1 miLoading sold comps…