113 Kemp St · Pontiac, MI
Flood risk 1/10 · Minimal
- FEMA flood zone
- X (unshaded)
- Chance of flooding over 30 yrs
- 0.0%
- Est. flood insurance / yr
- $473 – $860
Fire risk 1/10 · Minimal
- Est. fire insurance / yr
- $784 – $1,456
Heat risk 2/10 · Minimal
- Hot days now (above 96°F)
- 7 days/yr
- Hot days in 30 yrs
- 15 days/yr
Wind risk 2/10 · Minimal
- Chance of severe wind over 30 yrs
- —
Air-quality risk 3/10 · Minor
- Unhealthy air days now
- 2 days/yr
- Unhealthy air days in 30 yrs
- 4 days/yr
Risk factors via First Street. Map © Google.
Why this score? — see what drove the D- grade
The composite is a weighted blend of 9 inputs, each scored 0–100. Each bar is that input's sub-score; the figure is the points it added to the 100-point composite (weight × sub-score).
- Cash flow +17.4/30.0
- DSCR +5.4/10.0
- 1% rule +5.3/10.0
- Livability +3.2/5.0
- Rent growth +2.5/5.0
- Condition / age +2.5/5.0
- Schools +1.0/10.0
- ARV discount +0.0/15.0
- Appreciation +0.0/10.0
$123,950
🖨 Deal sheet (PDF) 📄 Offer letter ✓ Due diligence
Listing remarks MLS
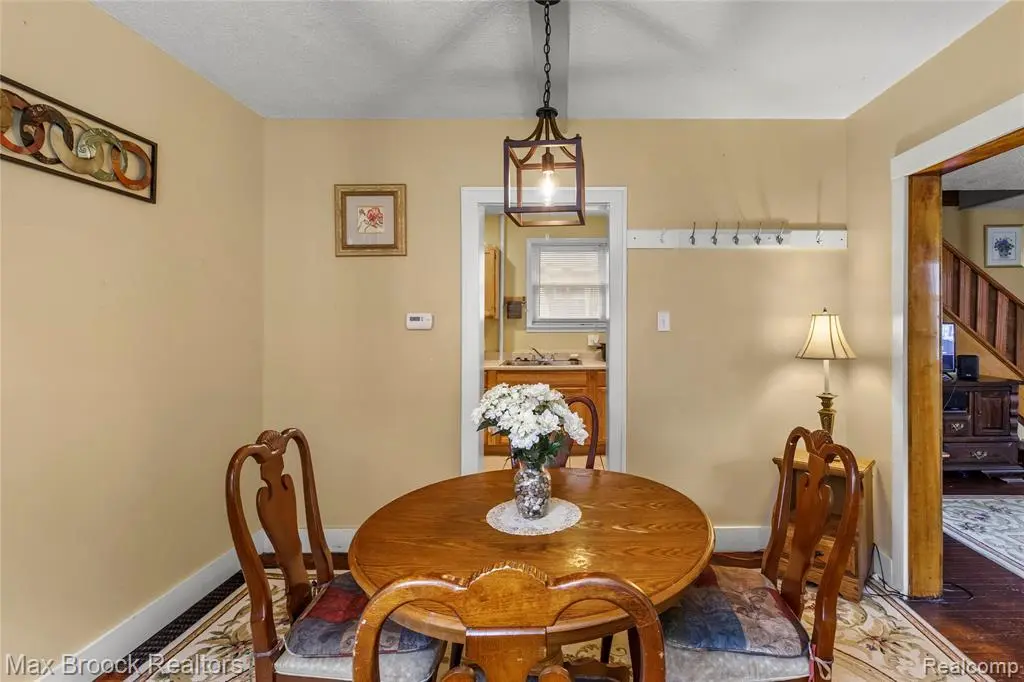
Seller Ready to Go – All Reasonable Offers Considered! Don't miss this wonderful opportunity to own a historic home! Step onto the three-season front porch and enter the charming living room, featuring original moldings and gleaming hardwood floors. The living room flows seamlessly into the formal dining room and a full kitchen with ample storage. Upstairs, you'll find two generously sized bedrooms and a full bathroom. The basement offers a laundry area and plenty of additional storage. Enjoy outdoor living in the oversized yard - perfect for activities and entertaining. This home is part of GM Modern Housing Historic Homes and has seen recent updates, including a new roof (2021) and furnace (2016). Schedule your visit today!
Key facts
- Formal dining room
- Laundry area
- Original moldings
Tags
Property features AI
Exterior
- Parking: No garage
- Utilities: Public water; Public sewer
- Home design: Single-family residence; Two levels; Ground-level entry with steps
- Construction: Built with block foundation; Other construction materials
- Exterior features: Paved road access; Lot dimensions approximately 41.97 x 132.13 (0.13 acres)
Interior
- Bedrooms: Total rooms: 5
- Bathrooms: 1 full bathroom
- Heating & cooling: Forced air heating (natural gas); Window air conditioning units
- Interior features: Unfinished basement; Enclosed porch/patio
Neighborhood map
What this means for you Summary
Snapshot
- This is a 2-bed/1.0-bath single-family listed at $124k.
Deal economics
- At list price, monthly cash flow is $93 ($1k/yr) — positive.
- The deal already cash-flows at list — no discount required.
- Meets the 1% rule at list price ($1k rent vs $124k).
- Cap rate 7.2% vs local median 5.4% in Pontiac — top-decile yield for the area; either an underpriced asset or a hidden risk that comps aren't pricing in. Stress-test before assuming the spread holds.
Location & tenants
- Location reads 64/100 on livability (#499 in MI) — a middle-class / working-renter tenant base. Strengths: commute A+, cost of living A+, housing A+; Watch: health & safety D, crime F, amenities F.
- Pontiac City School District (urban): math 8% / reading 17% proficiency, ranked #514 of 540 in MI (top 95%) — low school quality limits family demand, transient renter base, plan for 1-2y turnover; 81% free/reduced lunch — lower-income household profile, screen leases tightly.
- Zoned schools: Owen Elementary School (math 12% / reading 17%, grade F, #1,185 of 1,397 statewide, top 86%, 289 students, 85% FRL); Pontiac Middle School (math 8% / reading 23%, grade F, #450 of 493 statewide, top 91%, 729 students, 81% FRL); Pontiac High School (math 12% / reading 27%, grade F, #622 of 713 statewide, top 88%, 935 students, 75% FRL) — zoned schools at 80% FRL track the district average.
- Market conditions: 90 active listings in the ZIP; 25 comparable units currently listed for rent nearby; rentals at typical pace (median 26d on market — plan ~3-4 weeks tenant-placement turnaround); 48% of comp listings sitting > 30 days — soft ceiling on asking rent; 2,614 units permitted in Oakland County in 2024 (721 in 5+ unit buildings).
Forward outlook
- Local home prices are declining (-3.0%/yr); year-one equity from $856 of loan paydown is wiped out by about $4k of value loss. Plan a longer hold.
- Oakland County population projected at +10% by 2050 — modest demand growth; plan on rents tracking national, not racing it.
Negotiation context
- Only 2 days on market — expect competitive offers; lowballing is unlikely to land.
- 7 sale attempts since 18y ago with the ask held roughly flat each time — persistent listings suggest the price (not the market) is what's stuck; bring a comps-based counter.
- Current owner paid $1k; list at $124k implies a 11705% gain — meaningful room to come down on a strong offer.
Risks & watch-outs
- Watch-outs: built in 1920 — expect roof / HVAC / electrical / plumbing capex.
Questions for the listing agent
- Built in 1920 — when were the roof, HVAC, electrical panel, plumbing, and water heater last replaced?
- Is there a deadline driving the sale (1031 exchange, divorce, estate, relocation)? That informs how much negotiation room exists.
- Schools are F-rated, which usually means shorter tenancies and higher turnover. Who's the typical renter profile here, and what's been the actual vacancy rate?
- Crime grade is F in this area — have there been break-ins, vandalism, or insurance claims at this property in the last 3 years? What carrier currently insures it and at what premium?
- The area grade is low — what's the realistic commute time and amenity access for the typical tenant pool here? Any planned neighborhood developments (good or bad) we should know about?
- What's the average days-on-market for RENTAL listings here right now (not sales)? A rising rental-DOM trend means longer vacancies and softer asking-rent achievability than the comps imply.
- What's the recent tenant-quality profile in this submarket — average credit score on applications, eviction rate, late-payment / NSF rate, and stable-employment percentage? A property-management company in the area should have these aggregated.
- How much new for-sale + rental construction is in the pipeline within 1–3 miles? Heavy new supply typically softens prices + rents 12–24 months out; constrained supply supports both.
Investment metrics
- 1% rule
- 1.03% ✓
- Cap rate
- 7.19%
- Cash-on-cash
- 3.22%
- DSCR
- 1.14
- GRM
- 8.1
CMA / ARV
- ARV (median comp)
- $100,078
- List price
- $123,950
- Delta
- 23.85%
- Verdict
- OVERPRICED
- Comps
- 20 within 1.0 mi
Show comp detail 12 sales within ~0.75 mi
| Address | Dist | Beds/Ba | Sqft | Sold | Price | $/sf | Match |
|---|---|---|---|---|---|---|---|
| 50 Lewis St | 0.14mi | 3/1.0 (+1) | 1,614 (+9%) | 10mo | $62,500 | $39 | 66 |
| 352 N Perry St | 0.35mi | 3/1.0 (+1) | 1,344 (-9%) | 0mo | $90,000 | $67 | 63 |
| 93 Poplar Ave | 0.41mi | 3/1.5 (+1) | 1,344 (-9%) | 1mo | $191,500 | $142 | 57 |
| 73 Poplar Ave | 0.37mi | 3/2.5 (+1) | 1,367 (-8%) | 3mo | $130,000 | $95 | 57 |
| 68 Kimball St | 0.51mi | 3/2.0 (+1) | 1,564 (+6%) | 3mo | $141,000 | $90 | 56 |
| 320 Cesar E Chavez Ave | 0.65mi | 3/2.0 (+1) | 1,530 (+3%) | 1mo | $170,000 | $111 | 55 |
| 25 Ellwood St | 0.30mi | 3/1.0 (+1) | 1,294 (-13%) | 8mo | $127,700 | $99 | 53 |
| 51 Forest St | 0.34mi | 3/2.5 (+1) | 1,361 (-8%) | 11mo | $135,000 | $99 | 50 |
| 37 Poplar Ave | 0.30mi | 3/2.0 (+1) | 1,287 (-13%) | 8mo | $135,000 | $105 | 48 |
| 107 Hamilton St | 0.44mi | 3/2.5 (+1) | 1,350 (-9%) | 11mo | $135,000 | $100 | 44 |
| 140 W Howard St | 0.55mi | 3/1.5 (+1) | 1,288 (-13%) | 5mo | $105,000 | $82 | 41 |
| 38 Summit St | 0.75mi | 3/2.5 (+1) | 1,361 (-8%) | 12mo | $135,000 | $99 | 30 |
Match score weights: distance 35% · size 25% · config 20% · recency 20%. Top-matched comps best support the ARV.
Projected returns pro-forma
-3.0% appreciation · 3.0% rent growth · sell at horizon
- IRR
- -11.2%
- Equity multiple
- 0.59×
- Total profit
- $-14,102
- Equity at exit
- $18,481
- IRR
- -1.9%
- Equity multiple
- 0.87×
- Total profit
- $-4,428
- Equity at exit
- $10,717
Cash invested: $34,706 (down + closing). Projections, not guarantees.
Landlord ↔ Tenant lean methodology
- Overall (STATE)
- 62 Landlord-Friendly
- State Michigan
- 62 Landlord-Friendly · EVEN
- County
- — inherits STATE
- City
- — inherits STATE
ZIP-level market 48342
- Home prices YoY
- -33.8%
- Active inventory
- 90
- Price-to-rent
- 8.1×
Monthly cashflow live
- Estimated rent
- $1,272 high interval (Pro) →
- Mortgage (P&I)
- −$650
- Tax from tax record
- −$210 /mo · $2,523/yr
- Insurance
- −$52
- HOA
- −$0
- Vacancy / Maint / Mgmt
- −$267
- Net cashflow
- $93
Break-even live
Sensitivity live
| Price | -10% $163 | -5% $128 | +0% $93 | +5% $58 | +10% $23 |
|---|---|---|---|---|---|
| Rent | -10% $-7 | -5% $43 | +0% $93 | +5% $143 | +10% $194 |
| Rate | -1.0pp $156 | -0.5pp $125 | base $93 | +0.5pp $61 | +1.0pp $28 |
UW: 25.0% down · 7.5% · 30yr · 1.5% tax · 5.0% vac · 8.0% maint · 8.0% mgmt
Financing live
Cash to close
- Down payment
- $30,988
- Closing costs
- $3,718
- Reserves months
- —
- Total cash needed
- —
Loan-product check · same deal, 3 products live
Conventional
25% down · 7.5% · 30yr
- Down + closing
- —
- Monthly P&I
- —
- Monthly cashflow
- —
- DSCR
- —
- Eligible?
- —
Personal DTI + credit; lowest rate.
DSCR
20% down · 8.5% · 30yr
- Down + closing
- —
- Monthly P&I
- —
- Monthly cashflow
- —
- DSCR
- —
- Eligible?
- —
No personal income docs; deal must DSCR.
Hard money
10% down · 12.0% · 12mo
- Down + closing
- —
- Monthly P&I
- —
- Monthly cashflow
- —
- DSCR
- —
- Eligible?
- —
Short-term bridge; refi at stabilization.
Rent comps 25 comps
| Address | Beds | Baths | Sqft | Rent | $/sqft | DOM | Units | Dist |
|---|---|---|---|---|---|---|---|---|
| 65 Whitfield St Pontiac, MI | 3.0 | 1.0 | 924 | $1,175 | $1.27 | 45d | 1 | 0.12mi |
| 20 Frank St Pontiac, MI | 1.0 | 1.0 | 995 | $800 | $0.80 | 19d | 1 | 0.33mi |
| 264 Nelson St Pontiac, MI | 3.0 | 1.0 | 1478 | $1,590 | $1.08 | 45d | 1 | 0.38mi |
| 49 Oakhill St Pontiac, MI | 3.0 | 1.0 | 1200 | $1,575 | $1.31 | 26d | 1 | 0.41mi |
| 188 Vernon Dr Pontiac, MI | 3.0 | 1.0 | 1100 | $1,500 | $1.36 | 26d | 1 | 0.68mi |
| 672 Linda Vista Dr Pontiac, MI | 3.0 | 1.0 | 900 | $1,500 | $1.67 | 5d | 1 | 0.68mi |
| 16 Victory Dr Unit 18 Pontiac, MI | 2.0 | 1.0 | 1114 | $1,150 | $1.03 | 26d | 1 | 0.79mi |
| 16 Victory Dr Unit 18 Pontiac, MI | 2.0 | 1.0 | 1118 | $1,150 | $1.03 | 45d | 1 | 0.79mi |
| 5 Carter St Pontiac, MI | 1.0 | 1.0 | 880 | $1,034 | $1.18 | 6d | 1 | 0.84mi |
| 4000 Winston Dr Pontiac, MI | 2.0 | 1.5 | 952 | $1,182 | $1.24 | 1d | 1 | 0.84mi |
| 957 Perry St Pontiac, MI | 1.0–3.0 | 1.0 | 835 | $974 | $1.17 | 45d | 1 | 0.91mi |
| 35 N Saginaw St Pontiac, MI | 1.0 | 1.0 | 1000 | $1,350 | $1.35 | 45d | 1 | 0.92mi |
| 35 N Saginaw St Unit 2 Pontiac, MI | 1.0 | 1.0 | 1000 | $1,350 | $1.35 | 45d | 1 | 0.92mi |
| 68 N Shirley St Pontiac, MI | 3.0 | 1.0 | 950 | $1,395 | $1.47 | 19d | 1 | 1.01mi |
| 85 E Beverly Ave Pontiac, MI | 3.0 | 1.0 | 1000 | $1,250 | $1.25 | 6d | 1 | 1.03mi |
| 38 N Shirley St Pontiac, MI | 3.0 | 1.0 | 1174 | $1,425 | $1.21 | 45d | 1 | 1.05mi |
| 611 E Madison Ave Pontiac, MI | 3.0 | 1.5 | 950 | $1,395 | $1.47 | 45d | 1 | 1.07mi |
| 195 W Kennett Rd Unit 202 Pontiac, MI | 2.0 | 1.0 | 950 | $875 | $0.92 | 45d | 1 | 1.19mi |
| 750 Scottwood St Pontiac, MI | 3.0 | 1.0 | 920 | $1,395 | $1.52 | 14d | 1 | 1.21mi |
| 126 W Cornell Ave Pontiac, MI | 3.0 | 1.0 | 891 | $1,125 | $1.26 | 23d | 1 | 1.27mi |
| 126 W Cornell Ave Pontiac, MI | 3.0 | 1.0 | 891 | $1,325 | $1.49 | 45d | 1 | 1.27mi |
| 23 Henry Clay Ave Unit 1 Pontiac, MI | 3.0 | 1.0 | 1200 | $1,450 | $1.21 | 19d | 1 | 1.35mi |
| 695 1st Ave Pontiac, MI | 3.0 | 1.0 | 986 | $1,295 | $1.31 | 45d | 1 | 1.37mi |
| 128 S Edith St Pontiac, MI | 2.0–3.0 | 2.0 | 1155 | $1,384 | $1.20 | 19d | 1 | 1.49mi |
| 90 Martin Luther King Jr Blvd S Pontiac, MI | 2.0 | 1.0 | 900 | $1,000 | $1.11 | 45d | 1 | 1.50mi |
Listing history 27 events
-
2026-06-18days on market $123,950 Active 2 DOM
-
2026-06-16days on market $123,950 Active 1 DOM
Show marketing remark (754 chars)
Seller Ready to Go – All Reasonable Offers Considered! Don't miss this wonderful opportunity to own a historic home! Step onto the three-season front porch and enter the charming living room, featuring original moldings and gleaming hardwood floors. The living room flows seamlessly into the formal dining room and a full kitchen with ample storage. Upstairs, you'll find two generously sized bedrooms and a full bathroom. The basement offers a laundry area and plenty of additional storage. Enjoy outdoor living in the oversized yard - perfect for activities and entertaining. This home is part of GM Modern Housing Historic Homes and has seen recent updates, including a new roof (2021) and furnace (2016). Schedule your visit today!
-
2026-06-15pricedays on market $123,950 Active 43 DOM
-
2026-06-13days on market $169,500 Active 41 DOM
-
2026-06-13days on market $169,500 Active 40 DOM
-
2026-06-09days on market $169,500 Active 37 DOM
-
2026-06-08days on market $169,500 Active 36 DOM
-
2026-06-07days on market $169,500 Active 35 DOM
-
2026-06-04days on market $169,500 Active 32 DOM
-
2026-06-03days on market $169,500 Active 31 DOM
-
2026-06-02days on market $169,500 Active 30 DOM
-
2026-06-01days on market $169,500 Active 29 DOM
-
2026-05-31days on market $169,500 Active 28 DOM
-
2026-05-03$169,500 Active 757-char remark
-
2026-05-03$169,500 Active 754-char remark
-
2023-02-11historical
-
2023-02-11historical
-
2023-02-08price $112,500
-
2023-02-04price $117,500
-
2022-12-15price $110,500
-
2022-12-11$123,000 Active
-
2022-12-11$112,500
-
2009-04-23soldstatus $1,050
-
2008-12-01$3,900
-
2008-05-13soldstatus $64,590
-
2000-02-03soldstatus $67,000
-
2000-02-03soldstatus $64,000
ⓘ Source: listings_history table (triggers on properties + properties_extension) + one-shot
backfill from property_details.listing_events for pre-trigger history.
Tax reassessment forecast MI · Partial reset (capped growth)
- Current annual tax
- $2,523 · $210/mo
- Projected year-2 tax
- $2,523 · $210/mo
- Expected delta
- $0/yr ($0/mo · 0.0%)
ⓘ Screening estimate from a state-policy table — verify with the county assessor before closing.
Climate risk First Street
- Flood 1/10 Low FEMA zone X (unshaded) · 0% chance over 30 yrs
- Wildfire 1/10 Low
- Heat 2/10 Low 7 d/yr ≥96°F today · 15 d/yr by 30 yrs out
- Wind 2/10 Low
- Air quality 3/10 Moderate 2 unhealthy d/yr today · 4 by 30 yrs out
Nearby sold comps map
Loading sold comps map…
Walkable amenities ~0.75 mi
Loading nearby amenities…
Taxation est. · year 1
- Rental income
- $15,266
- − Mortgage interest
- −$6,943
- − Property taxes
- −$2,523
- − Insurance
- −$620
- − Repairs & maintenance
- −$1,221
- − Management
- −$1,221
- − Depreciation
- −$3,606
- Taxable loss
- −$868
- Est. tax savings @ 24.0%
- +$208
- After-tax cash flow
- $1,326/yr
For passive investors: Depreciation is non-cash, so a rental often shows a tax loss while cash-flowing — sheltering income. Rental losses are passive: they offset passive income freely, and up to $25,000/yr can offset ordinary (W-2) income if you actively participate and your MAGI is under $100k (phasing out to $0 by $150k); unused losses carry forward. On sale, claimed depreciation is recaptured at up to 25%, and gains may owe capital-gains tax (a 1031 exchange can defer both). Figures are a year-1 estimate at your 24.0% rate — not tax advice; consult a CPA.
Schools (NCES district)
- District
- Pontiac City School District
- NCES district ID
- 2628740
- Math proficiency
- 8% ▼ -5.00%
- Reading proficiency
- 17% ▼ -3.00%
- Median HH income
- $33,888
- Composite
- 10.12/100
- National rank
- #9802
- State rank
- #514 of 540 in MI
Livability — Pontiac
- Score
- 64/100
- State rank
- #499
- US rank
- #14703
Category grades
Schools grade is shown separately in the Schools card above.
Census & demographics
- Census place
- Pontiac, MI
- City population
- 44,593
- Population (ZIP)
- 17,227
Population outlook (Oakland County) Hauer SSP2
- Today (2025)
- 1,335,747 people
- By 2030
- 1,375,100 · +2.9%
- By 2040
- 1,435,385 · +7.5%
- By 2050
- 1,469,250 · +10.0%
- By 2075
- 1,531,946 · +14.7%
- By 2100
- 1,450,485 · +8.6%
Race, ethnicity, and origin ACS 2023
- Neighborhood character
- Diverse neighborhood (Simpson 0.62)
- Race & ethnicity
- Black 57% Hispanic / Latino 19% White 13% Two or more races 13% Asian 4%
- Hispanic origin (detail)
- Mexican 11% Puerto Rican 2%
- Common ancestry
- Romanian 1% Lithuanian 1% Italian 1%
- Foreign-born
- 10% · Canada, Vietnam
- Languages at home
- 79% English-only · Spanish 15% Other Asian/Pacific 4% Other Indo-European 1%
Political lean MEDSL · Oakland
- 2024 margin
- D (+10.6) · D 54.4% · R 43.8% · Other 1.9%
- 2008→2024 swing
- -3.9pp toward R · 2008: 14.5pp · 2024: 10.6pp
- All cycles
- 2024: D+10.6 2020: D+14.1 2016: D+8.1 2012: D+8.1 2008: D+14.5
Not yet ingested
- Civics
- —
Market trends
- HPI YoY
- ▼ -109.18%
- Current HPI
- 214.3258
- Rent YoY
- —
- Metro
- —
- State GDP YoY
- ▲ 1.37%
- F500 in state
- 28
Industry mix (Fortune 500 HQ in MI)
| Industry | F500 HQs | Revenue |
|---|---|---|
| Automotive Parts | 3 | $48B |
|
||
| Automotive | 2 | $372B |
|
||
| Chemicals | 1 | $45B |
|
||
| Automotive Retail | 1 | $29B |
|
||
| Healthcare / Medical Devices | 1 | $23B |
|
||
| Automotive Technology | 1 | $20B |
|
||
Price history
+85.0% since first listed20 events — show timeline
- 2026-06-16 Listed $123,950 REALCOMP
- 2026-06-16 Listed $123,950 MiRealSource-MiMLS
- 2026-06-15 Listing Removed — MiRealSource-MiMLS
- 2026-06-15 Listing Removed — REALCOMP
- 2026-06-14 Price Changed $123,950 REALCOMP
- 2026-06-14 Price Changed $123,950 MiRealSource-MiMLS
- 2026-05-03 Listed $169,500 REALCOMP
- 2026-05-03 Listed $169,500 MiRealSource-MiMLS
- 2023-02-11 Listing Removed — REALCOMP
- 2023-02-11 Listing Removed — MiRealSource-MiMLS
- 2023-02-08 Price Changed $112,500 MiRealSource-MiMLS
- 2023-02-04 Price Changed $117,500 MiRealSource-MiMLS
- 2022-12-15 Price Changed $110,500 MiRealSource-MiMLS
- 2022-12-11 Listed $112,500 REALCOMP
- 2022-12-11 Listed $123,000 MiRealSource-MiMLS
- 2009-04-23 Sold (MLS) $1,050 REALCOMP
- 2008-12-01 Listed $3,900 REALCOMP
- 2008-05-13 Sold (Public Records) $64,590 Public Records
- 2000-02-03 Sold (Public Records) $64,000 Public Records
- 2000-02-03 Sold (Public Records) $67,000 Public Records
Property tax history
+14.0%/yrLatest (2025): $2,523 · +30.1% YoY. Source: county tax records.
Cash-flow waterfall
monthlySold comps — $/sqft
last 12 mo · ≤1 miLoading sold comps…