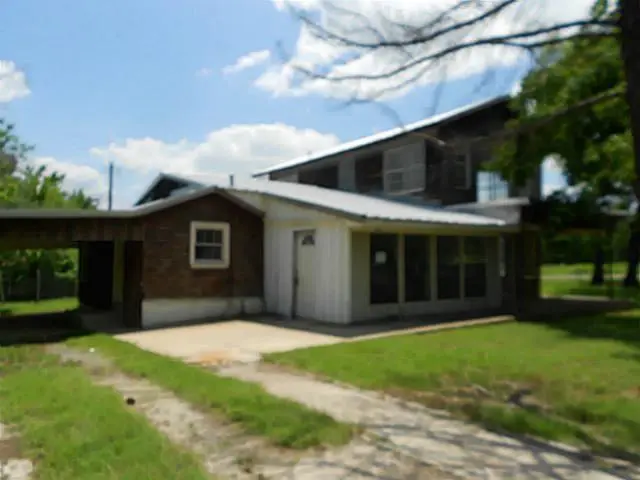
401 Vista Oaks · West Tawakoni, TX
Flood risk 1/10 · Minimal
- FEMA flood zone
- X (unshaded)
- Chance of flooding over 30 yrs
- 0.0%
- Est. flood insurance / yr
- $507 – $1,088
Fire risk 4/10 · Minor
- Est. fire insurance / yr
- $1,222 – $2,270
Heat risk 7/10 · Major
- Hot days now (above 110°F)
- 7 days/yr
- Hot days in 30 yrs
- 24 days/yr
Wind risk 6/10 · Moderate
- Chance of severe wind over 30 yrs
- 27.0%
Air-quality risk 2/10 · Minimal
- Unhealthy air days now
- 0 days/yr
- Unhealthy air days in 30 yrs
- 1 days/yr
Risk factors via First Street. Map © Google.
Why this score? — see what drove the B+ grade
The composite is a weighted blend of 9 inputs, each scored 0–100. Each bar is that input's sub-score; the figure is the points it added to the 100-point composite (weight × sub-score).
- Cash flow +30.0/30.0
- 1% rule +10.0/10.0
- DSCR +10.0/10.0
- Appreciation +10.0/10.0
- ARV discount +7.5/15.0
- Livability +2.8/5.0
- Schools +2.6/10.0
- Rent growth +2.5/5.0
- Condition / age +2.5/5.0
$99,999
🖨 Deal sheet 📄 Offer letter ✓ Due diligence
Listing remarks
Great location! This house is located walking walking distance from the Lake Tawakoni. . Great opportunity for the primary home or investment property. Lake Tawakoni is a recreational lake for a family fun, fishing and relax the neighborhood. Water front BellaVista subdivision offers this property with garage behind house. Enter to open living dining area. 2 beds & bath downstairs & 2 up this a bathroom between them. Sliding glass doors of the master downstairs & bed room above. Lots of space.
Key facts
- Walking distance
- Water front
- Recreational lake
Tags
Property features AI
Finance
- Other: Municipal utility district: No; Possession 30-60 days; Listing status: Active
- Financial info: Listing terms include Cash, Conventional, Owner financing available, and Contact Agent
- HOA & community: No association
Exterior
- Parking: One covered parking space; One garage space; No carport
- Utilities: City sewer; City water; Co-op electric
- Home design: Single family residence; Residential property; Built in 1976; Not attached
- Construction: Preowned
- Exterior features: Lot under 0.5 acre (approx. 0.199 acres); Subdivision: Bellavista Una Add
Interior
- Kitchen: Disposal; Electric cooktop; Electric oven; Electric water heater
- Bedrooms: Four bedrooms (primary bedroom on first level; additional bedrooms on first and second levels as noted)
- Bathrooms: Two full bathrooms
- Interior features: Open floorplan; Two levels; Five total rooms; One living area; One dining area
- Laundry & utility: Electric water heater
Neighborhood map
What this means for you Summary
Snapshot
- This is a 4-bed/3.0-bath single-family listed at $100k.
Deal economics
- At list price, monthly cash flow is $767 ($9k/yr) — positive.
- The deal already cash-flows at list — no discount required.
- Meets the 1% rule at list price ($2k rent vs $100k).
- Recommended offer: $97k (3.0% below list) — sets the bar for market timing.
- Cap rate 15.5% vs local median 4.6% in West Tawakoni — top-decile yield for the area; either an underpriced asset or a hidden risk that comps aren't pricing in. Stress-test before assuming the spread holds.
Location & tenants
- Location reads 56/100 on livability (#1,337 in TX) — a working-class tenant base; expect higher turnover. Strengths: cost of living A+, housing A+, crime A-; Watch: amenities F, commute F, employment F.
- Quinlan ISD (rural): math 27% / reading 34% proficiency, ranked #610 of 826 in TX (top 74%) — families likely to look elsewhere, expect single-tenant / working-renter base with shorter leases.
- Zoned schools: D C Cannon El (765 students, 81% FRL) — zoned schools average 81% FRL vs 60% district-wide (22 pts higher); higher-poverty schools than district average — tighter screening recommended.
- Market conditions: 335 active listings in the ZIP; 5 comparable units currently listed for rent nearby; rentals leasing fast (median 1d on market — plan ~1-2 weeks tenant-placement turnaround); 1,289 units permitted in Hunt County in 2024 (527 in 5+ unit buildings).
Forward outlook
- In year one you build about $11k of equity ($691 loan paydown + $10k appreciation (10.0% local appreciation)).
- Hunt County population projected at +15% by 2050 — modest demand growth; plan on rents tracking national, not racing it.
- At projected returns (10.0% appreciation + 3.0% rent growth), your $28k cash investment doubles in ~2 years — after that, you're playing with house money.
- By year 4, paydown + projected appreciation supports a ~$38k cash-out refi (75% LTV) — recoverable capital for the next deal without selling this one.
Negotiation context
- It's been on market 37 days — a 3% lower offer ($97k) is reasonable based on typical stale-listing flexibility.
- 6 sale attempts since 13y ago; this cycle's ask has dropped $30k (23%) from the opening price — seller is motivated, your offer sets the floor, not the list.
Risks & watch-outs
- Watch-outs: property tax is 2.5% of price.
- Climate carrying-cost: major wind risk, 27% chance of damaging wind over 30y; extreme-heat days projected 7→24/yr by 2055 (HVAC capex compounding) — expect insurance premiums to compound above CPI over the hold.
Questions for the listing agent
- It's been on market 37 days. Have you received any prior offers? Is the seller open to a 3% concession, seller financing, or rate buy-down credit?
- Built in 1976 — when were the roof, HVAC, electrical panel, plumbing, and water heater last replaced?
- Property tax is high relative to price — has the assessment been appealed recently, and will the sale trigger a re-assessment?
- Is there a deadline driving the sale (1031 exchange, divorce, estate, relocation)? That informs how much negotiation room exists.
- Schools are F-rated, which usually means shorter tenancies and higher turnover. Who's the typical renter profile here, and what's been the actual vacancy rate?
- What's the average days-on-market for RENTAL listings here right now (not sales)? A rising rental-DOM trend means longer vacancies and softer asking-rent achievability than the comps imply.
- What's the recent tenant-quality profile in this submarket — average credit score on applications, eviction rate, late-payment / NSF rate, and stable-employment percentage? A property-management company in the area should have these aggregated.
- How much new for-sale + rental construction is in the pipeline within 1–3 miles? Heavy new supply typically softens prices + rents 12–24 months out; constrained supply supports both.
Investment metrics
- 1% rule
- 1.95% ✓
- Cap rate
- 15.49%
- Cash-on-cash
- 32.86%
- DSCR
- 2.46
- GRM
- 4.3
CMA / ARV
- ARV (median comp)
- $267,539
- List price
- $99,999
- Delta
- -62.62%
- Verdict
- UNDERPRICED
- Comps
- 20 within 1.0 mi
Show comp detail 7 sales within ~0.75 mi
| Address | Dist | Beds/Ba | Sqft | Sold | Price | $/sf | Match |
|---|---|---|---|---|---|---|---|
| 117 Indian Oaks Trl | 0.38mi | 3/2.0 (-1) | 1,920 (-2%) | 4mo | $285,000 | $148 | 66 |
| 116 Kirk Ln | 0.14mi | 4/2.0 | 1,685 (-14%) | 3mo | $295,000 | $175 | 63 |
| 713 Hillburn | 0.35mi | 3/2.0 (-1) | 1,849 (-6%) | 10mo | $269,999 | $146 | 57 |
| 112 Indian Oaks Dr | 0.41mi | 4/2.0 | 1,732 (-12%) | 12mo | $284,990 | $165 | 47 |
| 273 Hoot Owl Cir | 0.63mi | 3/2.0 (-1) | 2,001 (+2%) | 15mo | $258,000 | $129 | 46 |
| 1042 Crestline | 0.60mi | 3/2.0 (-1) | 1,725 (-12%) | 3mo | $239,000 | $139 | 40 |
| 1000 Shoreline Dr | 0.50mi | 3/2.0 (-1) | 1,730 (-12%) | 12mo | $249,900 | $144 | 38 |
Match score weights: distance 35% · size 25% · config 20% · recency 20%. Top-matched comps best support the ARV.
Projected returns pro-forma
10.0% appreciation · 3.0% rent growth · sell at horizon
- IRR
- 49.4%
- Equity multiple
- 4.69×
- Total profit
- $103,382
- Equity at exit
- $90,087
- IRR
- 43.1%
- Equity multiple
- 10.51×
- Total profit
- $266,201
- Equity at exit
- $194,276
Cash invested: $28,000 (down + closing). Projections, not guarantees.
Landlord ↔ Tenant lean methodology
- Overall (STATE)
- 87 Strongly Landlord-Friendly
- State Texas
- 87 Strongly Landlord-Friendly · R+5
- County
- — inherits STATE
- City
- — inherits STATE
ZIP-level market 75474
- Home prices YoY
- 7.5%
- Active inventory
- 335
- Price-to-rent
- 4.3×
Monthly cashflow live
- Estimated rent
- $1,955 high interval (Pro) →
- Mortgage (P&I)
- −$524
- Tax from tax record
- −$212 /mo · $2,539/yr
- Insurance
- −$42
- HOA
- −$0
- Vacancy / Maint / Mgmt
- −$411
- Net cashflow
- $767
Break-even live
UW: 25.0% down · 7.5% · 30yr · 1.5% tax · 5.0% vac · 8.0% maint · 8.0% mgmt
Financing live
Cash to close
- Down payment
- $25,000
- Closing costs
- $3,000
- Reserves months
- —
- Total cash needed
- —
Loan-product check · same deal, 3 products live
Conventional
25% down · 7.5% · 30yr
- Down + closing
- —
- Monthly P&I
- —
- Monthly cashflow
- —
- DSCR
- —
- Eligible?
- —
Personal DTI + credit; lowest rate.
DSCR
20% down · 8.5% · 30yr
- Down + closing
- —
- Monthly P&I
- —
- Monthly cashflow
- —
- DSCR
- —
- Eligible?
- —
No personal income docs; deal must DSCR.
Hard money
10% down · 12.0% · 12mo
- Down + closing
- —
- Monthly P&I
- —
- Monthly cashflow
- —
- DSCR
- —
- Eligible?
- —
Short-term bridge; refi at stabilization.
Rent comps 5 comps
| Address | Beds | Baths | Sqft | Rent | $/sqft | DOM | Units | Dist |
|---|---|---|---|---|---|---|---|---|
| 820 Hillside Dr Quinlan, TX | 3.0 | 2.0 | 1410 | $1,800 | $1.28 | 2d | 1 | 0.39mi |
| 200 Dover Dr Unit 1 or 2 West Tawakoni, TX | 3.0 | 2.5 | 1854 | $1,850 | $1.00 | 1d | 1 | 0.40mi |
| 104 Perch Dr Quinlan, TX | 3.0 | 2.5 | 2082 | $1,795 | $0.86 | 1d | 1 | 0.43mi |
| 206 Perch Dr Quinlan, TX | 3.0 | 2.0 | 1565 | $1,795 | $1.15 | 1d | 1 | 0.46mi |
| 209 Lewald Ln Quinlan, TX | 3.0 | 2.0 | 1408 | $1,600 | $1.14 | 1d | 1 | 1.09mi |
Listing history 31 events
-
2026-06-18days on market $99,999 Active 37 DOM
-
2026-06-17days on market $99,999 Active 36 DOM
-
2026-06-16days on market $99,999 Active 35 DOM
-
2026-06-15days on market $99,999 Active 34 DOM
-
2026-06-13days on market $99,999 Active 32 DOM
-
2026-06-09days on market $99,999 Active 28 DOM
-
2026-06-08days on market $99,999 Active 27 DOM
-
2026-06-07pricedays on market $99,999 Active 26 DOM
-
2026-06-04days on market $129,999 Active 23 DOM
-
2026-06-03days on market $129,999 Active 22 DOM
-
2026-06-02days on market $129,999 Active 21 DOM
-
2026-06-01days on market $129,999 Active 20 DOM
-
2026-05-31days on market $129,999 Active 19 DOM
-
2026-05-18historical Active Option Contract 508-char remark
-
2026-05-08$129,999 Active 508-char remark
-
2026-04-01historical
-
2026-03-23price $129,999
-
2025-09-30price $149,999
-
2025-08-16$169,990 Active
-
2024-04-30historical
-
2024-04-03$199,900 Active
-
2018-12-07soldstatus
-
2018-12-05soldstatus Sold
-
2018-11-27status Pending
-
2018-07-05$70,000 Active
-
2013-09-30soldstatus Closed
-
2013-09-20status Pending
-
2013-09-11price $24,900
-
2013-08-13price $34,900
-
2013-07-17price $49,900
-
2013-06-11$64,900 Active
ⓘ Source: listings_history table (triggers on properties + properties_extension) + one-shot
backfill from property_details.listing_events for pre-trigger history.
Tax reassessment forecast TX · Resets to sale price
- Current annual tax
- $2,539 · $212/mo
- Projected year-2 tax
- $2,539 · $212/mo
- Expected delta
- $0/yr ($0/mo · 0.0%)
ⓘ Screening estimate from a state-policy table — verify with the county assessor before closing.
Climate risk First Street
- Flood 1/10 Low FEMA zone X (unshaded) · 0% chance over 30 yrs
- Wildfire 4/10 Moderate
- Heat 7/10 Severe 7 d/yr ≥110°F today · 24 d/yr by 30 yrs out
- Wind 6/10 Major 27% chance of damaging wind over 30 yrs
- Air quality 2/10 Low 0 unhealthy d/yr today · 1 by 30 yrs out
Nearby sold comps map
Loading sold comps map…
Walkable amenities ~0.75 mi
Loading nearby amenities…
Taxation est. · year 1
- Rental income
- $23,460
- − Mortgage interest
- −$5,601
- − Property taxes
- −$2,539
- − Insurance
- −$500
- − Repairs & maintenance
- −$1,877
- − Management
- −$1,877
- − Depreciation
- −$2,909
- Taxable income
- $8,157
- Est. tax owed @ 24.0%
- −$1,958
- After-tax cash flow
- $7,244/yr
For passive investors: Depreciation is non-cash, so a rental often shows a tax loss while cash-flowing — sheltering income. Rental losses are passive: they offset passive income freely, and up to $25,000/yr can offset ordinary (W-2) income if you actively participate and your MAGI is under $100k (phasing out to $0 by $150k); unused losses carry forward. On sale, claimed depreciation is recaptured at up to 25%, and gains may owe capital-gains tax (a 1031 exchange can defer both). Figures are a year-1 estimate at your 24.0% rate — not tax advice; consult a CPA.
Schools (NCES district)
- District
- Quinlan ISD
- NCES district ID
- 4836240
- Math proficiency
- 27% ▼ -10.00%
- Reading proficiency
- 34% ▼ -2.00%
- Median HH income
- $45,461
- Composite
- 26.16/100
- National rank
- #7271
- State rank
- #610 of 826 in TX
Livability — West Tawakoni
- Score
- 56/100
- State rank
- #1337
- US rank
- #23022
Category grades
Schools grade is shown separately in the Schools card above.
Census & demographics
- Census place
- West Tawakoni, TX
- County
- Hunt County · 71,969 people
- Metro
- Dallas-Fort Worth-Arlington, TX
- Population (ZIP)
- 17,671
- Household income
- $64,103
- Rent vs Own
- Severe rent burden
- 181.0
Population outlook (Hunt County) Hauer SSP2
- Today (2025)
- 97,090 people
- By 2030
- 100,452 · +3.5%
- By 2040
- 106,544 · +9.7%
- By 2050
- 111,218 · +14.6%
- By 2075
- 121,695 · +25.3%
- By 2100
- 123,683 · +27.4%
Race, ethnicity, and origin ACS 2023
- Neighborhood character
- Predominantly White (74%)
- Race & ethnicity
- White 74% Hispanic / Latino 19% Two or more races 8% Asian 1% Black 1%
- Hispanic origin (detail)
- Mexican 17%
- Common ancestry
- Lithuanian 2% Romanian 2% Iranian 1%
- Foreign-born
- 8% · Canada
- Languages at home
- 88% English-only · Spanish 10% Other Asian/Pacific 1%
Political lean MEDSL · Hunt
- 2024 margin
- Solid R (+55.5) · D 21.9% · R 77.4%
- 2008→2024 swing
- -14.9pp toward R · 2008: -40.6pp · 2024: -55.5pp
- All cycles
- 2024: R+55.5 2020: R+52.5 2016: R+56.3 2012: R+51.2 2008: R+40.6
Not yet ingested
- Civics
- —
Market trends
- HPI YoY
- ▲ 33.95%
- Current HPI
- 484.21
- Rent YoY
- —
- Metro
- Dallas-Fort Worth-Arlington, TX
- State GDP YoY
- ▲ 3.95%
- F500 in state
- 110
Industry mix (Fortune 500 HQ in TX)
| Industry | F500 HQs | Revenue |
|---|---|---|
| Energy | 16 | $1,198B |
|
||
| Technology | 5 | $198B |
|
||
| Engineering / Construction | 4 | $72B |
|
||
| Energy Services | 3 | $60B |
|
||
| Utilities | 3 | $41B |
|
||
| Healthcare | 2 | $330B |
|
||
Price history
+54.1% since first listed20 events — show timeline
- 2026-06-04 Price Changed $99,999 NTREIS
- 2026-05-24 Relisted — NTREIS
- 2026-05-18 Contingent — NTREIS
- 2026-05-08 Listed $129,999 NTREIS
- 2026-04-01 Listing Removed — NTREIS
- 2026-03-23 Price Changed $129,999 NTREIS
- 2025-09-30 Price Changed $149,999 NTREIS
- 2025-08-16 Listed $169,990 NTREIS
- 2024-04-30 Listing Removed — NTREIS
- 2024-04-03 Listed $199,900 NTREIS
- 2018-12-07 Sold (Public Records) — Public Records
- 2018-12-05 Sold (MLS) — NTREIS
- 2018-11-27 Pending — NTREIS
- 2018-07-05 Listed $70,000 NTREIS
- 2013-09-30 Sold (MLS) — NTREIS
- 2013-09-20 Pending — NTREIS
- 2013-09-11 Price Changed $24,900 NTREIS
- 2013-08-13 Price Changed $34,900 NTREIS
- 2013-07-17 Price Changed $49,900 NTREIS
- 2013-06-11 Listed $64,900 NTREIS
Property tax history
+2.4%/yrLatest (2025): $2,539 · -2.4% YoY. Source: county tax records.
Cash-flow waterfall
monthlySold comps — $/sqft
last 12 mo · ≤1 miLoading sold comps…