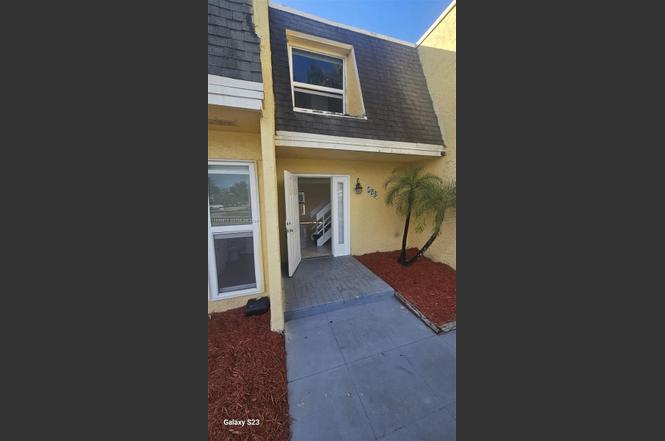
523 SW 1st Ct · Boynton Beach, FL
Flood risk 1/10 · Minimal
- FEMA flood zone
- X (unshaded)
- Chance of flooding over 30 yrs
- 0.0%
- Est. flood insurance / yr
- $507 – $1,088
Fire risk 1/10 · Minimal
- Est. fire insurance / yr
- $947 – $1,759
Heat risk 10/10 · Severe
- Hot days now (above 105°F)
- 7 days/yr
- Hot days in 30 yrs
- 27 days/yr
Wind risk 10/10 · Severe
- Chance of severe wind over 30 yrs
- 99.0%
Air-quality risk 2/10 · Minimal
- Unhealthy air days now
- 1 days/yr
- Unhealthy air days in 30 yrs
- 2 days/yr
Risk factors via First Street. Map © Google.
Why this score? — see what drove the C+ grade
The composite is a weighted blend of 9 inputs, each scored 0–100. Each bar is that input's sub-score; the figure is the points it added to the 100-point composite (weight × sub-score).
- Cash flow +25.1/30.0
- 1% rule +10.0/10.0
- DSCR +8.2/10.0
- ARV discount +7.5/15.0
- Schools +4.3/10.0
- Livability +3.6/5.0
- Rent growth +3.4/5.0
- Condition / age +2.5/5.0
- Appreciation +0.0/10.0
$160,000
🖨 Deal sheet 📄 Offer letter ✓ Due diligence
Listing remarks
IDEAL INVESTORS. VACANT PROPERTY. READY TO MOVE IN. FAST CLOSING. DEASTICALLY REDUCED. OWNER WILL CNSIDER ANY OFFER.
Key facts
- $750 HOA
- Parking
- Community pool
Property features AI
Finance
- Financial info: Pets allowed with restrictions or conditional (possible restrictions)
- HOA & community: Monthly association fee of $750; Association covers common areas; Community pool
Exterior
- Parking: One parking space
- Utilities: Public water and sewer; Electric service (central heating/cooling)
- Home design: Attached property; 2 stories; Entry on first floor; Effective year built
- Construction: Block construction
- Exterior features: Fence; Patio; Association pool
Interior
- Kitchen: Dishwasher; Electric range; Microwave
- Bedrooms: Upper-level primary
- Flooring: Carpet; Ceramic tile
- Bathrooms: 1 full bathroom; 1 half bathroom
- Heating & cooling: Central heating; Central air conditioning
- Interior features: First floor entry; Kitchen island; Upper-level primary bedroom
- Laundry & utility: Washer; Dryer
Neighborhood map
What this means for you Summary
Snapshot
- This is a 2-bed/1.5-bath condo listed at $160k.
Deal economics
- At list price, monthly cash flow is $355 ($4k/yr) — positive.
- The deal already cash-flows at list — no discount required.
- Meets the 1% rule at list price ($3k rent vs $160k).
- Recommended offer: $146k (9.0% below list) — sets the bar for market timing.
- Cap rate 9.0% vs local median 4.3% in Boynton Beach — top-decile yield for the area; either an underpriced asset or a hidden risk that comps aren't pricing in. Stress-test before assuming the spread holds.
Location & tenants
- Location reads 72/100 on livability (#351 in FL) — a middle-class / working-renter tenant base. Strengths: housing A+, health & safety B+, cost of living B; Watch: amenities D+, crime D-, commute F.
- Palm Beach (suburban): math 46% / reading 53% proficiency, ranked #34 of 73 in FL (top 47%) — families likely to look elsewhere, expect single-tenant / working-renter base with shorter leases.
- Market conditions: Rents rising (+3.6%/yr); 536 active listings in the ZIP; 40 comparable units currently listed for rent nearby; rentals at typical pace (median 25d on market — plan ~3-4 weeks tenant-placement turnaround); 3,974 units permitted in Palm Beach County in 2024 (1,012 in 5+ unit buildings).
- At $2,921/mo this rent would consume 52% of the median local household income ($68k/yr) (locally 1623% of renters already pay >50% of income on rent) — very limited rent-growth headroom before tenants either downsize or default.
Forward outlook
- Local home prices are declining (-3.0%/yr); year-one equity from $1k of loan paydown is wiped out by about $5k of value loss. Plan a longer hold.
- Palm Beach County population projected at +30% by 2050 — long-run rental-demand tailwind backs the buy-and-hold thesis.
- At projected returns (-3.0% appreciation + 3.6% rent growth), your $45k cash investment doubles in ~10 years — after that, you're playing with house money.
Negotiation context
- It's been on market 109 days — a 9% lower offer ($146k) is reasonable based on typical stale-listing flexibility.
- 14 sale attempts since 15y ago; this cycle's ask has dropped $35k (18%) from the opening price — seller is motivated, your offer sets the floor, not the list.
Risks & watch-outs
- Watch-outs: HOA is 26% of rent.
- Climate carrying-cost: severe wind risk, 99% chance of damaging wind over 30y; extreme-heat days projected 7→27/yr by 2055 (HVAC capex compounding) — expect insurance premiums to compound above CPI over the hold.
Questions for the listing agent
- It's been on market 109 days. Have you received any prior offers? Is the seller open to a 9% concession, seller financing, or rate buy-down credit?
- Built in 1974 — when were the roof, HVAC, electrical panel, plumbing, and water heater last replaced?
- What does the HOA fee cover, when was the last increase, and are there any pending special assessments or reserve-fund shortfalls?
- Any open or pending special assessments — roof, HVAC, plumbing, elevator, façade? What's the per-unit balance and payoff schedule, and is the seller paying it off at close or rolling it to the buyer?
- Why hasn't it sold? Are there any deal-killer items the seller is aware of (foundation, flood, title, zoning, code violations)?
- Is there a deadline driving the sale (1031 exchange, divorce, estate, relocation)? That informs how much negotiation room exists.
- Crime grade is D in this area — have there been break-ins, vandalism, or insurance claims at this property in the last 3 years? What carrier currently insures it and at what premium?
- What's the average days-on-market for RENTAL listings here right now (not sales)? A rising rental-DOM trend means longer vacancies and softer asking-rent achievability than the comps imply.
- What's the recent tenant-quality profile in this submarket — average credit score on applications, eviction rate, late-payment / NSF rate, and stable-employment percentage? A property-management company in the area should have these aggregated.
- How much new apartment / multifamily construction is in the pipeline within 1–3 miles? Heavy new supply (>2% of stock underway) typically softens rents 12–24 months out; light construction supports rent growth.
Investment metrics
- 1% rule
- 1.83% ✓
- Cap rate
- 8.96%
- Cash-on-cash
- 9.52%
- DSCR
- 1.42
- GRM
- 4.6
CMA / ARV
No comps found within radius.
Projected returns pro-forma
-3.0% appreciation · 3.64% rent growth · sell at horizon
- IRR
- -0.5%
- Equity multiple
- 0.98×
- Total profit
- $-828
- Equity at exit
- $23,857
- IRR
- 10.5%
- Equity multiple
- 1.86×
- Total profit
- $38,597
- Equity at exit
- $13,834
Cash invested: $44,800 (down + closing). Projections, not guarantees.
Landlord ↔ Tenant lean methodology
- Overall (STATE)
- 87 Strongly Landlord-Friendly
- State Florida
- 87 Strongly Landlord-Friendly · R+3
- County
- — inherits STATE
- City
- — inherits STATE
ZIP-level market 33435
- Rents YoY
- 3.6%
- Active inventory
- 536
- Price-to-rent
- 4.6×
Monthly cashflow live
- Estimated rent
- $2,921 high interval (Pro) →
- Mortgage (P&I)
- −$839
- Tax from tax record
- −$297 /mo · $3,560/yr
- Insurance
- −$67
- HOA
- −$750
- Vacancy / Maint / Mgmt
- −$613
- Net cashflow
- $355
Break-even live
UW: 25.0% down · 7.5% · 30yr · 1.5% tax · 5.0% vac · 8.0% maint · 8.0% mgmt
Financing live
Cash to close
- Down payment
- $40,000
- Closing costs
- $4,800
- Reserves months
- —
- Total cash needed
- —
Loan-product check · same deal, 3 products live
Conventional
25% down · 7.5% · 30yr
- Down + closing
- —
- Monthly P&I
- —
- Monthly cashflow
- —
- DSCR
- —
- Eligible?
- —
Personal DTI + credit; lowest rate.
DSCR
20% down · 8.5% · 30yr
- Down + closing
- —
- Monthly P&I
- —
- Monthly cashflow
- —
- DSCR
- —
- Eligible?
- —
No personal income docs; deal must DSCR.
Hard money
10% down · 12.0% · 12mo
- Down + closing
- —
- Monthly P&I
- —
- Monthly cashflow
- —
- DSCR
- —
- Eligible?
- —
Short-term bridge; refi at stabilization.
Rent comps 40 comps
| Address | Beds | Baths | Sqft | Rent | $/sqft | DOM | Units | Dist |
|---|---|---|---|---|---|---|---|---|
| 605 SW 1st Ct Boynton Beach, FL | 2.0 | 1.5 | 1248 | $2,050 | $1.64 | 24d | 1 | 0.04mi |
| 113 SE 8th Ave Boynton Beach, FL | 3.0 | 2.0 | 1002 | $3,050 | $3.04 | 22d | 1 | 0.21mi |
| 115 SW 1st Ave Boynton Beach, FL | 1.0–2.0 | 1.0–2.0 | 804 | $2,250 | $2.80 | 15d | 2 | 0.24mi |
| 217 SE 2nd Ave Boynton Beach, FL | 2.0 | 2.0 | 832 | $2,900 | $3.49 | 24d | 1 | 0.29mi |
| 127 SW 10th Ave Boynton Beach, FL | 2.0 | 1.5 | 754 | $3,500 | $4.64 | 15d | 1 | 0.29mi |
| 140 SE 9th Ave Boynton Beach, FL | 3.0 | 2.0 | 1292 | $3,250 | $2.52 | 17d | 1 | 0.31mi |
| 140 SE 9th Ave Boynton Beach, FL | 3.0 | 2.0 | 1292 | $3,000 | $2.32 | 8d | 1 | 0.31mi |
| 140 SE 9th Ave Unit 140 Boynton Beach, FL | 3.0 | 2.0 | 1292 | $3,250 | $2.52 | 14d | 1 | 0.31mi |
| 222 SE 3rd St Boynton Beach, FL | 3.0 | 2.0 | 1466 | $3,600 | $2.46 | 24d | 1 | 0.33mi |
| 701 SE 4th St Apt W Boynton Beach, FL | 2.0 | 1.0 | 924 | $2,200 | $2.38 | 24d | 1 | 0.35mi |
| 1006 SE 4th St Boynton Beach, FL | 2.0 | 1.0 | 900 | $2,300 | $2.56 | 24d | 1 | 0.45mi |
| 101 S Federal Hwy Boynton Beach, FL | 1.0–2.0 | 1.0–2.0 | 969 | $2,794 | $2.88 | 2d | 17 | 0.46mi |
| 226 SW 13th Ave Unit 226 Boynton Beach, FL | 3.0 | 2.0 | 1284 | $3,999 | $3.11 | 24d | 1 | 0.50mi |
| 1351 S Federal Hwy Boynton Beach, FL | 1.0–3.0 | 1.0–2.0 | 1394 | $3,046 | $2.18 | 2d | 32 | 0.55mi |
| 100 NE 6th St Boynton Beach, FL | 1.0 | 1.0 | 745 | $2,975 | $3.99 | 20d | 3 | 0.63mi |
| 100 NE 6th St Boynton Beach, FL | 1.0 | 1.0 | 745 | $2,975 | $3.99 | 12d | 3 | 0.63mi |
| 624 Snug Harbor Dr Unit B7 Boynton Beach, FL | 2.0 | 2.0 | 858 | $1,950 | $2.27 | 24d | 1 | 0.64mi |
| 625 Casa Loma Blvd #1504 Boynton Beach, FL | 2.0 | 2.0 | 1130 | $3,500 | $3.10 | 24d | 1 | 0.65mi |
| 625 Casa Loma Blvd #304 Boynton Beach, FL | 2.0 | 2.0 | 1130 | $4,500 | $3.98 | 5d | 1 | 0.65mi |
| 625 Casa Loma Blvd #705 Boynton Beach, FL | 2.0 | 2.0 | 1206 | $2,750 | $2.28 | 22d | 1 | 0.65mi |
| 625 Casa Loma Blvd #207 Boynton Beach, FL | 1.0 | 1.0 | 782 | $2,200 | $2.81 | 2d | 1 | 0.65mi |
| 625 Casa Loma Blvd #304 Boynton Beach, FL | 2.0 | 2.0 | 1130 | $4,500 | $3.98 | 19d | 1 | 0.65mi |
| 625 Casa Loma Blvd #1206 Boynton Beach, FL | 2.0 | 2.0 | 1206 | $3,650 | $3.03 | 24d | 1 | 0.65mi |
| 625 Casa Loma Blvd #1507 Boynton Beach, FL | 1.0 | 1.0 | 782 | $2,400 | $3.07 | 24d | 1 | 0.65mi |
| 350 N Federal Hwy #9 Boynton Beach, FL | 2.0 | 2.0 | 1350 | $4,500 | $3.33 | 24d | 1 | 0.65mi |
| 450 N Federal Hwy Boynton Beach, FL | 2.0 | 2.0–2.5 | 1439 | $3,450 | $2.40 | 17d | 2 | 0.65mi |
| 405 SE 20th Ave Unit 12E Boynton Beach, FL | 2.0 | 1.0 | 975 | $1,889 | $1.94 | 24d | 1 | 0.66mi |
| 350 N Federal Hwy Boynton Beach, FL | 2.0 | 2.0 | 1289 | $3,550 | $2.75 | 11d | 3 | 0.66mi |
| 638 Snug Harbor Dr Boynton Beach, FL | 1.0–2.0 | 1.0–2.0 | 747 | $2,300 | $3.08 | 24d | 2 | 0.67mi |
| 740 E Ocean Ave #407 Boynton Beach, FL | 2.0 | 2.0 | 908 | $2,800 | $3.08 | 24d | 1 | 0.68mi |
| 700 E Boynton Beach Blvd #405 Boynton Beach, FL | 2.0 | 2.0 | 1200 | $3,495 | $2.91 | 19d | 1 | 0.69mi |
| 700 E Boynton Beach Blvd #1509 Boynton Beach, FL | 2.0 | 2.0 | 1129 | $4,200 | $3.72 | 24d | 1 | 0.69mi |
| 700 E Boynton Beach Blvd #203 Boynton Beach, FL | 2.0 | 2.0 | 1130 | $2,650 | $2.35 | 24d | 1 | 0.69mi |
| 700 E Boynton Beach Blvd #1203 Boynton Beach, FL | 2.0 | 2.0 | 1130 | $4,000 | $3.54 | 24d | 1 | 0.69mi |
| 700 E Boynton Beach Blvd #105 Boynton Beach, FL | 1.0 | 1.0 | 762 | $2,100 | $2.76 | 24d | 1 | 0.69mi |
| 700 E Boynton Beach Blvd #510 Boynton Beach, FL | 2.0 | 2.0 | 1153 | $3,000 | $2.60 | 24d | 1 | 0.69mi |
| 700 E Boynton Beach Blvd #1408 Boynton Beach, FL | 3.0 | 2.0 | 1385 | $3,500 | $2.53 | 24d | 1 | 0.69mi |
| 700 E Boynton Beach Blvd #1007 Boynton Beach, FL | 1.0 | 1.0 | 782 | $3,950 | $5.05 | 24d | 1 | 0.69mi |
| 700 E Boynton Beach Blvd #511 Boynton Beach, FL | 2.0 | 2.0 | 1153 | $5,000 | $4.34 | 24d | 1 | 0.69mi |
| 700 E Boynton Beach Blvd #1507 Boynton Beach, FL | 1.0 | 1.0 | 782 | $3,800 | $4.86 | 24d | 1 | 0.69mi |
HOA detail condo
- Monthly dues
- $750 · $9,000/yr
- Assessments
- None detected in remarks — confirm with the listing agent.
Listing history 46 events
-
2026-05-06status Pending
-
2026-03-30price $160,000
-
2026-03-13price $165,000
-
2026-02-26price $168,900
-
2026-02-13price $175,000
-
2026-01-26price $189,900
-
2026-01-16$195,000 Active
-
2025-03-27historical $2,100
-
2025-03-12$210,000 Active
-
2025-03-01historical
-
2025-01-30price $2,100
-
2025-01-29price $199,000
-
2024-12-18$2,200
-
2024-12-18status Active
-
2024-11-22historical $2,200
-
2024-11-21status Pending
-
2024-11-18$2,200
-
2024-11-06price $210,000
-
2024-10-10price $205,000
-
2024-08-06status Active
-
2024-07-26historical $2,100
-
2024-07-19status Pending
-
2024-07-03price $2,100
-
2024-06-19status Active
-
2024-06-19price $195,000
-
2024-05-24$2,200
-
2024-04-27price $220,000
-
2024-04-16price $224,000
-
2024-03-29price $224,500
-
2024-02-12price $225,000
-
2024-01-09price $232,900
-
2023-11-30status Active
-
2023-08-12status Pending
-
2023-08-03$235,000 Active
-
2022-03-23soldstatus $151,000
-
2022-03-08soldstatus $151,000 Closed
-
2021-12-27status Pending
-
2021-11-23status Active
-
2021-11-10historical Active Under Contract
-
2021-11-02status Active
-
2021-10-29historical Active Under Contract
-
2021-10-26$149,000 Active
-
2016-09-23soldstatus $78,000
-
2011-06-09soldstatus $28,200
-
2011-05-11historical
-
2011-05-02$25,000
ⓘ Source: listings_history table (triggers on properties + properties_extension) + one-shot
backfill from property_details.listing_events for pre-trigger history.
Tax reassessment forecast FL · Resets to sale price
- Current annual tax
- $3,560 · $297/mo
- Projected year-2 tax
- $3,560 · $297/mo
- Expected delta
- $0/yr ($0/mo · 0.0%)
ⓘ Screening estimate from a state-policy table — verify with the county assessor before closing.
Climate risk First Street
- Flood 1/10 Low FEMA zone X (unshaded) · 0% chance over 30 yrs
- Wildfire 1/10 Low
- Heat 10/10 Extreme 7 d/yr ≥105°F today · 27 d/yr by 30 yrs out
- Wind 10/10 Extreme 99% chance of damaging wind over 30 yrs
- Air quality 2/10 Low 1 unhealthy d/yr today · 2 by 30 yrs out
Nearby sold comps map
Loading sold comps map…
Walkable amenities ~0.75 mi
Loading nearby amenities…
Taxation est. · year 1
- Rental income
- $35,057
- − Mortgage interest
- −$8,962
- − Property taxes
- −$3,560
- − Insurance
- −$800
- − Repairs & maintenance
- −$2,805
- − Management
- −$2,805
- − HOA
- −$9,000
- − Depreciation
- −$4,655
- Taxable income
- $2,470
- Est. tax owed @ 24.0%
- −$593
- After-tax cash flow
- $3,673/yr
For passive investors: Depreciation is non-cash, so a rental often shows a tax loss while cash-flowing — sheltering income. Rental losses are passive: they offset passive income freely, and up to $25,000/yr can offset ordinary (W-2) income if you actively participate and your MAGI is under $100k (phasing out to $0 by $150k); unused losses carry forward. On sale, claimed depreciation is recaptured at up to 25%, and gains may owe capital-gains tax (a 1031 exchange can defer both). Figures are a year-1 estimate at your 24.0% rate — not tax advice; consult a CPA.
Schools (NCES district)
- District
- Palm Beach
- NCES district ID
- 1201500
- Math proficiency
- 46% ▼ -16.00%
- Reading proficiency
- 53% ▼ -4.00%
- Median HH income
- $53,943
- Composite
- 42.72/100
- National rank
- #3160
- State rank
- #34 of 73 in FL
Livability — Boynton Beach
- Score
- 72/100
- State rank
- #351
- US rank
- #6098
Category grades
Schools grade is shown separately in the Schools card above.
Census & demographics
- Census place
- Boynton Beach, FL
- County
- Palm Beach County · 1,438,312 people
- City population
- 148,060
- Metro
- Miami-Fort Lauderdale-Pompano Beach, FL
- Population (ZIP)
- 37,833
- Household income
- $67,979
- Rent vs Own
- Severe rent burden
- 1623.0
Population outlook (Palm Beach County) Hauer SSP2
- Today (2025)
- 1,637,487 people
- By 2030
- 1,743,255 · +6.5%
- By 2040
- 1,948,712 · +19.0%
- By 2050
- 2,132,979 · +30.3%
- By 2075
- 2,530,027 · +54.5%
- By 2100
- 2,706,979 · +65.3%
Race, ethnicity, and origin ACS 2023
- Neighborhood character
- Diverse neighborhood (Simpson 0.65)
- Race & ethnicity
- White 41% Black 40% Hispanic / Latino 15% Two or more races 10%
- Hispanic origin (detail)
- Mexican 3% Puerto Rican 3% Cuban 2% Dominican 1%
- Common ancestry
- Hispanic 23% Romanian 2% Lithuanian 2%
- Foreign-born
- 30% · Canada, Jamaica
- Languages at home
- 61% English-only · French/Haitian/Cajun 24% Spanish 11% Other Indo-European 2%
Political lean MEDSL · Palm Beach
- 2024 margin
- Toss-up / Even · D 50.0% · R 49.2%
- 2008→2024 swing
- -22.1pp toward R · 2008: 22.9pp · 2024: 0.8pp
- All cycles
- 2024: D+0.8 2020: D+12.8 2016: D+15.3 2012: D+17.0 2008: D+22.9
Not yet ingested
- Civics
- —
Market trends
- HPI YoY
- ▼ -345.86%
- Current HPI
- 371.0527
- Rent YoY
- ▲ 3.64%
- Metro
- Miami-Fort Lauderdale-Pompano Beach, FL
- State GDP YoY
- ▲ 3.28%
- F500 in state
- 36
Industry mix (Fortune 500 HQ in FL)
| Industry | F500 HQs | Revenue |
|---|---|---|
| Industrial Technology | 2 | $29B |
|
||
| Insurance | 2 | $17B |
|
||
| Retail | 1 | $60B |
|
||
| Technology Distribution | 1 | $58B |
|
||
| Homebuilding | 1 | $35B |
|
||
| Technology Manufacturing | 1 | $35B |
|
||
Price history
+540.0% since first listed46 events — show timeline
- 2026-05-06 Pending — MARMLS
- 2026-03-30 Price Changed $160,000 MARMLS
- 2026-03-13 Price Changed $165,000 MARMLS
- 2026-02-26 Price Changed $168,900 MARMLS
- 2026-02-13 Price Changed $175,000 MARMLS
- 2026-01-26 Price Changed $189,900 MARMLS
- 2026-01-16 Listed $195,000 MARMLS
- 2025-03-27 Rental Removed $2,100 MARMLS
- 2025-03-12 Listed $210,000 MARMLS
- 2025-03-01 Listing Removed — MARMLS
- 2025-01-30 Price Changed $2,100 MARMLS
- 2025-01-29 Price Changed $199,000 MARMLS
- 2024-12-18 Listed for Rent $2,200 MARMLS
- 2024-12-18 Relisted — MARMLS
- 2024-11-22 Rental Removed $2,200 MARMLS
- 2024-11-21 Pending — MARMLS
- 2024-11-18 Listed for Rent $2,200 MARMLS
- 2024-11-06 Price Changed $210,000 MARMLS
- 2024-10-10 Price Changed $205,000 MARMLS
- 2024-08-06 Relisted — MARMLS
- 2024-07-26 Rental Removed $2,100 MARMLS
- 2024-07-19 Pending — MARMLS
- 2024-07-03 Price Changed $2,100 MARMLS
- 2024-06-19 Relisted — MARMLS
- 2024-06-19 Price Changed $195,000 MARMLS
- 2024-05-24 Listed for Rent $2,200 MARMLS
- 2024-04-27 Price Changed $220,000 MARMLS
- 2024-04-16 Price Changed $224,000 MARMLS
- 2024-03-29 Price Changed $224,500 MARMLS
- 2024-02-12 Price Changed $225,000 MARMLS
- 2024-01-09 Price Changed $232,900 MARMLS
- 2023-11-30 Relisted — MARMLS
- 2023-08-12 Pending — MARMLS
- 2023-08-03 Listed $235,000 MARMLS
- 2022-03-23 Sold (Public Records) $151,000 Public Records
- 2022-03-08 Sold (MLS) $151,000 MARMLS
- 2021-12-27 Pending — MARMLS
- 2021-11-23 Relisted — MARMLS
- 2021-11-10 Contingent — MARMLS
- 2021-11-02 Relisted — MARMLS
- 2021-10-29 Contingent — MARMLS
- 2021-10-26 Listed $149,000 MARMLS
- 2016-09-23 Sold (Public Records) $78,000 Public Records
- 2011-06-09 Sold (MLS) $28,200 Beaches MLS
- 2011-05-11 Listing Removed — Beaches MLS
- 2011-05-02 Listed $25,000 Beaches MLS
Property tax history
+12.0%/yrLatest (2025): $3,560 · +4.4% YoY. Source: county tax records.
Cash-flow waterfall
monthlySold comps — $/sqft
last 12 mo · ≤1 miLoading sold comps…