 Fourplex
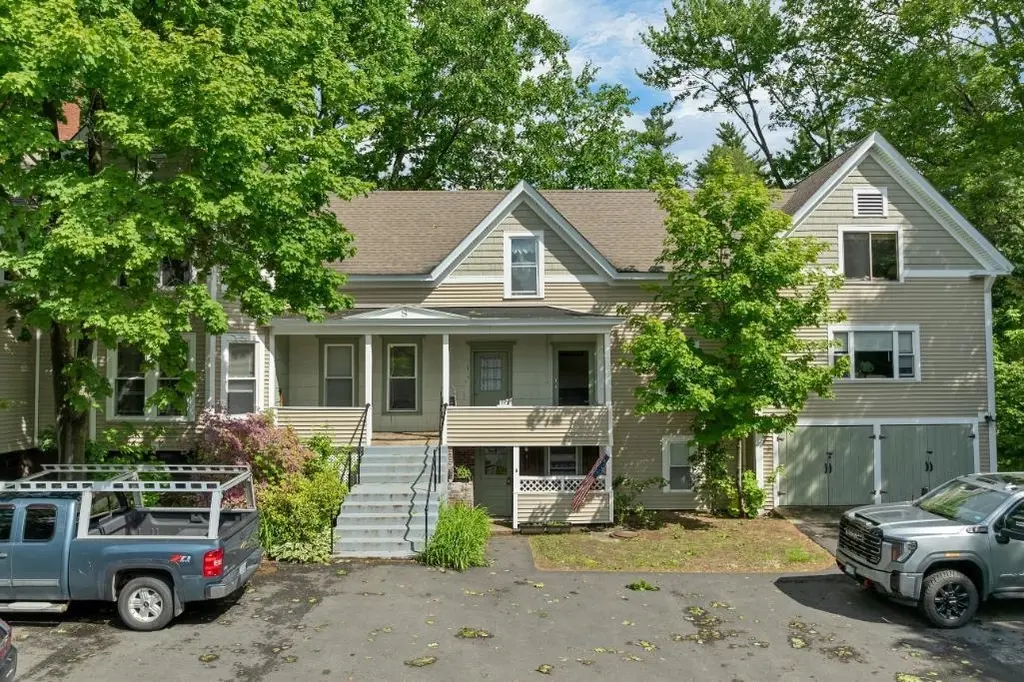
8 Lewis St · Laconia, NH
Flood risk 1/10 · Minimal
- FEMA flood zone
- X
- Chance of flooding over 30 yrs
- 0.0%
- Est. flood insurance / yr
- $473 – $860
Fire risk 1/10 · Minimal
- Est. fire insurance / yr
- $507 – $941
Heat risk 3/10 · Minor
- Hot days now (above 92°F)
- 7 days/yr
- Hot days in 30 yrs
- 16 days/yr
Wind risk 4/10 · Minor
- Chance of severe wind over 30 yrs
- 10.0%
Air-quality risk 2/10 · Minimal
- Unhealthy air days now
- 1 days/yr
- Unhealthy air days in 30 yrs
- 1 days/yr
Risk factors via First Street. Map © Google.
Why this score? — see what drove the F grade
The composite is a weighted blend of 9 inputs, each scored 0–100. Each bar is that input's sub-score; the figure is the points it added to the 100-point composite (weight × sub-score).
- Cash flow +10.9/30.0
- Rent growth +5.0/5.0
- Livability +4.0/5.0
- DSCR +3.2/10.0
- Condition / age +2.5/5.0
- 1% rule +2.4/10.0
- Schools +2.4/10.0
- ARV discount +0.0/15.0
- Appreciation +0.0/10.0
$975,000
🖨 Deal sheet 📄 Offer letter ✓ Due diligence
Multi-family units
County records classify this as Multi-Family (5+ Unit). Listing-text estimate: 4 units. estimate disagrees with records
5+ unit building — per-unit beds/baths from public records are typically unavailable; the breakdown below (if shown) is an estimate from the listing text.
Listing remarks
Exceptional investment opportunity (8%+ ROI) in the heart of Laconia. This five-unit multifamily property offers a diverse mix of apartments ranging from a spacious four-bedroom unit to a studio, providing broad tenant appeal and excellent rental flexibility. Ideally situated on a quiet side street, the property is within walking distance of downtown Laconia, shopping, restaurants, schools, parks, and everyday conveniences. One of its most attractive features is its proximity to the public beach on beautiful Lake Opechee, allowing tenants to enjoy swimming, kayaking, fishing, and lakeside relaxation just a short stroll from home. The varied unit mix appeals to a wide range of tenants, from
Key facts
- Close to restaurants
- Multifamily property
- Close to shopping
Tags
Property features AI
Finance
- Other: Approximate total finished area and overall area recorded (internal records); Lot recorded as 18 (units/parcel identifier)
- Financial info: Month-to-month leases for most units (Units 1, 3, 5); Unit 4 on an annual lease; Total units: 5 (two 1-bed, one 2-bed, two 3+ bed); Net income reported: $80,325; Operating expenses include insurance, maintenance, and utilities
Exterior
- Parking: 1-car garage
- Utilities: Public water; Public sewer; Circuit breaker electric; Cable and phone available; Fiber optic internet available
- Home design: New Englander architectural style; Existing structure; Tan exterior color
- Construction: Built in 1887; Wood frame construction; Asphalt shingle roof; Partial basement
- Exterior features: Corner city lot; Neighborhood setting; Beach access and water access to Lake Opechee (municipal residents only); Water view of Opechee Bay; Paved driveway; Public maintained road frontage (approx. 263 ft)
Interior
- Bedrooms: Unit 1: 4 bedrooms (Level 1); Unit 2: 3 bedrooms; Unit 3: 1 bedroom; Unit 4: 2 bedrooms; Unit 5: 1 bedroom
- Flooring: Carpet; Vinyl
- Bathrooms: Total of 6 full bathrooms across units; Unit 1: 2 baths; Unit 2: 1 bath; Unit 3: 1 bath; Unit 4: 1 bath; Unit 5: 1 bath
- Heating & cooling: Hot water heating; Individual cooling for units
- Interior features: Partial basement with interior access; Carpet and vinyl flooring
Neighborhood map
What this means for you Summary
Snapshot
- This is a 4 × 2-bed/?-bath units multifamily listed at $975k.
Deal economics
- At list price, monthly cash flow is $-419 ($-5k/yr) — negative. Per door: $-105/mo.
- To cash-flow at today's rent, offer at most $901k (7.6% below list).
- To meet the 1% rule (rent ≥ 1% of price), the offer needs to be $722k (25.9% below list).
- Recommended offer: $722k (25.9% below list) — sets the bar for 1% rule.
- Cap rate 5.8% vs local median 1.8% in Laconia — top-decile yield for the area; either an underpriced asset or a hidden risk that comps aren't pricing in. Stress-test before assuming the spread holds.
Location & tenants
- Location reads 79/100 on livability (#20 in NH, #2,314 nationally) — a middle-class / working-renter tenant base. Strengths: cost of living A+, housing A+, health & safety A+; Watch: commute F.
- Laconia School District (town): math 24% / reading 31% proficiency, ranked #89 of 98 in NH (top 91%) — low school quality limits family demand, transient renter base, plan for 1-2y turnover.
- Zoned schools: Pleasant Street School (math 22% / reading 37%, grade F, #201 of 263 statewide, top 82%, 266 students, 46% FRL) — zoned schools at 46% FRL track the district average.
- Market conditions: Rents rising fast (+21.6%/yr); 188 active listings in the ZIP; 301 units permitted in Belknap County in 2024 (32 in 5+ unit buildings).
- At $7,222/mo this rent would consume 118% of the median local household income ($73k/yr) (locally 722% of renters already pay >50% of income on rent) — very limited rent-growth headroom before tenants either downsize or default.
Forward outlook
- Local home prices are declining (-3.0%/yr); year-one equity from $7k of loan paydown is wiped out by about $29k of value loss. Plan a longer hold.
- Belknap County population projected at -10% by 2050 — secular population decline; favor cash flow + early exit over multi-decade hold.
Negotiation context
- It's been on market 16 days — a 2% lower offer ($960k) is reasonable based on typical stale-listing flexibility.
- Current owner paid $90k; list at $975k implies a 977% gain — meaningful room to come down on a strong offer.
Risks & watch-outs
- Watch-outs: built in 1887 — expect roof / HVAC / electrical / plumbing capex.
Questions for the listing agent
- What do current leases actually rent for vs. the listed asking? Can we see a recent rent roll and the last 12 months of T-12 income?
- Can we see the unit-by-unit rent roll, current vacancy, and any below-market leases? What's the average tenancy length?
- What capital expenditures (roof, boiler, parking lot, exteriors) have been made in the last 5 years, and what's planned in the next 2?
- Built in 1887 — when were the roof, HVAC, electrical panel, plumbing, and water heater last replaced?
- Is there a deadline driving the sale (1031 exchange, divorce, estate, relocation)? That informs how much negotiation room exists.
- Schools are D-rated, which usually means shorter tenancies and higher turnover. Who's the typical renter profile here, and what's been the actual vacancy rate?
- The area grade is low — what's the realistic commute time and amenity access for the typical tenant pool here? Any planned neighborhood developments (good or bad) we should know about?
- What's the average days-on-market for RENTAL listings here right now (not sales)? A rising rental-DOM trend means longer vacancies and softer asking-rent achievability than the comps imply.
- What's the recent tenant-quality profile in this submarket — average credit score on applications, eviction rate, late-payment / NSF rate, and stable-employment percentage? A property-management company in the area should have these aggregated.
- How much new apartment / multifamily construction is in the pipeline within 1–3 miles? Heavy new supply (>2% of stock underway) typically softens rents 12–24 months out; light construction supports rent growth.
Investment metrics
- 1% rule
- 0.74% ✗
- Cap rate
- 5.78%
- Cash-on-cash
- -1.84%
- DSCR
- 0.92
- GRM
- 11.3
CMA / ARV
- ARV (on-the-fly)
- $752,940
- Comps found
- 1
Show comp detail 1 sale within ~0.75 mi
| Address | Dist | Beds/Ba | Sqft | Sold | Price | $/sf | Match |
|---|---|---|---|---|---|---|---|
| 24 McGrath St | 0.66mi | 10/7.0 (+1) | 4,089 (-3%) | 7mo | $726,500 | $178 | 45 |
Match score weights: distance 35% · size 25% · config 20% · recency 20%. Top-matched comps best support the ARV.
Projected returns pro-forma
-3.0% appreciation · 8.0% rent growth · sell at horizon
- IRR
- -14.4%
- Equity multiple
- 0.46×
- Total profit
- $-146,793
- Equity at exit
- $145,376
- IRR
- 0.5%
- Equity multiple
- 1.04×
- Total profit
- $10,418
- Equity at exit
- $84,300
Cash invested: $273,000 (down + closing). Projections, not guarantees.
Landlord ↔ Tenant lean methodology
- Overall (STATE)
- 56 Moderately Landlord-Leaning
- State New Hampshire
- 56 Moderately Landlord-Leaning · D+1
- County
- — inherits STATE
- City
- — inherits STATE
ZIP-level market 03246
- Home prices YoY
- -19.8%
- Rents YoY
- 21.6%
- Active inventory
- 188
- Price-to-rent
- 45.0×
Monthly cashflow live
- Estimated rent
- $7,222 high interval (Pro) →
- Mortgage (P&I)
- −$5,113
- Tax from tax record
- −$605 /mo · $7,264/yr
- Insurance
- −$406
- HOA
- −$0
- Vacancy / Maint / Mgmt
- −$1,517
- Net cashflow
- $-419
Break-even live
4-unit breakdown (identical units grouped — click to expand)
| Units | Beds | Baths | Est. rent |
|---|---|---|---|
| 4× units | 2 | — | $7,224 |
| #1 | 2 | — | $1,806 |
| #2 | 2 | — | $1,806 |
| #3 | 2 | — | $1,806 |
| #4 | 2 | — | $1,806 |
| Total (4 units) | $7,222 | ||
UW: 25.0% down · 7.5% · 30yr · 1.5% tax · 5.0% vac · 8.0% maint · 8.0% mgmt
Financing live
Cash to close
- Down payment
- $243,750
- Closing costs
- $29,250
- Reserves months
- —
- Total cash needed
- —
Loan-product check · same deal, 3 products live
Conventional
25% down · 7.5% · 30yr
- Down + closing
- —
- Monthly P&I
- —
- Monthly cashflow
- —
- DSCR
- —
- Eligible?
- —
Personal DTI + credit; lowest rate.
DSCR
20% down · 8.5% · 30yr
- Down + closing
- —
- Monthly P&I
- —
- Monthly cashflow
- —
- DSCR
- —
- Eligible?
- —
No personal income docs; deal must DSCR.
Hard money
10% down · 12.0% · 12mo
- Down + closing
- —
- Monthly P&I
- —
- Monthly cashflow
- —
- DSCR
- —
- Eligible?
- —
Short-term bridge; refi at stabilization.
Listing history 12 events
-
2026-06-19days on market $975,000 Active 16 DOM
-
2026-06-18days on market $975,000 Active 15 DOM
-
2026-06-17days on market $975,000 Active 14 DOM
-
2026-06-16days on market $975,000 Active 13 DOM
-
2026-06-15days on market $975,000 Active 12 DOM
-
2026-06-14days on market $975,000 Active 10 DOM
-
2026-06-12days on market $975,000 Active 9 DOM
-
2026-06-09days on market $975,000 Active 6 DOM
-
2026-06-08days on market $975,000 Active 5 DOM
-
2026-06-07days on market $975,000 Active 4 DOM
-
2026-06-04remarks 699-char remark
-
2026-06-04$975,000 Active 1 DOM
ⓘ Source: listings_history table (triggers on properties + properties_extension) + one-shot
backfill from property_details.listing_events for pre-trigger history.
Tax reassessment forecast NH · Partial reset (capped growth)
- Current annual tax
- $7,264 · $605/mo
- Projected year-2 tax
- $14,260 · $1,188/mo
- Expected delta
- +$6,996/yr (+$583/mo · 96.3%)
ⓘ Screening estimate from a state-policy table — verify with the county assessor before closing.
Climate risk First Street
- Flood 1/10 Low FEMA zone X · 0% chance over 30 yrs
- Wildfire 1/10 Low
- Heat 3/10 Moderate 7 d/yr ≥92°F today · 16 d/yr by 30 yrs out
- Wind 4/10 Moderate 10% chance of damaging wind over 30 yrs
- Air quality 2/10 Low 1 unhealthy d/yr today · 1 by 30 yrs out
Nearby sold comps map
Loading sold comps map…
Walkable amenities ~0.75 mi
Loading nearby amenities…
Taxation est. · year 1
- Rental income
- $86,664
- − Mortgage interest
- −$54,615
- − Property taxes
- −$7,264
- − Insurance
- −$4,875
- − Repairs & maintenance
- −$6,933
- − Management
- −$6,933
- − Depreciation
- −$28,364
- Taxable loss
- −$22,320
- Est. tax savings @ 24.0%
- +$5,357
- After-tax cash flow
- $326/yr
For passive investors: Depreciation is non-cash, so a rental often shows a tax loss while cash-flowing — sheltering income. Rental losses are passive: they offset passive income freely, and up to $25,000/yr can offset ordinary (W-2) income if you actively participate and your MAGI is under $100k (phasing out to $0 by $150k); unused losses carry forward. On sale, claimed depreciation is recaptured at up to 25%, and gains may owe capital-gains tax (a 1031 exchange can defer both). Figures are a year-1 estimate at your 24.0% rate — not tax advice; consult a CPA.
Schools (NCES district)
- District
- Laconia School District
- NCES district ID
- 3304140
- Math proficiency
- 24% ▼ -8.00%
- Reading proficiency
- 31% ▼ -7.00%
- Median HH income
- $49,155
- Composite
- 24.03/100
- National rank
- #7770
- State rank
- #89 of 98 in NH
Livability — Laconia
- Score
- 79/100
- State rank
- #20
- US rank
- #2314
Category grades
Schools grade is shown separately in the Schools card above.
Census & demographics
- Census place
- Laconia, NH
- County
- Belknap County · 17,103 people
- City population
- 17,103
- Metro
- Laconia, NH
- Population (ZIP)
- 17,103
- Household income
- $73,241
- Rent vs Own
- Severe rent burden
- 722.0
Population outlook (Belknap County) Hauer SSP2
- Today (2025)
- 60,702 people
- By 2030
- 60,353 · -0.6%
- By 2040
- 58,264 · -4.0%
- By 2050
- 54,533 · -10.2%
- By 2075
- 45,622 · -24.8%
- By 2100
- 33,772 · -44.4%
Race, ethnicity, and origin ACS 2023
- Neighborhood character
- Predominantly White (90%)
- Race & ethnicity
- White 90% Two or more races 4% Hispanic / Latino 3% Asian 1%
- Common ancestry
- Lithuanian 17% Slovak 2% Romanian 2%
- Foreign-born
- 3% · Canada
- Languages at home
- 95% English-only · Spanish 2% French/Haitian/Cajun 2% Other Indo-European 1%
Political lean MEDSL · Belknap
- 2024 margin
- R (+13.1) · D 43.1% · R 56.1%
- 2008→2024 swing
- -14.2pp toward R · 2008: 1.2pp · 2024: -13.1pp
- All cycles
- 2024: R+13.1 2020: R+10.4 2016: R+16.8 2012: R+5.0 2008: D+1.2
Not yet ingested
- Civics
- —
Market trends
- HPI YoY
- ▼ -96.22%
- Current HPI
- 389.8118
- Rent YoY
- ▲ 21.59%
- Metro
- Laconia, NH
- State GDP YoY
- —
- F500 in state
- 0
Price history
+977.3% since first listed2 events — show timeline
- 2026-06-02 Listed $975,000 PrimeMLS
- 1993-08-01 Sold (Public Records) $90,500 Public Records
Property tax history
+3.5%/yrLatest (2025): $7,264 · +2.7% YoY. Source: county tax records.
Cash-flow waterfall
monthlySold comps — $/sqft
last 12 mo · ≤1 miLoading sold comps…