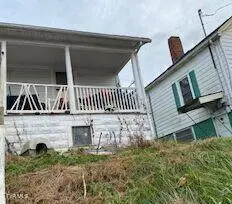
277 Norfolk Ave · Bristol, VA
Flood risk 1/10 · Minimal
- FEMA flood zone
- X (unshaded)
- Chance of flooding over 30 yrs
- 0.0%
- Est. flood insurance / yr
- $507 – $1,088
Fire risk 2/10 · Minimal
- Est. fire insurance / yr
- $666 – $1,236
Heat risk 4/10 · Minor
- Hot days now (above 98°F)
- 7 days/yr
- Hot days in 30 yrs
- 22 days/yr
Wind risk 2/10 · Minimal
- Chance of severe wind over 30 yrs
- —
Air-quality risk 2/10 · Minimal
- Unhealthy air days now
- 1 days/yr
- Unhealthy air days in 30 yrs
- 2 days/yr
Risk factors via First Street. Map © Google.
Why this score? — see what drove the B grade
The composite is a weighted blend of 9 inputs, each scored 0–100. Each bar is that input's sub-score; the figure is the points it added to the 100-point composite (weight × sub-score).
- Cash flow +30.0/30.0
- ARV discount +11.6/15.0
- DSCR +10.0/10.0
- 1% rule +8.8/10.0
- Schools +5.2/10.0
- Livability +3.7/5.0
- Rent growth +2.5/5.0
- Condition / age +2.5/5.0
- Appreciation +0.0/10.0
$125,000
🖨 Deal sheet 📄 Offer letter ✓ Due diligence
Listing remarks MLS
Do not disturb occupants. No interior access available. ''This property has been placed in an upcoming online event. All bids should be submitted at www. auction.com (void where prohibited). All properties are subject to a 5% buyer's premium, and bidding is pursuant to Auction.com terms and conditions. ' Property sold in as-is condition. All information taken from tax records and to be verified by buyers. Seller and listing agent will not be responsible. All information subject to errors and omissions.
Key facts
- Built 1920
- Listed 142 days
Neighborhood map
What this means for you Summary
Snapshot
- This is a 3-bed/1.0-bath single-family listed at $125k.
Deal economics
- At list price, monthly cash flow is $500 ($6k/yr) — positive.
- The deal already cash-flows at list — no discount required.
- Meets the 1% rule at list price ($2k rent vs $125k).
- Recommended offer: $110k (12.0% below list) — sets the bar for market timing.
- Cap rate 11.1% vs local median 4.9% in Bristol — top-decile yield for the area; either an underpriced asset or a hidden risk that comps aren't pricing in. Stress-test before assuming the spread holds.
Location & tenants
- Location reads 74/100 on livability (#140 in VA, #4,544 nationally) — a middle-class / working-renter tenant base. Strengths: cost of living A+, housing A+, health & safety A+; Watch: crime F, commute F, employment F.
- Bristol City Public School District (urban): math 57% / reading 70% proficiency, ranked #53 of 131 in VA (top 40%) — acceptable for families but not a draw, mixed tenant base, ~2y average lease.
- Market conditions: 156 active listings in the ZIP; 8 comparable units currently listed for rent nearby; rentals leasing fast (median 13d on market — plan ~1-2 weeks tenant-placement turnaround); 15 units permitted in Bristol city in 2024 (5 in 5+ unit buildings).
Forward outlook
- Local home prices are declining (-3.0%/yr); year-one equity from $864 of loan paydown is wiped out by about $4k of value loss. Plan a longer hold.
- Bristol County population projected at -20% by 2050 — secular population decline; favor cash flow + early exit over multi-decade hold.
- At projected returns (-3.0% appreciation + 3.0% rent growth), your $35k cash investment doubles in ~7 years — after that, you're playing with house money.
Negotiation context
- It's been on market 143 days — a 12% lower offer ($110k) is reasonable based on typical stale-listing flexibility.
- 2 sale attempts with the ask held roughly flat each time — persistent listings suggest the price (not the market) is what's stuck; bring a comps-based counter.
- Current owner paid $19k; list at $125k implies a 558% gain — meaningful room to come down on a strong offer.
Risks & watch-outs
- Watch-outs: built in 1920 — expect roof / HVAC / electrical / plumbing capex.
Questions for the listing agent
- It's been on market 143 days. Have you received any prior offers? Is the seller open to a 12% concession, seller financing, or rate buy-down credit?
- Built in 1920 — when were the roof, HVAC, electrical panel, plumbing, and water heater last replaced?
- Why hasn't it sold? Are there any deal-killer items the seller is aware of (foundation, flood, title, zoning, code violations)?
- Is there a deadline driving the sale (1031 exchange, divorce, estate, relocation)? That informs how much negotiation room exists.
- Schools are A-rated — typically a magnet for longer-tenancy family renters. What's the average tenant stay here, and is there a school-zone premium baked into asking?
- Crime grade is F in this area — have there been break-ins, vandalism, or insurance claims at this property in the last 3 years? What carrier currently insures it and at what premium?
- What's the average days-on-market for RENTAL listings here right now (not sales)? A rising rental-DOM trend means longer vacancies and softer asking-rent achievability than the comps imply.
- What's the recent tenant-quality profile in this submarket — average credit score on applications, eviction rate, late-payment / NSF rate, and stable-employment percentage? A property-management company in the area should have these aggregated.
- How much new for-sale + rental construction is in the pipeline within 1–3 miles? Heavy new supply typically softens prices + rents 12–24 months out; constrained supply supports both.
Investment metrics
- 1% rule
- 1.38% ✓
- Cap rate
- 11.09%
- Cash-on-cash
- 17.13%
- DSCR
- 1.76
- GRM
- 6.0
CMA / ARV
- ARV (median comp)
- $137,548
- List price
- $125,000
- Delta
- -9.12%
- Verdict
- FAIR
- Comps
- 20 within 1.0 mi
Show comp detail 12 sales within ~0.75 mi
| Address | Dist | Beds/Ba | Sqft | Sold | Price | $/sf | Match |
|---|---|---|---|---|---|---|---|
| 723 Portsmouth Ave | 0.08mi | 3/1.0 | 1,180 (-10%) | 4mo | $180,000 | $153 | 76 |
| 1010 Maple St | 0.46mi | 3/1.0 | 1,354 (+3%) | 0mo | $25,000 | $18 | 73 |
| 510 Mcdowell St | 0.39mi | 3/1.0 | 1,246 (-5%) | 9mo | $36,000 | $29 | 66 |
| 403 Washington St | 0.36mi | 4/3.0 (+1) | 1,286 (-2%) | 8mo | $162,000 | $126 | 60 |
| 1404 New Hampshire Ave | 0.59mi | 3/2.0 | 1,315 (+0%) | 10mo | $225,000 | $171 | 60 |
| 837 E State St | 0.53mi | 3/2.0 | 1,248 (-5%) | 4mo | $200,000 | $160 | 60 |
| 1434 New Hampshire Ave | 0.62mi | 3/1.0 | 1,375 (+5%) | 5mo | $175,000 | $127 | 59 |
| 474 Whitt St | 0.60mi | 3/1.5 | 1,232 (-6%) | 6mo | $162,000 | $131 | 55 |
| 345 Montpelier Ave | 0.36mi | 3/2.0 | 1,500 (+14%) | 3mo | $193,000 | $129 | 53 |
| 938 Barker St | 0.47mi | 3/1.0 | 1,170 (-11%) | 9mo | $79,000 | $68 | 52 |
| 201 Ruth St | 0.69mi | 3/1.0 | 1,393 (+6%) | 13mo | $190,000 | $136 | 47 |
| 824 Taylor St | 0.59mi | 2/1.0 (-1) | 1,501 (+14%) | 14mo | $210,000 | $140 | 32 |
Match score weights: distance 35% · size 25% · config 20% · recency 20%. Top-matched comps best support the ARV.
Projected returns pro-forma
-3.0% appreciation · 3.0% rent growth · sell at horizon
- IRR
- 8.4%
- Equity multiple
- 1.33×
- Total profit
- $11,598
- Equity at exit
- $18,638
- IRR
- 17.7%
- Equity multiple
- 2.46×
- Total profit
- $51,189
- Equity at exit
- $10,808
Cash invested: $35,000 (down + closing). Projections, not guarantees.
Landlord ↔ Tenant lean methodology
- Overall (STATE)
- 55 Moderately Landlord-Leaning
- State Virginia
- 55 Moderately Landlord-Leaning · D+2
- County
- — inherits STATE
- City
- — inherits STATE
ZIP-level market 24201
- Active inventory
- 156
- Price-to-rent
- 6.0×
Monthly cashflow live
- Estimated rent
- $1,726 high interval (Pro) →
- Mortgage (P&I)
- −$656
- Tax est. 1.5%
- −$156 /mo · $1,875/yr
- Insurance
- −$52
- HOA
- −$0
- Vacancy / Maint / Mgmt
- −$362
- Net cashflow
- $500
Break-even live
UW: 25.0% down · 7.5% · 30yr · 1.5% tax · 5.0% vac · 8.0% maint · 8.0% mgmt
Financing live
Cash to close
- Down payment
- $31,250
- Closing costs
- $3,750
- Reserves months
- —
- Total cash needed
- —
Loan-product check · same deal, 3 products live
Conventional
25% down · 7.5% · 30yr
- Down + closing
- —
- Monthly P&I
- —
- Monthly cashflow
- —
- DSCR
- —
- Eligible?
- —
Personal DTI + credit; lowest rate.
DSCR
20% down · 8.5% · 30yr
- Down + closing
- —
- Monthly P&I
- —
- Monthly cashflow
- —
- DSCR
- —
- Eligible?
- —
No personal income docs; deal must DSCR.
Hard money
10% down · 12.0% · 12mo
- Down + closing
- —
- Monthly P&I
- —
- Monthly cashflow
- —
- DSCR
- —
- Eligible?
- —
Short-term bridge; refi at stabilization.
Rent comps 8 comps
| Address | Beds | Baths | Sqft | Rent | $/sqft | DOM | Units | Dist |
|---|---|---|---|---|---|---|---|---|
| 279 Reservoir St Bristol, VA | 3.0 | 1.5 | 1300 | $1,600 | $1.23 | 13d | 1 | 0.36mi |
| 135 Kingsolver St Bristol, VA | 2.0 | 1.0 | 1000 | $1,400 | $1.40 | 20d | 1 | 0.53mi |
| 1733 Dunlap St Bristol, VA | 3.0 | 1.0 | 900 | $1,250 | $1.39 | 13d | 1 | 0.72mi |
| 201 Springdale Rd Bristol, TN | 3.0 | 2.0 | 1635 | $2,750 | $1.68 | 43d | 1 | 0.77mi |
| 924 Maryland Ave Unit F Bristol, TN | 2.0 | 2.0 | 1780 | $2,000 | $1.12 | 13d | 1 | 0.89mi |
| 1206 Golf St Bristol, TN | 3.0 | 1.0 | 960 | $1,500 | $1.56 | 13d | 1 | 1.10mi |
| 1216 Norway St Unit 102 Bristol, VA | 2.0 | 1.0 | 1215 | $1,600 | $1.32 | 13d | 1 | 1.46mi |
| 1216 Norway St Unit 101 Bristol, VA | 4.0 | 2.0 | 1615 | $2,100 | $1.30 | 13d | 1 | 1.46mi |
Listing history 20 events
-
2026-06-19days on market $125,000 Active 143 DOM
-
2026-06-18days on market $125,000 Active 142 DOM
-
2026-06-17days on market $125,000 Active 141 DOM
-
2026-06-16days on market $125,000 Active 140 DOM
-
2026-06-15days on market $125,000 Active 139 DOM
-
2026-06-14days on market $125,000 Active 137 DOM
-
2026-06-13days on market $125,000 Active 136 DOM
-
2026-06-10days on market $125,000 Active 134 DOM
-
2026-06-09days on market $125,000 Active 133 DOM
-
2026-06-08days on market $125,000 Active 132 DOM
-
2026-06-07days on market $125,000 Active 131 DOM
-
2026-06-03days on market $125,000 Active 127 DOM
-
2026-06-02days on market $125,000 Active 126 DOM
-
2026-06-01days on market $125,000 Active 125 DOM
-
2026-05-31days on market $125,000 Active 124 DOM
-
2026-05-30days on market $125,000 Active 123 DOM
-
2026-05-10status Active 508-char remark
Show marketing remark (508 chars)
Do not disturb occupants. No interior access available. ''This property has been placed in an upcoming online event. All bids should be submitted at www. auction.com (void where prohibited). All properties are subject to a 5% buyer's premium, and bidding is pursuant to Auction.com terms and conditions. ' Property sold in as-is condition. All information taken from tax records and to be verified by buyers. Seller and listing agent will not be responsible. All information subject to errors and omissions.
-
2026-05-01historical 508-char remark
Show marketing remark (508 chars)
Do not disturb occupants. No interior access available. ''This property has been placed in an upcoming online event. All bids should be submitted at www. auction.com (void where prohibited). All properties are subject to a 5% buyer's premium, and bidding is pursuant to Auction.com terms and conditions. ' Property sold in as-is condition. All information taken from tax records and to be verified by buyers. Seller and listing agent will not be responsible. All information subject to errors and omissions.
-
2026-01-18$125,000 Active 508-char remark
Show marketing remark (508 chars)
Do not disturb occupants. No interior access available. ''This property has been placed in an upcoming online event. All bids should be submitted at www. auction.com (void where prohibited). All properties are subject to a 5% buyer's premium, and bidding is pursuant to Auction.com terms and conditions. ' Property sold in as-is condition. All information taken from tax records and to be verified by buyers. Seller and listing agent will not be responsible. All information subject to errors and omissions.
-
2004-08-26soldstatus $19,000
ⓘ Source: listings_history table (triggers on properties + properties_extension) + one-shot
backfill from property_details.listing_events for pre-trigger history.
Climate risk First Street
- Flood 1/10 Low FEMA zone X (unshaded) · 0% chance over 30 yrs
- Wildfire 2/10 Low
- Heat 4/10 Moderate 7 d/yr ≥98°F today · 22 d/yr by 30 yrs out
- Wind 2/10 Low
- Air quality 2/10 Low 1 unhealthy d/yr today · 2 by 30 yrs out
Nearby sold comps map
Loading sold comps map…
Walkable amenities ~0.75 mi
Loading nearby amenities…
Taxation est. · year 1
- Rental income
- $20,712
- − Mortgage interest
- −$7,002
- − Property taxes
- −$1,875
- − Insurance
- −$625
- − Repairs & maintenance
- −$1,657
- − Management
- −$1,657
- − Depreciation
- −$3,636
- Taxable income
- $4,260
- Est. tax owed @ 24.0%
- −$1,022
- After-tax cash flow
- $4,974/yr
For passive investors: Depreciation is non-cash, so a rental often shows a tax loss while cash-flowing — sheltering income. Rental losses are passive: they offset passive income freely, and up to $25,000/yr can offset ordinary (W-2) income if you actively participate and your MAGI is under $100k (phasing out to $0 by $150k); unused losses carry forward. On sale, claimed depreciation is recaptured at up to 25%, and gains may owe capital-gains tax (a 1031 exchange can defer both). Figures are a year-1 estimate at your 24.0% rate — not tax advice; consult a CPA.
Schools (NCES district)
- District
- Bristol City Public School District
- NCES district ID
- 5100450
- Math proficiency
- 57% ▼ -24.00%
- Reading proficiency
- 70% ▼ -6.00%
- Median HH income
- $33,978
- Composite
- 52.4/100
- National rank
- #1579
- State rank
- #53 of 131 in VA
Livability — Bristol
- Score
- 74/100
- State rank
- #140
- US rank
- #4544
Category grades
Schools grade is shown separately in the Schools card above.
Census & demographics
- Census place
- Bristol, VA
- City population
- 16,039
- Population (ZIP)
- 16,039
Population outlook (Bristol County) Hauer SSP2
- Today (2025)
- 16,113 people
- By 2030
- 15,510 · -3.7%
- By 2040
- 14,121 · -12.4%
- By 2050
- 12,847 · -20.3%
- By 2075
- 9,870 · -38.7%
- By 2100
- 7,883 · -51.1%
Race, ethnicity, and origin ACS 2023
- Neighborhood character
- Predominantly White (85%)
- Race & ethnicity
- White 85% Black 7% Two or more races 6% Hispanic / Latino 3%
- Common ancestry
- Slovak 4% Serbian 1% Iranian 0%
- Foreign-born
- 1% · Canada
- Languages at home
- 98% English-only · Spanish 2%
Political lean MEDSL · Bristol
- 2024 margin
- Solid R (+39.7) · D 29.8% · R 69.5%
- 2008→2024 swing
- -13.6pp toward R · 2008: -26.0pp · 2024: -39.7pp
- All cycles
- 2024: R+39.7 2020: R+38.9 2016: R+43.8 2012: R+31.1 2008: R+26.0
Not yet ingested
- Civics
- —
Market trends
- HPI YoY
- ▼ -206.40%
- Current HPI
- 196.2099
- Rent YoY
- —
- Metro
- —
- State GDP YoY
- ▲ 2.40%
- F500 in state
- 50
Industry mix (Fortune 500 HQ in VA)
| Industry | F500 HQs | Revenue |
|---|---|---|
| Aerospace / Defense | 4 | $236B |
|
||
| Technology / Defense | 3 | $32B |
|
||
| Financial Services | 2 | $176B |
|
||
| Utilities | 2 | $27B |
|
||
| Insurance | 2 | $25B |
|
||
| Technology | 2 | $15B |
|
||
Price history
+557.9% since first listed4 events — show timeline
- 2026-05-10 Relisted — TVRMLS
- 2026-05-01 Delisted — TVRMLS
- 2026-01-18 Listed $125,000 TVRMLS
- 2004-08-26 Sold (Public Records) $19,000 Public Records
Cash-flow waterfall
monthlySold comps — $/sqft
last 12 mo · ≤1 miLoading sold comps…