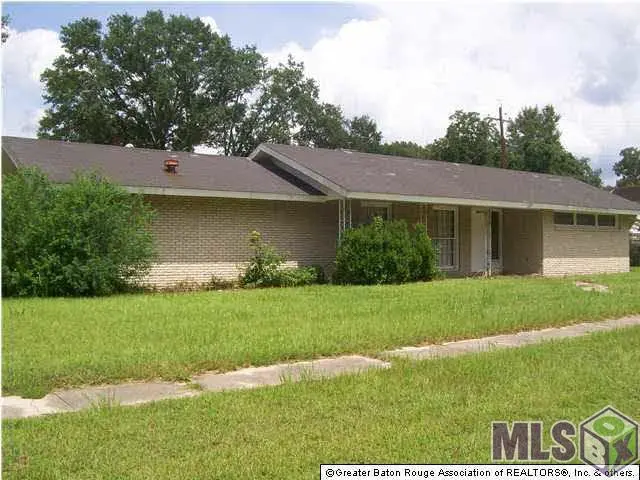
8166 Queenswood Ct · Baton Rouge, LA
Flood risk 3/10 · Minor
- FEMA flood zone
- X (shaded)
- Chance of flooding over 30 yrs
- 0.2%
- Est. flood insurance / yr
- $507 – $1,088
Fire risk 1/10 · Minimal
- Est. fire insurance / yr
- $1,269 – $2,357
Heat risk 8/10 · Major
- Hot days now (above 108°F)
- 7 days/yr
- Hot days in 30 yrs
- 20 days/yr
Wind risk 9/10 · Severe
- Chance of severe wind over 30 yrs
- 99.0%
Air-quality risk 3/10 · Minor
- Unhealthy air days now
- 3 days/yr
- Unhealthy air days in 30 yrs
- 4 days/yr
Risk factors via First Street. Map © Google.
Why this score? — see what drove the C+ grade
The composite is a weighted blend of 9 inputs, each scored 0–100. Each bar is that input's sub-score; the figure is the points it added to the 100-point composite (weight × sub-score).
- Cash flow +22.0/30.0
- ARV discount +15.0/15.0
- DSCR +7.0/10.0
- 1% rule +5.5/10.0
- Livability +3.7/5.0
- Rent growth +3.4/5.0
- Condition / age +2.5/5.0
- Schools +2.4/10.0
- Appreciation +0.0/10.0
$125,000
🖨 Deal sheet 📄 Offer letter ✓ Due diligence
Listing remarks MLS
Calling All Investors. Corner Lot with many special amenities. Bring your thoughts, paint, hammer, and the handy man!!! Home needs updating but has great potential and sits on a corner lot, This a great purchase!! Home sold in its as condition.
Key facts
- 0.24 acre lot
- Garage
- Built 1976
Property features AI
Finance
- Other: Located in Goodwood Homesites subdivision
Exterior
- Parking: Attached garage (garage faces rear); Two total parking spaces
- Utilities: Cable connected
- Home design: Single-family detached home; One story
- Construction: Wood siding and brick frame construction; Slab foundation; Composition roof; Built with frame elements
- Exterior features: Patio; Chain link fence; Level lot; Corner lot
Interior
- Kitchen: Range; Oven; Electric cooktop
- Flooring: Carpet; Vinyl
- Bathrooms: Three full bathrooms
- Heating & cooling: Central heating; Central air conditioning
- Interior features: Range and oven with electric cooktop; Carpet and vinyl flooring
Neighborhood map
What this means for you Summary
Snapshot
- This is a 3-bed/3.0-bath single-family listed at $125k.
Deal economics
- At list price, monthly cash flow is $200 ($2k/yr) — positive.
- The deal already cash-flows at list — no discount required.
- Meets the 1% rule at list price ($1k rent vs $125k).
- Recommended offer: $121k (3.0% below list) — sets the bar for market timing.
- Cap rate 8.2% vs local median 4.3% in Baton Rouge — top-decile yield for the area; either an underpriced asset or a hidden risk that comps aren't pricing in. Stress-test before assuming the spread holds.
Location & tenants
- Location reads 74/100 on livability (#24 in LA, #4,535 nationally) — a middle-class / working-renter tenant base. Strengths: commute A+, cost of living A+, health & safety A+; Watch: amenities D, crime F, employment D-.
- East Baton Rouge Parish (urban): math 22% / reading 34% proficiency, ranked #47 of 98 in LA (top 48%) — low school quality limits family demand, transient renter base, plan for 1-2y turnover; 77% free/reduced lunch — lower-income household profile, screen leases tightly.
- Market conditions: Rents rising (+3.4%/yr); 238 active listings in the ZIP; 26 comparable units currently listed for rent nearby; rentals at typical pace (median 24d on market — plan ~3-4 weeks tenant-placement turnaround); 42% of comp listings sitting > 30 days — soft ceiling on asking rent; 2,252 units permitted in East Baton Rouge Parish in 2024 (440 in 5+ unit buildings).
Forward outlook
- Local home prices are declining (-3.0%/yr); year-one equity from $864 of loan paydown is wiped out by about $4k of value loss. Plan a longer hold.
- East Baton Rouge County population projected at +4% by 2050 — modest demand growth; plan on rents tracking national, not racing it.
Negotiation context
- It's been on market 31 days — a 3% lower offer ($121k) is reasonable based on typical stale-listing flexibility.
- 4 sale attempts since 15y ago; this cycle's ask has dropped $20k (14%) from the opening price — seller is motivated, your offer sets the floor, not the list.
- Current owner paid $53k; list at $125k implies a 136% gain — meaningful room to come down on a strong offer.
Risks & watch-outs
- Climate carrying-cost: severe wind risk, 99% chance of damaging wind over 30y; extreme-heat days projected 7→20/yr by 2055 (HVAC capex compounding) — expect insurance premiums to compound above CPI over the hold.
Questions for the listing agent
- It's been on market 31 days. Have you received any prior offers? Is the seller open to a 3% concession, seller financing, or rate buy-down credit?
- Built in 1976 — when were the roof, HVAC, electrical panel, plumbing, and water heater last replaced?
- Is there a deadline driving the sale (1031 exchange, divorce, estate, relocation)? That informs how much negotiation room exists.
- Crime grade is F in this area — have there been break-ins, vandalism, or insurance claims at this property in the last 3 years? What carrier currently insures it and at what premium?
- What's the average days-on-market for RENTAL listings here right now (not sales)? A rising rental-DOM trend means longer vacancies and softer asking-rent achievability than the comps imply.
- What's the recent tenant-quality profile in this submarket — average credit score on applications, eviction rate, late-payment / NSF rate, and stable-employment percentage? A property-management company in the area should have these aggregated.
- How much new for-sale + rental construction is in the pipeline within 1–3 miles? Heavy new supply typically softens prices + rents 12–24 months out; constrained supply supports both.
Investment metrics
- 1% rule
- 1.05% ✓
- Cap rate
- 8.21%
- Cash-on-cash
- 6.85%
- DSCR
- 1.30
- GRM
- 8.0
CMA / ARV
- ARV (on-the-fly)
- $187,071
- Comps found
- 11
Show comp detail 11 sales within ~0.75 mi
| Address | Dist | Beds/Ba | Sqft | Sold | Price | $/sf | Match |
|---|---|---|---|---|---|---|---|
| 8221 Queenswood Ct | 0.04mi | 3/2.0 | 1,397 (-5%) | 8mo | $175,000 | $125 | 79 |
| 8067 Queenswood Ct | 0.06mi | 3/2.0 | 1,545 (+5%) | 8mo | $150,000 | $97 | 78 |
| 8184 Harry Dr | 0.10mi | 3/2.0 | 1,600 (+9%) | 2mo | $204,000 | $128 | 75 |
| 8383 N Parkland Dr | 0.60mi | 3/2.0 | 1,456 (-1%) | 5mo | $184,900 | $127 | 62 |
| 8250 Franwood Dr | 0.26mi | 3/2.0 | 1,435 (-3%) | 22mo | $219,900 | $153 | 61 |
| 421 Fernwood Dr | 0.28mi | 3/2.0 | 1,675 (+14%) | 14mo | $230,000 | $137 | 49 |
| 244 E Parkland Dr | 0.68mi | 3/1.5 | 1,518 (+3%) | 13mo | $194,500 | $128 | 46 |
| 259 W Parkland Dr | 0.68mi | 3/1.0 | 1,640 (+11%) | 10mo | $195,000 | $119 | 33 |
| 8475 S Parkland Dr | 0.73mi | 3/1.0 | 1,290 (-12%) | 10mo | $154,900 | $120 | 29 |
| 8285 N Parkland Dr | 0.58mi | 3/1.5 | 1,257 (-15%) | 21mo | $185,000 | $147 | 25 |
| 8371 N Parkland Dr | 0.60mi | 4/2.0 (+1) | 1,680 (+14%) | 24mo | $209,000 | $124 | 20 |
Match score weights: distance 35% · size 25% · config 20% · recency 20%. Top-matched comps best support the ARV.
Projected returns pro-forma
-3.0% appreciation · 3.42% rent growth · sell at horizon
- IRR
- -5.3%
- Equity multiple
- 0.80×
- Total profit
- $-6,976
- Equity at exit
- $18,638
- IRR
- 4.8%
- Equity multiple
- 1.36×
- Total profit
- $12,609
- Equity at exit
- $10,808
Cash invested: $35,000 (down + closing). Projections, not guarantees.
Landlord ↔ Tenant lean methodology
- Overall (STATE)
- 90 Strongly Landlord-Friendly
- State Louisiana
- 90 Strongly Landlord-Friendly · R+12
- County
- — inherits STATE
- City
- — inherits STATE
ZIP-level market 70806
- Rents YoY
- 3.4%
- Active inventory
- 238
- Price-to-rent
- 8.0×
Monthly cashflow live
- Estimated rent
- $1,307 high interval (Pro) →
- Mortgage (P&I)
- −$656
- Tax from tax record
- −$125 /mo · $1,504/yr
- Insurance
- −$52
- HOA
- −$0
- Vacancy / Maint / Mgmt
- −$275
- Net cashflow
- $200
Break-even live
UW: 25.0% down · 7.5% · 30yr · 1.5% tax · 5.0% vac · 8.0% maint · 8.0% mgmt
Financing live
Cash to close
- Down payment
- $31,250
- Closing costs
- $3,750
- Reserves months
- —
- Total cash needed
- —
Loan-product check · same deal, 3 products live
Conventional
25% down · 7.5% · 30yr
- Down + closing
- —
- Monthly P&I
- —
- Monthly cashflow
- —
- DSCR
- —
- Eligible?
- —
Personal DTI + credit; lowest rate.
DSCR
20% down · 8.5% · 30yr
- Down + closing
- —
- Monthly P&I
- —
- Monthly cashflow
- —
- DSCR
- —
- Eligible?
- —
No personal income docs; deal must DSCR.
Hard money
10% down · 12.0% · 12mo
- Down + closing
- —
- Monthly P&I
- —
- Monthly cashflow
- —
- DSCR
- —
- Eligible?
- —
Short-term bridge; refi at stabilization.
Rent comps 26 comps
| Address | Beds | Baths | Sqft | Rent | $/sqft | DOM | Units | Dist |
|---|---|---|---|---|---|---|---|---|
| 600 Wooddale Blvd Baton Rouge, LA | 1.0–3.0 | 1.0–3.5 | 1225 | $1,537 | $1.25 | 14d | 16 | 0.23mi |
| 150 Ocean Dr Unit 2B Baton Rouge, LA | 2.0 | 2.0 | 1276 | $1,250 | $0.98 | 23d | 1 | 0.89mi |
| 6918 Goya Ave Unit A Baton Rouge, LA | 3.0 | 2.0 | 1398 | $1,785 | $1.28 | 14d | 1 | 0.94mi |
| 224 Ocean Dr Baton Rouge, LA | 2.0 | 1.5–2.0 | 1071 | $1,148 | $1.07 | 44d | 2 | 0.95mi |
| 6908 Goya Ave Unit A Baton Rouge, LA | 3.0 | 2.0 | 1302 | $1,650 | $1.27 | 21d | 1 | 0.95mi |
| 6908 Goya Ave Unit B Baton Rouge, LA | 3.0 | 2.0 | 1398 | $1,750 | $1.25 | 44d | 1 | 0.95mi |
| 224 Ocean Dr #107 Baton Rouge, LA | 2.0 | 1.5 | 1071 | $1,300 | $1.21 | 23d | 1 | 0.97mi |
| 226 Ship Dr Unit 5 Baton Rouge, LA | 2.0 | 2.0 | 1040 | $1,200 | $1.15 | 23d | 1 | 0.99mi |
| 226 Ship Dr Unit 5 Baton Rouge, LA | 2.0 | 2.0 | 1040 | $1,200 | $1.15 | 44d | 1 | 0.99mi |
| 6867 Titian Ave Baton Rouge, LA | 1.0–3.0 | 1.0–2.0 | 886 | $900 | $1.02 | 14d | 3 | 1.01mi |
| 6773 Titian Ave Unit 6 Baton Rouge, LA | 2.0 | 1.0 | 1000 | $700 | $0.70 | 14d | 1 | 1.04mi |
| 6773 Titian Ave Unit 3 Baton Rouge, LA | 2.0 | 1.0 | 900 | $850 | $0.94 | 44d | 1 | 1.04mi |
| 6773 Titian Ave Unit 10 Baton Rouge, LA | 2.0 | 1.0 | 900 | $800 | $0.89 | 44d | 1 | 1.05mi |
| 2136 Lobdell Blvd Baton Rouge, LA | 1.0–2.0 | 1.0–2.0 | 860 | $1,066 | $1.24 | 14d | 24 | 1.05mi |
| 9228 Florida Blvd Apt 16 Baton Rouge, LA | 2.0 | 2.0 | 1000 | $800 | $0.80 | 44d | 1 | 1.09mi |
| 9228 Florida Blvd Unit 38 Baton Rouge, LA | 2.0 | 2.0 | 1000 | $800 | $0.80 | 14d | 1 | 1.09mi |
| 9228 Florida Blvd Unit 8 Baton Rouge, LA | 2.0 | 1.5 | 972 | $750 | $0.77 | 23d | 1 | 1.09mi |
| 9228 Florida Blvd Unit 18 Baton Rouge, LA | 2.0 | 2.0 | 1000 | $800 | $0.80 | 23d | 1 | 1.09mi |
| 6645 Harry Dr Baton Rouge, LA | 2.0–4.0 | 1.0–2.0 | 1013 | $1,202 | $1.19 | 14d | 14 | 1.10mi |
| 376 Croydon Ave Unit A Baton Rouge, LA | 2.0 | 1.0 | 1117 | $1,800 | $1.61 | 44d | 1 | 1.13mi |
| 376 Croydon Ave Baton Rouge, LA | 2.0 | 1.0 | 1117 | $2,600 | $2.33 | 44d | 1 | 1.13mi |
| 9262 Florida Blvd Baton Rouge, LA | 1.0–2.0 | 1.0–2.0 | 950 | $775 | $0.82 | 44d | 1 | 1.15mi |
| 2121 Lobdell Blvd Unit H54 Baton Rouge, LA | 3.0 | 2.0 | 950 | $1,194 | $1.26 | 14d | 1 | 1.32mi |
| 650 N Ardenwood Dr Baton Rouge, LA | 1.0–4.0 | 1.0–2.0 | 951 | $1,229 | $1.29 | 44d | 1 | 1.33mi |
| 8508 Greenwell Springs Rd Baton Rouge, LA | 1.0–3.0 | 1.0–2.5 | 970 | $975 | $1.01 | 19d | 1 | 1.45mi |
| 459 Court Dr Apt Court Baton Rouge, LA | 1.0–2.0 | 1.0–2.0 | 995 | $1,099 | $1.10 | 44d | 1 | 1.45mi |
Listing history 22 events
-
2026-06-17status $125,000 Pending 31 DOM
-
2026-06-16days on market $125,000 Active 31 DOM
-
2026-06-15days on market $125,000 Active 30 DOM
-
2026-06-14pricedays on market $125,000 Active 28 DOM
-
2026-06-10days on market $145,000 Active 25 DOM
-
2026-06-09days on market $145,000 Active 24 DOM
-
2026-06-08days on market $145,000 Active 23 DOM
-
2026-06-07days on market $145,000 Active 22 DOM
-
2026-06-05days on market $145,000 Active 19 DOM
-
2026-06-03remarks 659-char remark
-
2026-06-03days on market $145,000 Active 18 DOM
-
2026-06-02days on market $145,000 Active 17 DOM
-
2026-06-01days on market $145,000 Active 16 DOM
-
2026-05-31days on market $145,000 Active 15 DOM
-
2026-05-31days on market $145,000 Active 14 DOM
-
2026-05-16$145,000 Active
Show marketing remark (244 chars)
Calling All Investors. Corner Lot with many special amenities. Bring your thoughts, paint, hammer, and the handy man!!! Home needs updating but has great potential and sits on a corner lot, This a great purchase!! Home sold in its as condition.
-
2026-05-16$145,000 Active 244-char remark
Show marketing remark (244 chars)
Calling All Investors. Corner Lot with many special amenities. Bring your thoughts, paint, hammer, and the handy man!!! Home needs updating but has great potential and sits on a corner lot, This a great purchase!! Home sold in its as condition.
-
2011-09-06soldstatus $53,000
-
2011-09-02soldstatus 78-char remark
Show marketing remark (78 chars)
Handy Man Special!!! This home needs considerable TLC but has great potential.
-
2011-07-28$59,900 78-char remark
Show marketing remark (78 chars)
Handy Man Special!!! This home needs considerable TLC but has great potential.
-
2011-07-28$59,900
Show marketing remark (78 chars)
Handy Man Special!!! This home needs considerable TLC but has great potential.
-
1985-12-05soldstatus
ⓘ Source: listings_history table (triggers on properties + properties_extension) + one-shot
backfill from property_details.listing_events for pre-trigger history.
Tax reassessment forecast LA · Resets to sale price
- Current annual tax
- $1,504 · $125/mo
- Projected year-2 tax
- $1,504 · $125/mo
- Expected delta
- $0/yr ($0/mo · 0.0%)
ⓘ Screening estimate from a state-policy table — verify with the county assessor before closing.
Climate risk First Street
- Flood 3/10 Moderate FEMA zone X (shaded) · 20% chance over 30 yrs
- Wildfire 1/10 Low
- Heat 8/10 Severe 7 d/yr ≥108°F today · 20 d/yr by 30 yrs out
- Wind 9/10 Extreme 99% chance of damaging wind over 30 yrs
- Air quality 3/10 Moderate 3 unhealthy d/yr today · 4 by 30 yrs out
Nearby sold comps map
Loading sold comps map…
Walkable amenities ~0.75 mi
Loading nearby amenities…
Taxation est. · year 1
- Rental income
- $15,687
- − Mortgage interest
- −$7,002
- − Property taxes
- −$1,504
- − Insurance
- −$625
- − Repairs & maintenance
- −$1,255
- − Management
- −$1,255
- − Depreciation
- −$3,636
- Taxable income
- $410
- Est. tax owed @ 24.0%
- −$98
- After-tax cash flow
- $2,299/yr
For passive investors: Depreciation is non-cash, so a rental often shows a tax loss while cash-flowing — sheltering income. Rental losses are passive: they offset passive income freely, and up to $25,000/yr can offset ordinary (W-2) income if you actively participate and your MAGI is under $100k (phasing out to $0 by $150k); unused losses carry forward. On sale, claimed depreciation is recaptured at up to 25%, and gains may owe capital-gains tax (a 1031 exchange can defer both). Figures are a year-1 estimate at your 24.0% rate — not tax advice; consult a CPA.
Schools (NCES district)
- District
- East Baton Rouge Parish
- NCES district ID
- 2200540
- Math proficiency
- 22% ▼ -36.00%
- Reading proficiency
- 34% ▼ -31.00%
- Median HH income
- $46,263
- Composite
- 24.14/100
- National rank
- #7745
- State rank
- #47 of 98 in LA
Livability — Baton Rouge
- Score
- 74/100
- State rank
- #24
- US rank
- #4535
Category grades
Schools grade is shown separately in the Schools card above.
Census & demographics
- Census place
- Baton Rouge, LA
- County
- East Baton Rouge Parish · 399,686 people
- City population
- 351,868
- Metro
- Baton Rouge, LA
- Population (ZIP)
- 28,302
- Household income
- $55,642
- Rent vs Own
- Severe rent burden
- 1968.0
Population outlook (East Baton Rouge County) Hauer SSP2
- Today (2025)
- 464,810 people
- By 2030
- 472,137 · +1.6%
- By 2040
- 480,243 · +3.3%
- By 2050
- 484,422 · +4.2%
- By 2075
- 492,069 · +5.9%
- By 2100
- 476,347 · +2.5%
Race, ethnicity, and origin ACS 2023
- Neighborhood character
- Diverse neighborhood (Simpson 0.62)
- Race & ethnicity
- White 48% Black 38% Two or more races 8% Hispanic / Latino 5% Asian 2%
- Hispanic origin (detail)
- Puerto Rican 1%
- Common ancestry
- Lithuanian 9% Slovak 2% Serbian 1%
- Foreign-born
- 4% · Canada
- Languages at home
- 93% English-only · Spanish 3% Chinese 1% French/Haitian/Cajun 1%
Political lean MEDSL · East Baton Rouge
- 2024 margin
- D (+11.1) · D 54.5% · R 43.4% · Other 2.1%
- 2008→2024 swing
- +8.9pp toward D · 2008: 2.2pp · 2024: 11.1pp
- All cycles
- 2024: D+11.1 2020: D+13.1 2016: D+9.2 2012: D+5.2 2008: D+2.2
Not yet ingested
- Civics
- —
Market trends
- HPI YoY
- ▼ -167.56%
- Current HPI
- 185.0655
- Rent YoY
- ▲ 3.42%
- Metro
- Baton Rouge, LA
- State GDP YoY
- ▲ 3.29%
- F500 in state
- 10
Industry mix (Fortune 500 HQ in LA)
| Industry | F500 HQs | Revenue |
|---|---|---|
| Telecommunications | 2 | $23B |
|
||
| Utilities | 1 | $12B |
|
||
| Wholesale / Distribution | 1 | $5B |
|
||
| Advertising | 1 | $2B |
|
||
Price history
+142.1% since first listed7 events — show timeline
- 2026-05-16 Listed $145,000 AcadianaMLS
- 2026-05-16 Listed $145,000 GBRMLS
- 2011-09-06 Sold (Public Records) $53,000 Public Records
- 2011-09-02 Sold (MLS) — GBRMLS
- 2011-07-28 Listed $59,900 AcadianaMLS
- 2011-07-28 Listed $59,900 GBRMLS
- 1985-12-05 Sold (Public Records) — Public Records
Property tax history
+32.3%/yrLatest (2025): $1,504 · +4.2% YoY. Source: county tax records.
Cash-flow waterfall
monthlySold comps — $/sqft
last 12 mo · ≤1 miLoading sold comps…