 Duplex
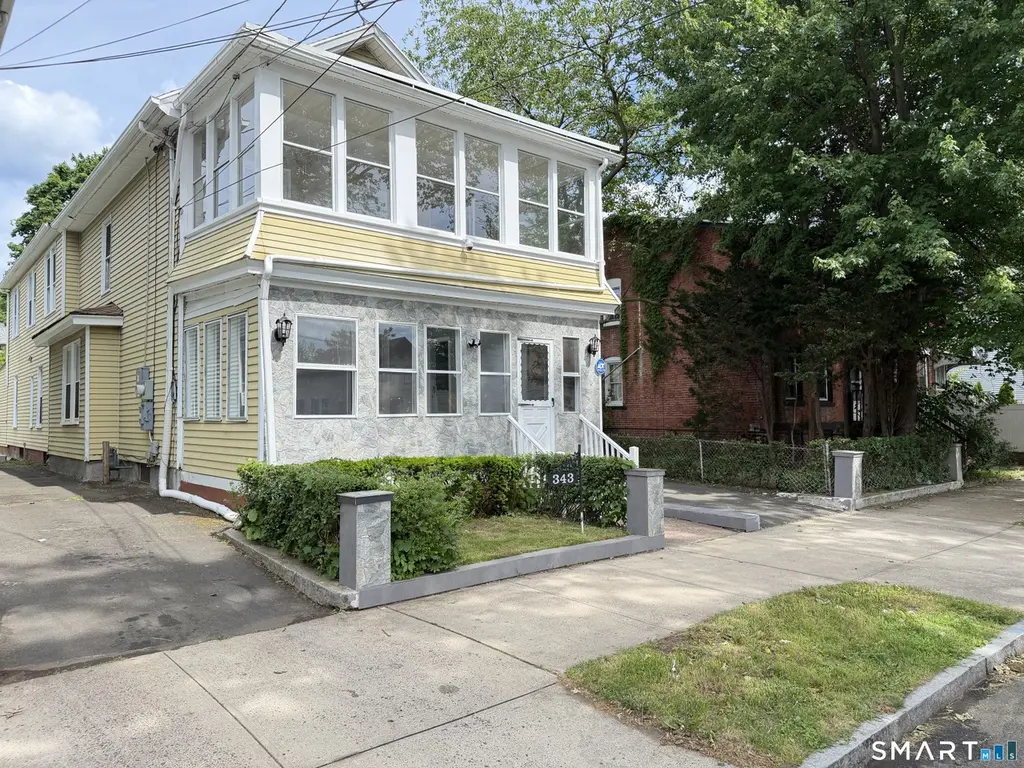
343 Greenwich Ave · New Haven, CT
Flood risk 1/10 · Minimal
- FEMA flood zone
- X (unshaded)
- Chance of flooding over 30 yrs
- 0.0%
- Est. flood insurance / yr
- $473 – $860
Fire risk 1/10 · Minimal
- Est. fire insurance / yr
- $829 – $1,539
Heat risk 7/10 · Major
- Hot days now (above 99°F)
- 7 days/yr
- Hot days in 30 yrs
- 16 days/yr
Wind risk 6/10 · Moderate
- Chance of severe wind over 30 yrs
- 56.0%
Air-quality risk 5/10 · Moderate
- Unhealthy air days now
- 6 days/yr
- Unhealthy air days in 30 yrs
- 8 days/yr
Risk factors via First Street. Map © Google.
Why this score? — see what drove the D grade
The composite is a weighted blend of 9 inputs, each scored 0–100. Each bar is that input's sub-score; the figure is the points it added to the 100-point composite (weight × sub-score).
- Cash flow +15.0/30.0
- Appreciation +9.9/10.0
- DSCR +4.6/10.0
- Livability +4.0/5.0
- 1% rule +3.8/10.0
- Rent growth +3.3/5.0
- Condition / age +2.5/5.0
- Schools +1.5/10.0
- ARV discount +0.0/15.0
$575,000
🖨 Deal sheet 📄 Offer letter ✓ Due diligence
Multi-family units
County records classify this as Multi-Family (2-4 Unit). Listing-text estimate: 2 units. confirmed
Listing remarks
Welcome to 343 Greenwich Ave! Located in the heart of The Hill, this newly updated 2-family offers turnkey living for investors or owner-occupants. Each unit features brand-new kitchens with updated appliances, modern bathrooms, new flooring, and fresh paint throughout, providing a clean, low-maintenance investment. A standout feature is the oversized 4-car garage-rare for the area-offering excellent potential for additional income through parking, storage, or possible conversion under New Haven's ADU initiative (buyer to perform due diligence). The property also includes a bonus room and full bathroom in the basement, adding flexibility and utility. Enjoy a spacious yard, perfect for outdo
Key facts
- 7,405 sq ft lot
- 4 garage spots
- Built 1900
Property features AI
Finance
- Other: Property located in New Haven County, Connecticut; Nearby amenities include medical facilities, park, playground/tot lot, public transportation, shopping/mall, and walkable bus lines; GPS-friendly directions available
- Financial info: No investor cash flow or income/expense details provided
- HOA & community: No HOA details provided
Exterior
- Parking: Detached garage; 4 garages; Total parking for 7 vehicles; Driveway parking
- Security: No security details provided
- Utilities: Public water connected; Public sewer connected; Natural gas service
- Home design: Multi-family property (2-family subtype); Multi-family for sale
- Construction: Frame construction; Aluminum exterior siding; Asphalt shingle roof; Stone foundation; Built area recorded (per public record) 2420
- Exterior features: Level lot; Private paved driveway; Paved surfaces and off-street parking
Interior
- Kitchen: No kitchen appliance details provided
- Bedrooms: 7 bedrooms
- Flooring: No flooring details provided
- Bathrooms: 3 full bathrooms
- Heating & cooling: Hot water heat; Natural gas for heat and hot water; Active solar energy features
- Interior features: 12 total rooms; Full basement with interior access, partially finished and full walk-out; Finished walk-up attic; 3 full bathrooms; 3 total units in the building
- Laundry & utility: Laundry in basement with basement hook-ups
Neighborhood map
What this means for you Summary
Snapshot
- This is a 2 × 4-bed/1.5-bath units multifamily listed at $575k.
Deal economics
- At list price, monthly cash flow is $183 ($2k/yr) — positive. Per door: $91/mo.
- The deal already cash-flows at list — no discount required.
- To meet the 1% rule (rent ≥ 1% of price), the offer needs to be $505k (12.2% below list).
- Recommended offer: $505k (12.2% below list) — sets the bar for 1% rule.
- Cap rate 6.7% vs local median 4.8% in New Haven — top-decile yield for the area; either an underpriced asset or a hidden risk that comps aren't pricing in. Stress-test before assuming the spread holds.
Location & tenants
- Location reads 79/100 on livability (#31 in CT, #2,190 nationally) — a middle-class / working-renter tenant base. Strengths: amenities A+, commute A+, health & safety A+; Watch: schools D+, employment D, crime F.
- New Haven School District (urban): math 12% / reading 25% proficiency, ranked #147 of 153 in CT (top 96%) — low school quality limits family demand, transient renter base, plan for 1-2y turnover; 66% free/reduced lunch — lower-income household profile, screen leases tightly.
- Market conditions: Rents rising (+3.3%/yr); 46 active listings in the ZIP; 5 comparable units currently listed for rent nearby; rentals at typical pace (median 24d on market — plan ~3-4 weeks tenant-placement turnaround); 40% of comp listings sitting > 30 days — soft ceiling on asking rent; 1,059 units permitted in South Central Connecticut Planning Region in 2024 (779 in 5+ unit buildings).
- At $5,049/mo this rent would consume 122% of the median local household income ($50k/yr) (locally 1321% of renters already pay >50% of income on rent) — very limited rent-growth headroom before tenants either downsize or default.
Forward outlook
- In year one you build about $60k of equity ($4k loan paydown + $56k appreciation (9.8% local appreciation)).
- At projected returns (9.8% appreciation + 3.3% rent growth), your $161k cash investment doubles in ~3 years — after that, you're playing with house money.
- By year 2, paydown + projected appreciation supports a ~$97k cash-out refi (75% LTV) — recoverable capital for the next deal without selling this one.
Negotiation context
- It's been on market 19 days — a 2% lower offer ($566k) is reasonable based on typical stale-listing flexibility.
- 3 sale attempts since 2y ago with the ask held roughly flat each time — persistent listings suggest the price (not the market) is what's stuck; bring a comps-based counter.
Risks & watch-outs
- Watch-outs: built in 1900 — expect roof / HVAC / electrical / plumbing capex.
- Climate carrying-cost: major wind risk, 56% chance of damaging wind over 30y; extreme-heat days projected 7→16/yr by 2055 (HVAC capex compounding) — expect insurance premiums to compound above CPI over the hold.
Questions for the listing agent
- Can we see the unit-by-unit rent roll, current vacancy, and any below-market leases? What's the average tenancy length?
- What capital expenditures (roof, boiler, parking lot, exteriors) have been made in the last 5 years, and what's planned in the next 2?
- Built in 1900 — when were the roof, HVAC, electrical panel, plumbing, and water heater last replaced?
- Is there a deadline driving the sale (1031 exchange, divorce, estate, relocation)? That informs how much negotiation room exists.
- Schools are D-rated, which usually means shorter tenancies and higher turnover. Who's the typical renter profile here, and what's been the actual vacancy rate?
- Crime grade is F in this area — have there been break-ins, vandalism, or insurance claims at this property in the last 3 years? What carrier currently insures it and at what premium?
- The area grade is low — what's the realistic commute time and amenity access for the typical tenant pool here? Any planned neighborhood developments (good or bad) we should know about?
- What's the average days-on-market for RENTAL listings here right now (not sales)? A rising rental-DOM trend means longer vacancies and softer asking-rent achievability than the comps imply.
- What's the recent tenant-quality profile in this submarket — average credit score on applications, eviction rate, late-payment / NSF rate, and stable-employment percentage? A property-management company in the area should have these aggregated.
- How much new apartment / multifamily construction is in the pipeline within 1–3 miles? Heavy new supply (>2% of stock underway) typically softens rents 12–24 months out; light construction supports rent growth.
Investment metrics
- 1% rule
- 0.88% ✗
- Cap rate
- 6.67%
- Cash-on-cash
- 1.36%
- DSCR
- 1.06
- GRM
- 9.5
CMA / ARV
- ARV (on-the-fly)
- $394,460
- Comps found
- 12
Show comp detail 12 sales within ~0.75 mi
| Address | Dist | Beds/Ba | Sqft | Sold | Price | $/sf | Match |
|---|---|---|---|---|---|---|---|
| 20-22 Hurlburt St | 0.33mi | 6/3.0 | 2,429 (+0%) | 0mo | $362,500 | $149 | 80 |
| 121 Plymouth St | 0.17mi | 5/2.0 (-1) | 2,539 (+5%) | 10mo | $355,000 | $140 | 71 |
| 222 Howard Ave | 0.09mi | 5/3.0 (-1) | 2,311 (-4%) | 11mo | $470,000 | $203 | 70 |
| 133 Plymouth St | 0.17mi | 6/3.0 | 2,100 (-13%) | 4mo | $275,000 | $131 | 63 |
| 272 Greenwich Ave | 0.11mi | 6/3.0 | 2,684 (+11%) | 13mo | $450,000 | $168 | 62 |
| 173 Rosette St | 0.42mi | 5/2.0 (-1) | 2,312 (-4%) | 13mo | $212,625 | $92 | 57 |
| 152 Lamberton St | 0.30mi | 6/3.0 | 2,080 (-14%) | 8mo | $340,000 | $163 | 52 |
| 95 Frank St | 0.65mi | 6/3.0 | 2,243 (-7%) | 2mo | $385,000 | $172 | 52 |
| 210 Rosette St | 0.44mi | 6/3.0 | 2,205 (-9%) | 12mo | $430,000 | $195 | 51 |
| 109 Hurlburt St | 0.49mi | 6/3.0 | 2,677 (+11%) | 9mo | $290,000 | $108 | 48 |
| 28 Frank St | 0.68mi | 7/2.0 (+1) | 2,282 (-6%) | 8mo | $330,000 | $145 | 48 |
| 45 Frank St | 0.68mi | 6/3.0 | 2,120 (-12%) | 4mo | $430,000 | $203 | 40 |
Match score weights: distance 35% · size 25% · config 20% · recency 20%. Top-matched comps best support the ARV.
Projected returns pro-forma
9.81% appreciation · 3.3% rent growth · sell at horizon
- IRR
- 25.0%
- Equity multiple
- 2.98×
- Total profit
- $318,810
- Equity at exit
- $510,035
- IRR
- 22.1%
- Equity multiple
- 6.78×
- Total profit
- $930,812
- Equity at exit
- $1,091,537
Cash invested: $161,000 (down + closing). Projections, not guarantees.
Landlord ↔ Tenant lean methodology
- Overall (STATE)
- 27 Tenant-Leaning
- State Connecticut
- 27 Tenant-Leaning · D+7
- County
- — inherits STATE
- City
- — inherits STATE
ZIP-level market 06519
- Home prices YoY
- 2.7%
- Rents YoY
- 3.3%
- Active inventory
- 46
- Price-to-rent
- 19.0×
Monthly cashflow live
- Estimated rent
- $5,049 high interval (Pro) →
- Mortgage (P&I)
- −$3,015
- Tax from tax record
- −$551 /mo · $6,612/yr
- Insurance
- −$240
- HOA
- −$0
- Vacancy / Maint / Mgmt
- −$1,060
- Net cashflow
- $183
Break-even live
2-unit breakdown (identical units grouped — click to expand)
| Units | Beds | Baths | Est. rent |
|---|---|---|---|
| 2× units | 4 | 1.5 | $5,048 |
| #1 | 4 | 1.5 | $2,524 |
| #2 | 4 | 1.5 | $2,524 |
| Total (2 units) | $5,049 | ||
UW: 25.0% down · 7.5% · 30yr · 1.5% tax · 5.0% vac · 8.0% maint · 8.0% mgmt
Financing live
Cash to close
- Down payment
- $143,750
- Closing costs
- $17,250
- Reserves months
- —
- Total cash needed
- —
Loan-product check · same deal, 3 products live
Conventional
25% down · 7.5% · 30yr
- Down + closing
- —
- Monthly P&I
- —
- Monthly cashflow
- —
- DSCR
- —
- Eligible?
- —
Personal DTI + credit; lowest rate.
DSCR
20% down · 8.5% · 30yr
- Down + closing
- —
- Monthly P&I
- —
- Monthly cashflow
- —
- DSCR
- —
- Eligible?
- —
No personal income docs; deal must DSCR.
Hard money
10% down · 12.0% · 12mo
- Down + closing
- —
- Monthly P&I
- —
- Monthly cashflow
- —
- DSCR
- —
- Eligible?
- —
Short-term bridge; refi at stabilization.
Rent comps 5 comps
| Address | Beds | Baths | Sqft | Rent | $/sqft | DOM | Units | Dist |
|---|---|---|---|---|---|---|---|---|
| 34 Cassius St Unit 36 New Haven, CT | 5.0 | 2.0 | 1872 | $2,300 | $1.23 | 43d | 1 | 0.29mi |
| 37 Center St Unit 2 West Haven, CT | 5.0 | 2.0 | 2500 | $3,300 | $1.32 | 2d | 1 | 0.83mi |
| 395 Crown St New Haven, CT | 6.0 | 3.5 | 2889 | $7,195 | $2.49 | 43d | 1 | 1.42mi |
| 131 Dwight St Unit 1 New Haven, CT | 6.0 | 3.0 | 3097 | $6,250 | $2.02 | 23d | 1 | 1.48mi |
| 131 Dwight St Unit 1 New Haven, CT | 6.0 | 3.0 | 3000 | $6,250 | $2.08 | 14d | 1 | 1.48mi |
Listing history 12 events
-
2026-06-18days on market $575,000 Active 19 DOM
-
2026-06-17days on market $575,000 Active 18 DOM
-
2026-06-16days on market $575,000 Active 17 DOM
-
2026-06-15days on market $575,000 Active 16 DOM
-
2026-06-14days on market $575,000 Active 14 DOM
-
2026-06-13days on market $575,000 Active 13 DOM
-
2026-06-10days on market $575,000 Active 11 DOM
-
2026-06-09days on market $575,000 Active 10 DOM
-
2026-06-08days on market $575,000 Active 9 DOM
-
2026-06-07days on market $575,000 Active 8 DOM
-
2026-06-05remarks 699-char remark
-
2026-06-05$575,000 Active 5 DOM
ⓘ Source: listings_history table (triggers on properties + properties_extension) + one-shot
backfill from property_details.listing_events for pre-trigger history.
Tax reassessment forecast CT · Partial reset (capped growth)
- Current annual tax
- $6,612 · $551/mo
- Projected year-2 tax
- $9,458 · $788/mo
- Expected delta
- +$2,846/yr (+$237/mo · 43.1%)
ⓘ Screening estimate from a state-policy table — verify with the county assessor before closing.
Climate risk First Street
- Flood 1/10 Low FEMA zone X (unshaded) · 0% chance over 30 yrs
- Wildfire 1/10 Low
- Heat 7/10 Severe 7 d/yr ≥99°F today · 16 d/yr by 30 yrs out
- Wind 6/10 Major 56% chance of damaging wind over 30 yrs
- Air quality 5/10 Major 6 unhealthy d/yr today · 8 by 30 yrs out
Nearby sold comps map
Loading sold comps map…
Walkable amenities ~0.75 mi
Loading nearby amenities…
Taxation est. · year 1
- Rental income
- $60,588
- − Mortgage interest
- −$32,209
- − Property taxes
- −$6,612
- − Insurance
- −$2,875
- − Repairs & maintenance
- −$4,847
- − Management
- −$4,847
- − Depreciation
- −$16,727
- Taxable loss
- −$7,529
- Est. tax savings @ 24.0%
- +$1,807
- After-tax cash flow
- $4,000/yr
For passive investors: Depreciation is non-cash, so a rental often shows a tax loss while cash-flowing — sheltering income. Rental losses are passive: they offset passive income freely, and up to $25,000/yr can offset ordinary (W-2) income if you actively participate and your MAGI is under $100k (phasing out to $0 by $150k); unused losses carry forward. On sale, claimed depreciation is recaptured at up to 25%, and gains may owe capital-gains tax (a 1031 exchange can defer both). Figures are a year-1 estimate at your 24.0% rate — not tax advice; consult a CPA.
Schools (NCES district)
- District
- New Haven School District
- NCES district ID
- 0902790
- Math proficiency
- 12% ▼ -10.00%
- Reading proficiency
- 25% ▼ -10.00%
- Median HH income
- $38,058
- Composite
- 15.48/100
- National rank
- #9308
- State rank
- #147 of 153 in CT
Livability — New Haven
- Score
- 79/100
- State rank
- #31
- US rank
- #2190
Category grades
Schools grade is shown separately in the Schools card above.
Census & demographics
- Census place
- New Haven, CT
- County
- New Haven County · 688,236 people
- City population
- 132,813
- Metro
- New Haven-Milford, CT
- Population (ZIP)
- 15,605
- Household income
- $49,619
- Rent vs Own
- Severe rent burden
- 1321.0
Population outlook (South Central Connecticut County) Hauer SSP2
- By 2040
- 608,362
Race, ethnicity, and origin ACS 2023
- Neighborhood character
- Diverse neighborhood (Simpson 0.67)
- Race & ethnicity
- Hispanic / Latino 49% Black 26% White 15% Two or more races 13% Asian 4% Native American 1%
- Hispanic origin (detail)
- Mexican 15% Puerto Rican 25% Dominican 3%
- Common ancestry
- Romanian 1% Lithuanian 1%
- Foreign-born
- 25% · Canada, Jamaica, China
- Languages at home
- 50% English-only · Spanish 42% Other Indo-European 4% Arabic 1%
Political lean MEDSL · South Central Connecticut
- 2024 margin
- Strong D (+20.1) · D 59.0% · R 38.9% · Other 2.1%
- All cycles
- 2024: D+20.1
Not yet ingested
- Civics
- —
Market trends
- HPI YoY
- ▲ 9.81%
- Current HPI
- 377.4885
- Rent YoY
- ▲ 3.30%
- Metro
- New Haven-Milford, CT
- State GDP YoY
- ▲ 1.06%
- F500 in state
- 38
Industry mix (Fortune 500 HQ in CT)
| Industry | F500 HQs | Revenue |
|---|---|---|
| Industrial Machinery | 4 | $38B |
|
||
| Insurance | 3 | $71B |
|
||
| Financial Services | 2 | $25B |
|
||
| Transportation / Logistics | 2 | $18B |
|
||
| Healthcare | 1 | $247B |
|
||
| Telecommunications | 1 | $55B |
|
||
Price history
+155.6% since first listed6 events — show timeline
- 2026-06-05 Relisted — Smart MLS
- 2026-04-26 Listing Removed — Smart MLS
- 2026-04-22 Listed $575,000 Smart MLS
- 2026-04-10 Coming Soon $575,000 Smart MLS
- 2024-10-03 Listing Removed — Smart MLS
- 2024-09-11 Listed $225,000 Smart MLS
Property tax history
+5.6%/yrLatest (2023): $6,612 · -6.4% YoY. Source: county tax records.
Cash-flow waterfall
monthlySold comps — $/sqft
last 12 mo · ≤1 miLoading sold comps…