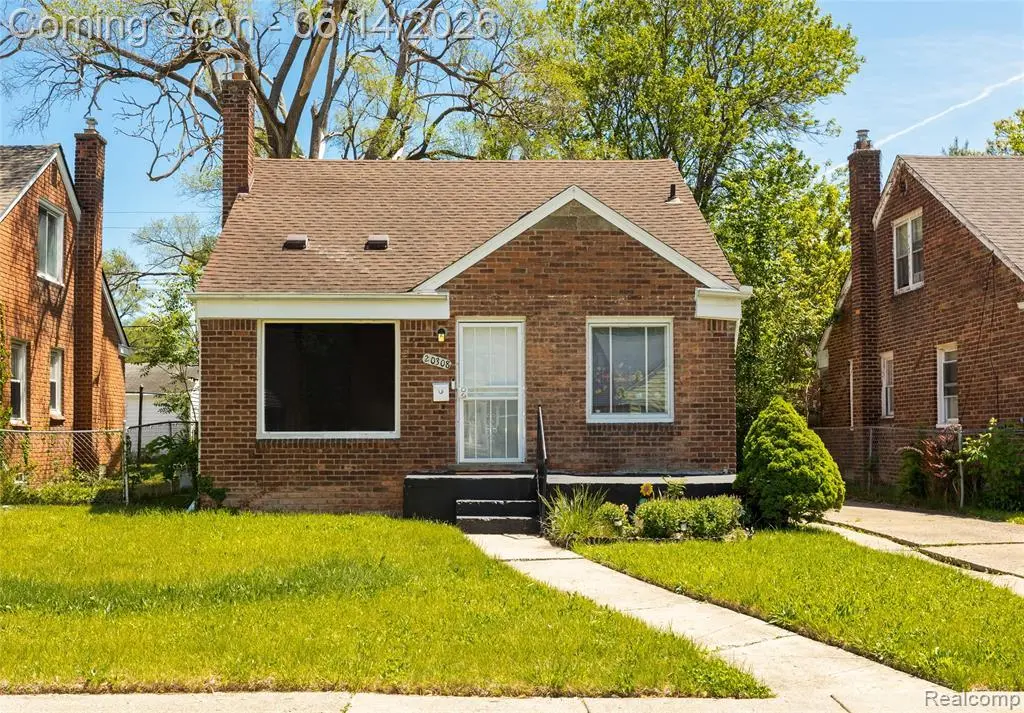
20308 Gilchrist St · Detroit, MI
Flood risk 1/10 · Minimal
- FEMA flood zone
- X (unshaded)
- Chance of flooding over 30 yrs
- 0.0%
- Est. flood insurance / yr
- $473 – $860
Fire risk 1/10 · Minimal
- Est. fire insurance / yr
- $784 – $1,456
Heat risk 3/10 · Minor
- Hot days now (above 97°F)
- 7 days/yr
- Hot days in 30 yrs
- 15 days/yr
Wind risk 2/10 · Minimal
- Chance of severe wind over 30 yrs
- —
Air-quality risk 3/10 · Minor
- Unhealthy air days now
- 2 days/yr
- Unhealthy air days in 30 yrs
- 5 days/yr
Risk factors via First Street. Map © Google.
Why this score? — see what drove the D grade
The composite is a weighted blend of 9 inputs, each scored 0–100. Each bar is that input's sub-score; the figure is the points it added to the 100-point composite (weight × sub-score).
- Cash flow +15.7/30.0
- ARV discount +7.5/15.0
- 1% rule +4.9/10.0
- DSCR +4.8/10.0
- Livability +3.7/5.0
- Rent growth +3.3/5.0
- Condition / age +2.5/5.0
- Schools +1.3/10.0
- Appreciation +0.0/10.0
$143,000
🖨 Deal sheet (PDF) 📄 Offer letter ✓ Due diligence
Listing remarks MLS
A home is waiting for you! Don't miss your opportunity to own this darling yet spacious bungalow designed especially with you and your family in mind. This quaint but cozy home has new windows, freshly painted throughout, beautiful light fixtures, new plush carpet in living room, hall and bedrooms, lovely ceramic flooring in kitchen and bathroom as well as granite countertops in the kitchen. There are 2 bedrooms at entry level and an upper bedroom with a sitting area. You will love the storage space the basement holds. The partially finished basement is freshly painted. There is a 1/2 bathroom in the basement. Wait! There's more. .. let's not forget the new central air unit for those hot '90 degree summer days which will be back with us in no time. Let's schedule your showing today!
Key facts
- Renovated throughout
- Natural light
- Private patio
Tags
Property features AI
Finance
- Other: Pets allowed
- Financial info: No investor or rental income details provided
- HOA & community: No HOA information provided
Exterior
- Parking: No parking details provided
- Security: No security features provided
- Utilities: Public water; Natural gas heat and gas water heater; Electric service (implied)
- Home design: Residential property; 2-story structure; Built in 1948; Basement foundation; Approximately 0.12 acre lot (about 150 ft frontage)
- Construction: Brick construction; Basement foundation; Year built 1948
- Exterior features: Brick exterior; Fenced yard; Paved street frontage
Interior
- Kitchen: Kitchen on entry level (approx. 13 x 10) with ceramic flooring; Breakfast nook on entry level (approx. 8 x 10) with ceramic flooring
- Bedrooms: Two entry-level bedrooms (both ~11 x 10) with carpet; One second-level bedroom (~13 wide) with carpet
- Flooring: Carpet in most living and bedroom areas; Ceramic tile in kitchen, breakfast nook, and bathrooms; Concrete flooring in laundry area
- Bathrooms: One full bathroom; Two total baths/lavatories; Entry-level bathroom with ceramic flooring (approx. 9 x 6); Basement lavatory with ceramic flooring (approx. 8 x 6)
- Heating & cooling: Forced air heating; Central air conditioning; Ceiling fans
- Interior features: Total of 10 rooms; Finished basement
- Laundry & utility: Laundry room in basement (approx. 6 x 5) with concrete floor
Neighborhood map
What this means for you Summary
Snapshot
- This is a 3-bed/1.0-bath single-family listed at $143k.
Deal economics
- At list price, monthly cash flow is $63 ($756/yr) — positive.
- The deal already cash-flows at list — no discount required.
- To meet the 1% rule (rent ≥ 1% of price), the offer needs to be $141k (1.5% below list).
- Recommended offer: $141k (1.5% below list) — sets the bar for 1% rule.
- Cap rate 6.8% vs local median 10.0% in Detroit — below-typical yield; the buyer is paying a premium for something (appreciation thesis, condition, location) that the cap rate doesn't capture.
Location & tenants
- Location reads 73/100 on livability (#218 in MI) — a middle-class / working-renter tenant base. Strengths: amenities A+, commute A+, cost of living A+; Watch: crime F, employment F.
- Detroit Public Schools Community District (urban): math 10% / reading 24% proficiency, ranked #499 of 540 in MI (top 92%) — low school quality limits family demand, transient renter base, plan for 1-2y turnover; 90% free/reduced lunch — lower-income household profile, screen leases tightly.
- Zoned schools: Bow Elementarymiddle School (math 5% / reading 5%, grade F, #1,325 of 1,397 statewide, top 99%, 574 students, 93% FRL); Henry Ford High School (math 24% / reading 24%, grade F, #481 of 713 statewide, top 81%, 712 students, 86% FRL) — zoned schools at 90% FRL track the district average.
- Market conditions: Rents rising (+3.2%/yr); 291 active listings in the ZIP; 34 comparable units currently listed for rent nearby; rentals at typical pace (median 19d on market — plan ~3-4 weeks tenant-placement turnaround); lower-income renter base — watch delinquency; 2,639 units permitted in Wayne County in 2024 (1,216 in 5+ unit buildings).
- This rent runs 43% of the median local income ($39k/yr) — at the standard rent-burdened threshold; future hikes will face affordability resistance.
Forward outlook
- Local home prices are declining (-3.0%/yr); year-one equity from $989 of loan paydown is wiped out by about $4k of value loss. Plan a longer hold.
- Wayne County population projected at -17% by 2050 — secular population decline; favor cash flow + early exit over multi-decade hold.
Negotiation context
- Only 7 days on market — expect competitive offers; lowballing is unlikely to land.
- 18 sale attempts since 16y ago; this cycle's ask is 10% above the opening price — seller raised mid-cycle; expect resistance to lowballs.
Risks & watch-outs
- Watch-outs: built in 1948 — expect roof / HVAC / electrical / plumbing capex.
Questions for the listing agent
- Built in 1948 — when were the roof, HVAC, electrical panel, plumbing, and water heater last replaced?
- Is there a deadline driving the sale (1031 exchange, divorce, estate, relocation)? That informs how much negotiation room exists.
- Schools are F-rated, which usually means shorter tenancies and higher turnover. Who's the typical renter profile here, and what's been the actual vacancy rate?
- Crime grade is F in this area — have there been break-ins, vandalism, or insurance claims at this property in the last 3 years? What carrier currently insures it and at what premium?
- The area grade is low — what's the realistic commute time and amenity access for the typical tenant pool here? Any planned neighborhood developments (good or bad) we should know about?
- What's the average days-on-market for RENTAL listings here right now (not sales)? A rising rental-DOM trend means longer vacancies and softer asking-rent achievability than the comps imply.
- What's the recent tenant-quality profile in this submarket — average credit score on applications, eviction rate, late-payment / NSF rate, and stable-employment percentage? A property-management company in the area should have these aggregated.
- How much new for-sale + rental construction is in the pipeline within 1–3 miles? Heavy new supply typically softens prices + rents 12–24 months out; constrained supply supports both.
Investment metrics
- 1% rule
- 0.99% ✗
- Cap rate
- 6.82%
- Cash-on-cash
- 1.89%
- DSCR
- 1.08
- GRM
- 8.5
CMA / ARV
- ARV (on-the-fly)
- $95,040
- Comps found
- 12
Show comp detail 12 sales within ~0.75 mi
| Address | Dist | Beds/Ba | Sqft | Sold | Price | $/sf | Match |
|---|---|---|---|---|---|---|---|
| 20069 Asbury Park | 0.22mi | 3/1.0 | 1,008 (+5%) | 6mo | $73,000 | $72 | 76 |
| 19975 Ferguson St | 0.25mi | 3/1.0 | 889 (-7%) | 1mo | $50,650 | $57 | 75 |
| 19950 Oakfield St | 0.30mi | 3/1.0 | 1,001 (+4%) | 5mo | $40,000 | $40 | 75 |
| 20245 Archdale St | 0.22mi | 3/1.0 | 890 (-7%) | 4mo | $53,000 | $60 | 74 |
| 20569 Biltmore St | 0.09mi | 3/1.5 | 1,073 (+12%) | 2mo | $174,000 | $162 | 73 |
| 20004 Southfield Fwy | 0.37mi | 2/1.0 (-1) | 929 (-3%) | 1mo | $20,000 | $22 | 71 |
| 20232 Prevost St | 0.47mi | 3/1.0 | 933 (-3%) | 4mo | $110,000 | $118 | 70 |
| 19900 Southfield Rd | 0.46mi | 3/1.0 | 898 (-6%) | 4mo | $110,000 | $122 | 64 |
| 16442 Pembroke Ave | 0.36mi | 3/1.0 | 1,050 (+9%) | 4mo | $40,000 | $38 | 64 |
| 19365 Fenmore St | 0.70mi | 3/1.0 | 912 (-5%) | 1mo | $94,900 | $104 | 58 |
| 20084 Greenview Ave | 0.65mi | 3/1.0 | 912 (-5%) | 5mo | $90,000 | $99 | 57 |
| 20253 Winthrop St | 0.58mi | 3/1.0 | 1,093 (+14%) | 5mo | $145,900 | $133 | 46 |
Match score weights: distance 35% · size 25% · config 20% · recency 20%. Top-matched comps best support the ARV.
Projected returns pro-forma
-3.0% appreciation · 3.25% rent growth · sell at horizon
- IRR
- -13.0%
- Equity multiple
- 0.53×
- Total profit
- $-18,747
- Equity at exit
- $21,322
- IRR
- -3.5%
- Equity multiple
- 0.76×
- Total profit
- $-9,455
- Equity at exit
- $12,364
Cash invested: $40,040 (down + closing). Projections, not guarantees.
Landlord ↔ Tenant lean methodology
- Overall (STATE)
- 62 Landlord-Friendly
- State Michigan
- 62 Landlord-Friendly · EVEN
- County
- — inherits STATE
- City
- — inherits STATE
ZIP-level market 48235
- Rents YoY
- 3.2%
- Active inventory
- 291
- Price-to-rent
- 8.5×
Monthly cashflow live
- Estimated rent
- $1,409 high interval (Pro) →
- Mortgage (P&I)
- −$750
- Tax from tax record
- −$240 /mo · $2,885/yr
- Insurance
- −$60
- HOA
- −$0
- Vacancy / Maint / Mgmt
- −$296
- Net cashflow
- $63
Break-even live
Sensitivity live
| Price | -10% $144 | -5% $103 | +0% $63 | +5% $22 | +10% $-18 |
|---|---|---|---|---|---|
| Rent | -10% $-48 | -5% $7 | +0% $63 | +5% $119 | +10% $174 |
| Rate | -1.0pp $135 | -0.5pp $99 | base $63 | +0.5pp $26 | +1.0pp $-12 |
UW: 25.0% down · 7.5% · 30yr · 1.5% tax · 5.0% vac · 8.0% maint · 8.0% mgmt
Financing live
Cash to close
- Down payment
- $35,750
- Closing costs
- $4,290
- Reserves months
- —
- Total cash needed
- —
Loan-product check · same deal, 3 products live
Conventional
25% down · 7.5% · 30yr
- Down + closing
- —
- Monthly P&I
- —
- Monthly cashflow
- —
- DSCR
- —
- Eligible?
- —
Personal DTI + credit; lowest rate.
DSCR
20% down · 8.5% · 30yr
- Down + closing
- —
- Monthly P&I
- —
- Monthly cashflow
- —
- DSCR
- —
- Eligible?
- —
No personal income docs; deal must DSCR.
Hard money
10% down · 12.0% · 12mo
- Down + closing
- —
- Monthly P&I
- —
- Monthly cashflow
- —
- DSCR
- —
- Eligible?
- —
Short-term bridge; refi at stabilization.
Rent comps 34 comps
| Address | Beds | Baths | Sqft | Rent | $/sqft | DOM | Units | Dist |
|---|---|---|---|---|---|---|---|---|
| 20314 Gilchrist St Detroit, MI | 3.0 | 1.0 | 1042 | $1,500 | $1.44 | 6d | 1 | 0.03mi |
| 20210 Biltmore St Detroit, MI | 3.0 | 1.0 | 1033 | $1,350 | $1.31 | 26d | 1 | 0.13mi |
| 20203 Gilchrist St Detroit, MI | 3.0 | 1.0 | 1031 | $1,250 | $1.21 | 6d | 1 | 0.14mi |
| 20259 Oakfield St Detroit, MI | 3.0 | 1.0 | 1056 | $1,250 | $1.18 | 18d | 1 | 0.19mi |
| 20043 Fenmore St Detroit, MI | 3.0 | 1.0 | 1030 | $1,423 | $1.38 | 0d | 1 | 0.37mi |
| 19736 Gilchrist St Detroit, MI | 2.0 | 1.0 | 696 | $995 | $1.43 | 14d | 1 | 0.47mi |
| 19918 Southfield Fwy Detroit, MI | 3.0 | 1.0 | 915 | $1,375 | $1.50 | 16d | 1 | 0.48mi |
| 19818 Fenmore St Detroit, MI | 3.0 | 1.0 | 902 | $1,275 | $1.41 | 45d | 1 | 0.49mi |
| 19970 Ashton Ave Detroit, MI | 3.0 | 1.0 | 1000 | $1,000 | $1.00 | 45d | 1 | 0.49mi |
| 20555 Motor Dr Detroit, MI | 1.0–2.0 | 1.0 | 750 | $1,222 | $1.63 | 16d | 5 | 0.49mi |
| 20527 Rosemont Ave Detroit, MI | 2.0 | 2.0 | 975 | $1,528 | $1.57 | 45d | 1 | 0.50mi |
| 20068 Faust Ave Detroit, MI | 2.0 | 1.0 | 750 | $1,100 | $1.47 | 26d | 1 | 0.62mi |
| 19467 Rutherford St Detroit, MI | 3.0 | 1.0 | 1002 | $1,200 | $1.20 | 18d | 1 | 0.67mi |
| 19440 Rutherford St Detroit, MI | 3.0 | 1.0 | 1000 | $1,400 | $1.40 | 26d | 1 | 0.71mi |
| 19307 Lindsay St Detroit, MI | 2.0 | 1.0 | 900 | $1,100 | $1.22 | 0d | 1 | 0.75mi |
| 20011 Avon Ave Detroit, MI | 3.0 | 1.0 | 1000 | $1,200 | $1.20 | 6d | 1 | 0.78mi |
| 16500 N Park Dr Southfield, MI | 1.0–3.0 | 1.0–2.5 | 1500 | $2,289 | $1.53 | 0d | 1 | 0.81mi |
| 19445 Avon Ave Detroit, MI | 3.0 | 1.0 | 1023 | $1,550 | $1.52 | 45d | 1 | 0.94mi |
| 20271 Grandville Ave Detroit, MI | 3.0 | 1.0 | 1010 | $1,550 | $1.53 | 25d | 1 | 1.05mi |
| 19329 Stahelin Ave Unit 1 Detroit, MI | 3.0 | 1.5 | 833 | $1,250 | $1.50 | 45d | 1 | 1.07mi |
| 16200 W 9 Mile Rd Southfield, MI | 1.0–2.0 | 1.0–2.0 | 971 | $1,700 | $1.75 | 7d | 2 | 1.17mi |
| 19372 Grandville Ave Detroit, MI | 2.0 | 1.5 | 733 | $1,025 | $1.40 | 0d | 1 | 1.19mi |
| 16300 W 9 Mile Rd Southfield, MI | 1.0–2.0 | 1.0–2.0 | 950 | $1,350 | $1.42 | 45d | 1 | 1.19mi |
| 18494 Ashton Ave Detroit, MI | 3.0 | 1.0 | 1000 | $1,600 | $1.60 | 18d | 1 | 1.21mi |
| 19176 Grandville Ave Detroit, MI | 3.0 | 1.0 | 941 | $1,300 | $1.38 | 6d | 1 | 1.28mi |
| 18276 Oakfield St Detroit, MI | 2.0 | 1.0 | 726 | $1,175 | $1.62 | 45d | 1 | 1.31mi |
| 18400 Rutherford St Detroit, MI | 3.0 | 1.0 | 1050 | $1,400 | $1.33 | 5d | 1 | 1.31mi |
| 18268 Mansfield St Detroit, MI | 2.0 | 1.0 | 800 | $1,200 | $1.50 | 18d | 1 | 1.35mi |
| 18481 Prest St Detroit, MI | 3.0 | 1.5 | 1100 | $1,300 | $1.18 | 21d | 1 | 1.37mi |
| 18427 Greenfield Rd Detroit, MI | 2.0 | 1.0 | 952 | $980 | $1.03 | 6d | 1 | 1.38mi |
| 18699 Shaftsbury Ave Detroit, MI | 2.0 | 1.0 | 800 | $1,000 | $1.25 | 45d | 1 | 1.38mi |
| 18659 Shaftsbury Ave Detroit, MI | 3.0 | 1.0 | 763 | $1,323 | $1.73 | 0d | 1 | 1.41mi |
| 15628 Stone Crossing Dr Southfield, MI | 2.0 | 2.0 | 1046 | $1,600 | $1.53 | 0d | 1 | 1.47mi |
| 19457 Evergreen Rd Detroit, MI | 2.0 | 1.0 | 1100 | $1,200 | $1.09 | 45d | 1 | 1.48mi |
Listing history 8 events
-
2026-06-21days on market $143,000 Active 7 DOM
-
2026-06-18days on market $143,000 Active 4 DOM
-
2026-06-17days on market $143,000 Active 3 DOM
-
2026-06-16days on market $143,000 Active 2 DOM
-
2026-06-15days on market $143,000 Active 1 DOM
-
2026-06-15statusdays on market $143,000 Active 2 DOM
-
2026-06-13remarks 699-char remark
-
2026-06-13$143,000 Coming Soon 1 DOM
ⓘ Source: listings_history table (triggers on properties + properties_extension) + one-shot
backfill from property_details.listing_events for pre-trigger history.
Tax reassessment forecast MI · Partial reset (capped growth)
- Current annual tax
- $2,885 · $240/mo
- Projected year-2 tax
- $2,885 · $240/mo
- Expected delta
- $0/yr ($0/mo · 0.0%)
ⓘ Screening estimate from a state-policy table — verify with the county assessor before closing.
Climate risk First Street
- Flood 1/10 Low FEMA zone X (unshaded) · 0% chance over 30 yrs
- Wildfire 1/10 Low
- Heat 3/10 Moderate 7 d/yr ≥97°F today · 15 d/yr by 30 yrs out
- Wind 2/10 Low
- Air quality 3/10 Moderate 2 unhealthy d/yr today · 5 by 30 yrs out
Nearby sold comps map
Loading sold comps map…
Walkable amenities ~0.75 mi
Loading nearby amenities…
Taxation est. · year 1
- Rental income
- $16,905
- − Mortgage interest
- −$8,010
- − Property taxes
- −$2,885
- − Insurance
- −$715
- − Repairs & maintenance
- −$1,352
- − Management
- −$1,352
- − Depreciation
- −$4,160
- Taxable loss
- −$1,570
- Est. tax savings @ 24.0%
- +$377
- After-tax cash flow
- $1,133/yr
For passive investors: Depreciation is non-cash, so a rental often shows a tax loss while cash-flowing — sheltering income. Rental losses are passive: they offset passive income freely, and up to $25,000/yr can offset ordinary (W-2) income if you actively participate and your MAGI is under $100k (phasing out to $0 by $150k); unused losses carry forward. On sale, claimed depreciation is recaptured at up to 25%, and gains may owe capital-gains tax (a 1031 exchange can defer both). Figures are a year-1 estimate at your 24.0% rate — not tax advice; consult a CPA.
Schools (NCES district)
- District
- Detroit Public Schools Community District
- NCES district ID
- 2601103
- Math proficiency
- 10% ▼ -2.00%
- Reading proficiency
- 24% ▲ 6.00%
- Median HH income
- $25,815
- Composite
- 13.06/100
- National rank
- #9564
- State rank
- #499 of 540 in MI
Livability — Detroit
- Score
- 73/100
- State rank
- #218
- US rank
- #5427
Category grades
Schools grade is shown separately in the Schools card above.
Census & demographics
- Census place
- Detroit, MI
- County
- Wayne County · 1,562,939 people
- City population
- 572,865
- Metro
- Detroit-Warren-Dearborn, MI
- Population (ZIP)
- 45,600
- Household income
- $39,265
- Rent vs Own
- Severe rent burden
- 3064.0
Population outlook (Wayne County) Hauer SSP2
- Today (2025)
- 1,675,273 people
- By 2030
- 1,620,300 · -3.3%
- By 2040
- 1,502,341 · -10.3%
- By 2050
- 1,384,039 · -17.4%
- By 2075
- 1,124,592 · -32.9%
- By 2100
- 881,193 · -47.4%
Race, ethnicity, and origin ACS 2023
- Neighborhood character
- Predominantly Black (94%)
- Race & ethnicity
- Black 94% White 3% Two or more races 2% Hispanic / Latino 1%
- Foreign-born
- 1% · Canada
- Languages at home
- 98% English-only · Spanish 1%
Political lean MEDSL · Wayne
- 2024 margin
- Strong D (+29.0) · D 62.7% · R 33.7% · Other 3.6%
- 2008→2024 swing
- -20.5pp toward R · 2008: 49.5pp · 2024: 29.0pp
- All cycles
- 2024: D+29.0 2020: D+38.1 2016: D+37.3 2012: D+46.9 2008: D+49.5
Not yet ingested
- Civics
- —
Market trends
- HPI YoY
- ▼ -153.02%
- Current HPI
- 263.6326
- Rent YoY
- ▲ 3.25%
- Metro
- Detroit-Warren-Dearborn, MI
- State GDP YoY
- ▲ 1.37%
- F500 in state
- 28
Industry mix (Fortune 500 HQ in MI)
| Industry | F500 HQs | Revenue |
|---|---|---|
| Automotive Parts | 3 | $48B |
|
||
| Automotive | 2 | $372B |
|
||
| Chemicals | 1 | $45B |
|
||
| Automotive Retail | 1 | $29B |
|
||
| Healthcare / Medical Devices | 1 | $23B |
|
||
| Automotive Technology | 1 | $20B |
|
||
Price history
+1687.5% since first listed52 events — show timeline
- 2026-06-12 Coming Soon $143,000 MiRealSource-MiMLS
- 2023-04-25 Sold (Public Records) $131,000 Public Records
- 2023-04-20 Sold (MLS) $131,000 MiRealSource-MiMLS
- 2023-04-20 Sold (MLS) $131,000 REALCOMP
- 2023-03-31 Pending — MiRealSource-MiMLS
- 2023-03-31 Pending — REALCOMP
- 2023-02-28 Listing Removed — MiRealSource-MiMLS
- 2023-02-28 Listed $130,000 MiRealSource-MiMLS
- 2023-02-28 Listing Removed — REALCOMP
- 2023-02-28 Listed $130,000 REALCOMP
- 2023-02-07 Price Changed $130,000 MiRealSource-MiMLS
- 2023-02-07 Price Changed $130,000 REALCOMP
- 2023-01-10 Listing Removed — MiRealSource-MiMLS
- 2023-01-10 Listed $140,000 MiRealSource-MiMLS
- 2023-01-10 Listing Removed — REALCOMP
- 2023-01-10 Listed $140,000 REALCOMP
- 2022-10-26 Listing Removed — MiRealSource-MiMLS
- 2022-10-26 Listing Removed — REALCOMP
- 2022-10-25 Listed $140,000 MiRealSource-MiMLS
- 2022-10-25 Listed $140,000 REALCOMP
- 2022-09-29 Listed $140,000 REALCOMP
- 2022-09-28 Listed $140,000 MiRealSource-MiMLS
- 2022-07-28 Sold (Public Records) $48,000 Public Records
- 2022-07-21 Sold (MLS) $48,000 MiRealSource-MiMLS
- 2022-07-21 Sold (MLS) $48,000 REALCOMP
- 2022-07-13 Pending — MiRealSource-MiMLS
- 2022-07-13 Pending — REALCOMP
- 2022-06-29 Contingent — MiRealSource-MiMLS
- 2022-06-29 Contingent — REALCOMP
- 2022-06-01 Listed $43,500 MiRealSource-MiMLS
- 2022-06-01 Listed $43,500 REALCOMP
- 2016-07-13 Sold (MLS) $24,000 MiRealSource-MiMLS
- 2016-07-13 Sold (MLS) $24,000 REALCOMP
- 2016-06-11 Pending — MiRealSource-MiMLS
- 2016-06-11 Pending — REALCOMP
- 2016-06-10 Relisted — REALCOMP
- 2016-06-07 Listing Removed — REALCOMP
- 2016-05-11 Price Changed $24,000 MiRealSource-MiMLS
- 2016-05-11 Price Changed $24,000 REALCOMP
- 2016-04-15 Listed $27,000 MiRealSource-MiMLS
- 2016-03-14 Listed $27,000 REALCOMP
- 2010-05-18 Sold (MLS) $9,000 REALCOMP
- 2010-05-18 Sold (MLS) $9,000 MiRealSource-MiMLS
- 2010-05-07 Listing Removed — MiRealSource-MiMLS
- 2010-04-28 Listing Removed — MiRealSource-MiMLS
- 2010-04-28 Listed $8,000 REALCOMP
- 2010-04-28 Listed $8,000 MiRealSource-MiMLS
- 2010-04-27 Listing Removed — REALCOMP
- 2010-04-06 Listing Removed — REALCOMP
- 2010-04-06 Listed $8,000 REALCOMP
- 2010-01-27 Listed $15,000 REALCOMP
- 2010-01-26 Listed $8,000 MiRealSource-MiMLS
Property tax history
+4.3%/yrLatest (2025): $2,885 · -6.0% YoY. Source: county tax records.
Cash-flow waterfall
monthlySold comps — $/sqft
last 12 mo · ≤1 miLoading sold comps…