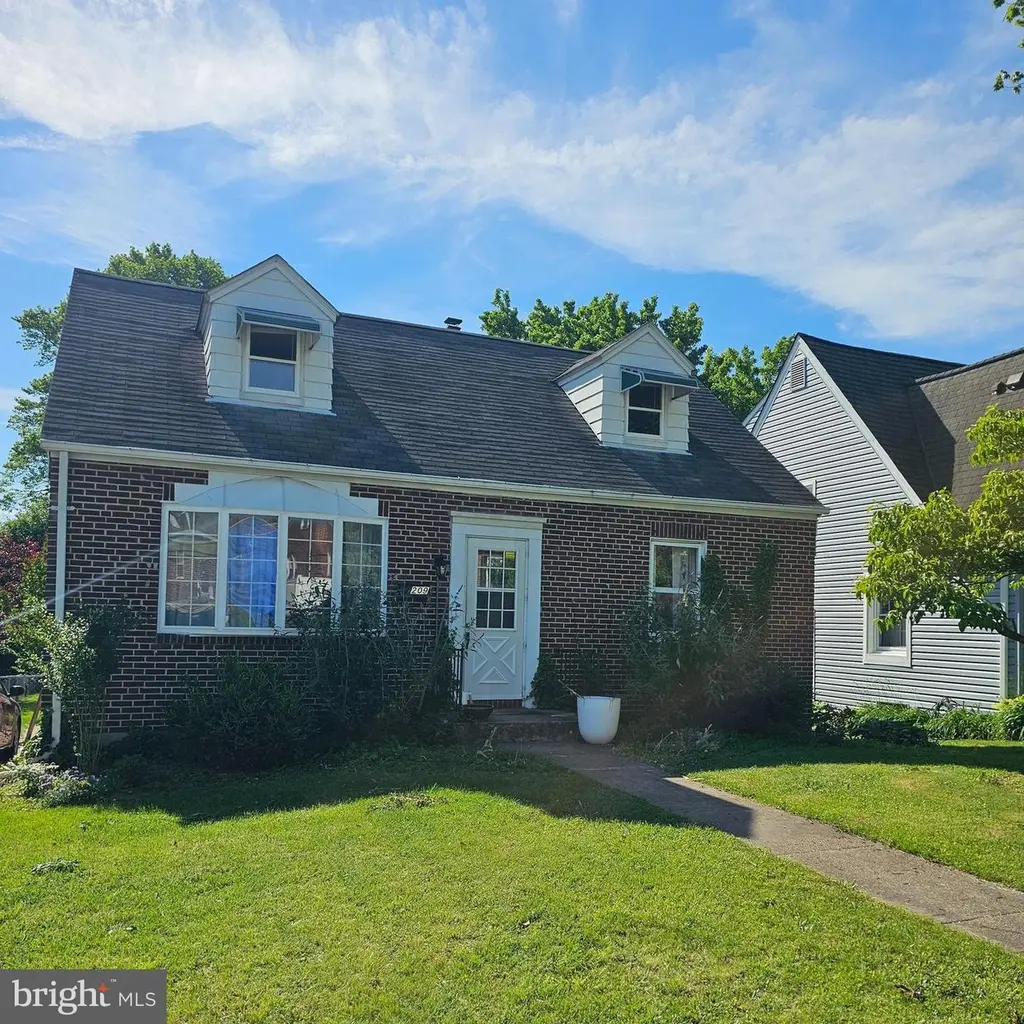
209 Linhigh Ave · Overlea, MD
Flood risk 1/10 · Minimal
- FEMA flood zone
- X (unshaded)
- Chance of flooding over 30 yrs
- 0.0%
- Est. flood insurance / yr
- $473 – $860
Fire risk 1/10 · Minimal
- Est. fire insurance / yr
- $755 – $1,403
Heat risk 7/10 · Major
- Hot days now (above 104°F)
- 7 days/yr
- Hot days in 30 yrs
- 15 days/yr
Wind risk 6/10 · Moderate
- Chance of severe wind over 30 yrs
- 27.0%
Air-quality risk 4/10 · Minor
- Unhealthy air days now
- 5 days/yr
- Unhealthy air days in 30 yrs
- 7 days/yr
Risk factors via First Street. Map © Google.
Why this score? — see what drove the D grade
The composite is a weighted blend of 9 inputs, each scored 0–100. Each bar is that input's sub-score; the figure is the points it added to the 100-point composite (weight × sub-score).
- Cash flow +13.0/30.0
- ARV discount +10.0/15.0
- Livability +4.0/5.0
- DSCR +3.9/10.0
- Rent growth +3.8/5.0
- 1% rule +3.2/10.0
- Condition / age +2.5/5.0
- Schools +2.3/10.0
- Appreciation +0.0/10.0
$315,000
🖨 Deal sheet 📄 Offer letter ✓ Due diligence
Listing remarks MLS
Wow you don't want to miss this wonderful 4 Bedroom Cape cod located in the sought-after Linhigh neighborhood. This well maintained home has been updated over the years and Shows beautifully! Gleaming hardwood floors throughout, Bright spacious Living Room with bay window, Large Eat-In--Kitchen walks out to Enclosed rear porch with Huge fenced rear yard, with fire pit and Patio area, There is also an Awesome Finished Basement with plush carpet and loads of storage, Upper level features two additional large bedrooms and so much more! Hurry make your appointment today!
Key facts
- 7,250 sq ft lot
- 2 parking spots
- Built 1949
Property features AI
Exterior
- Parking: Two total garage and parking spaces; Driveway with two spaces; Concrete and paved driveway; On-street, off-street and driveway parking available
- Utilities: Public water; Public sewer; Electric cooling fuel; Natural gas heating and hot water
- Home design: Detached property; Above-grade and below-grade living space
- Construction: Brick construction; Block foundation; Above grade and below grade structures
- Exterior features: Lot dimensions listed as 1.00 x; No tidal water
Interior
- Bedrooms: Two bedrooms on the main level; Two bedrooms on the upper level
- Bathrooms: One full bathroom on the main level; One full bathroom total
- Heating & cooling: Forced air heating; Natural gas heating and hot water; Central air conditioning (electric)
- Interior features: Partially finished basement; Living room; Sun/Florida room
Neighborhood map
What this means for you Summary
Snapshot
- This is a 4-bed/1.0-bath single-family listed at $315k.
Deal economics
- At list price, monthly cash flow is $-16 ($-193/yr) — negative.
- To cash-flow at today's rent, offer at most $312k (0.9% below list).
- To meet the 1% rule (rent ≥ 1% of price), the offer needs to be $259k (17.8% below list).
- Recommended offer: $259k (17.8% below list) — sets the bar for 1% rule.
Location & tenants
- Location reads 81/100 on livability (#38 in MD, #1,418 nationally) — a professional / high-income tenant draw. Strengths: amenities A+, commute A+, housing A+; Watch: crime F.
- Baltimore County Public Schools (suburban): math 15% / reading 34% proficiency, ranked #11 of 24 in MD (top 46%) — low school quality limits family demand, transient renter base, plan for 1-2y turnover.
- Market conditions: Rents rising fast (+5.3%/yr); 132 active listings in the ZIP; 11 comparable units currently listed for rent nearby; rentals at typical pace (median 24d on market — plan ~3-4 weeks tenant-placement turnaround); 45% of comp listings sitting > 30 days — soft ceiling on asking rent; solid renter incomes; 1,511 units permitted in Baltimore County in 2024 (643 in 5+ unit buildings).
- This rent runs 33% of the median local income ($95k/yr) — at the standard rent-burdened threshold; future hikes will face affordability resistance.
Forward outlook
- Local home prices are declining (-3.0%/yr); year-one equity from $2k of loan paydown is wiped out by about $9k of value loss. Plan a longer hold.
- Baltimore County population projected at +12% by 2050 — modest demand growth; plan on rents tracking national, not racing it.
Negotiation context
- Only 5 days on market — expect competitive offers; lowballing is unlikely to land.
- 7 sale attempts since 9y ago; this cycle's ask is 7% above the opening price — seller raised mid-cycle; expect resistance to lowballs.
Risks & watch-outs
- Watch-outs: built in 1949 — expect roof / HVAC / electrical / plumbing capex.
- Climate carrying-cost: major wind risk, 27% chance of damaging wind over 30y; extreme-heat days projected 7→15/yr by 2055 (HVAC capex compounding) — expect insurance premiums to compound above CPI over the hold.
Questions for the listing agent
- What do current leases actually rent for vs. the listed asking? Can we see a recent rent roll and the last 12 months of T-12 income?
- Built in 1949 — when were the roof, HVAC, electrical panel, plumbing, and water heater last replaced?
- Is there a deadline driving the sale (1031 exchange, divorce, estate, relocation)? That informs how much negotiation room exists.
- Crime grade is F in this area — have there been break-ins, vandalism, or insurance claims at this property in the last 3 years? What carrier currently insures it and at what premium?
- The area grade is low — what's the realistic commute time and amenity access for the typical tenant pool here? Any planned neighborhood developments (good or bad) we should know about?
- What's the average days-on-market for RENTAL listings here right now (not sales)? A rising rental-DOM trend means longer vacancies and softer asking-rent achievability than the comps imply.
- What's the recent tenant-quality profile in this submarket — average credit score on applications, eviction rate, late-payment / NSF rate, and stable-employment percentage? A property-management company in the area should have these aggregated.
- How much new for-sale + rental construction is in the pipeline within 1–3 miles? Heavy new supply typically softens prices + rents 12–24 months out; constrained supply supports both.
Investment metrics
- 1% rule
- 0.82% ✗
- Cap rate
- 6.23%
- Cash-on-cash
- -0.22%
- DSCR
- 0.99
- GRM
- 10.1
CMA / ARV
- ARV (on-the-fly)
- $333,746
- Comps found
- 12
Show comp detail 12 sales within ~0.75 mi
| Address | Dist | Beds/Ba | Sqft | Sold | Price | $/sf | Match |
|---|---|---|---|---|---|---|---|
| 104 Linhigh Ave | 0.21mi | 3/1.0 (-1) | 1,467 (-5%) | 8mo | $318,000 | $217 | 71 |
| 7536 Marks Ave | 0.22mi | 5/2.0 (+1) | 1,606 (+4%) | 7mo | $312,000 | $194 | 68 |
| 4209 Cardwell Ave | 0.21mi | 3/2.0 (-1) | 1,451 (-6%) | 6mo | $340,000 | $234 | 66 |
| 4212 Hazel Ave | 0.38mi | 3/2.0 (-1) | 1,505 (-2%) | 16mo | $322,000 | $214 | 56 |
| 7313 Beech Ave | 0.41mi | 3/2.0 (-1) | 1,586 (+3%) | 13mo | $173,100 | $109 | 56 |
| 9 Belhaven Dr | 0.38mi | 4/2.5 | 1,562 (+2%) | 23mo | $350,000 | $224 | 54 |
| 4215 Fowler Ave | 0.22mi | 4/3.0 | 1,686 (+10%) | 13mo | $375,000 | $222 | 54 |
| 22 Elinor Ave | 0.33mi | 4/2.0 | 1,746 (+14%) | 12mo | $350,000 | $200 | 48 |
| 4603-H Kenwood Ave | 0.67mi | 3/1.0 (-1) | 1,624 (+6%) | 7mo | $187,000 | $115 | 48 |
| 13 Elmont Ave | 0.65mi | 3/2.0 (-1) | 1,716 (+12%) | 2mo | $375,000 | $219 | 40 |
| 107 E Overlea Ave E | 0.75mi | 5/2.0 (+1) | 1,648 (+7%) | 9mo | $305,000 | $185 | 37 |
| 5309 Kenwood Ave | 0.74mi | 3/2.5 (-1) | 1,440 (-6%) | 16mo | $319,900 | $222 | 31 |
Match score weights: distance 35% · size 25% · config 20% · recency 20%. Top-matched comps best support the ARV.
Projected returns pro-forma
-3.0% appreciation · 5.34% rent growth · sell at horizon
- IRR
- -14.2%
- Equity multiple
- 0.48×
- Total profit
- $-45,856
- Equity at exit
- $46,968
- IRR
- -2.2%
- Equity multiple
- 0.84×
- Total profit
- $-14,505
- Equity at exit
- $27,235
Cash invested: $88,200 (down + closing). Projections, not guarantees.
Landlord ↔ Tenant lean methodology
- Overall (STATE)
- 27 Tenant-Leaning
- State Maryland
- 27 Tenant-Leaning · D+14
- County
- — inherits STATE
- City
- — inherits STATE
ZIP-level market 21236
- Rents YoY
- 5.3%
- Active inventory
- 132
- Price-to-rent
- 10.1×
Monthly cashflow live
- Estimated rent
- $2,591 high interval (Pro) →
- Mortgage (P&I)
- −$1,652
- Tax from tax record
- −$279 /mo · $3,354/yr
- Insurance
- −$131
- HOA
- −$0
- Vacancy / Maint / Mgmt
- −$544
- Net cashflow
- $-16
Break-even live
UW: 25.0% down · 7.5% · 30yr · 1.5% tax · 5.0% vac · 8.0% maint · 8.0% mgmt
Financing live
Cash to close
- Down payment
- $78,750
- Closing costs
- $9,450
- Reserves months
- —
- Total cash needed
- —
Loan-product check · same deal, 3 products live
Conventional
25% down · 7.5% · 30yr
- Down + closing
- —
- Monthly P&I
- —
- Monthly cashflow
- —
- DSCR
- —
- Eligible?
- —
Personal DTI + credit; lowest rate.
DSCR
20% down · 8.5% · 30yr
- Down + closing
- —
- Monthly P&I
- —
- Monthly cashflow
- —
- DSCR
- —
- Eligible?
- —
No personal income docs; deal must DSCR.
Hard money
10% down · 12.0% · 12mo
- Down + closing
- —
- Monthly P&I
- —
- Monthly cashflow
- —
- DSCR
- —
- Eligible?
- —
Short-term bridge; refi at stabilization.
Rent comps 11 comps
| Address | Beds | Baths | Sqft | Rent | $/sqft | DOM | Units | Dist |
|---|---|---|---|---|---|---|---|---|
| 100 Elinor Ave Nottingham, MD | 4.0 | 2.5 | 1800 | $2,800 | $1.56 | 24d | 1 | 0.29mi |
| 101 Elinor Ave Nottingham, MD | 4.0 | 2.0 | 1476 | $2,900 | $1.96 | 44d | 1 | 0.30mi |
| 5 Belhaven Dr Nottingham, MD | 4.0 | 1.5 | 1554 | $2,000 | $1.29 | 44d | 1 | 0.33mi |
| 5110 Kenwood Ave Baltimore, MD | 3.0 | 1.5 | 1406 | $2,500 | $1.78 | 44d | 1 | 0.53mi |
| 29 E Elm Ave Baltimore, MD | 3.0 | 2.0 | 2052 | $3,000 | $1.46 | 5d | 1 | 0.54mi |
| 3617 Double Rock Ln Parkville, MD | 3.0 | 2.5 | 2000 | $2,395 | $1.20 | 5d | 1 | 0.74mi |
| 7935 Belridge Rd Nottingham, MD | 1.0–3.0 | 1.0–1.5 | 974 | $2,172 | $2.23 | 2d | 17 | 0.99mi |
| 6504 Rosemont Ave Baltimore, MD | 5.0 | 3.0 | 2098 | $2,900 | $1.38 | 44d | 1 | 1.17mi |
| 5938 Clayton Ave Baltimore, MD | 4.0 | 2.0 | 1296 | $2,872 | $2.22 | 16d | 1 | 1.29mi |
| 3412 Fleetwood Ave Baltimore, MD | 3.0 | 2.5 | 1620 | $2,195 | $1.35 | 44d | 1 | 1.45mi |
| 3407 Orbitan Rd Parkville, MD | 3.0 | 1.5 | 1508 | $2,200 | $1.46 | 24d | 1 | 1.48mi |
Listing history 9 events
-
2026-06-17status $315,000 Pending 5 DOM
-
2026-06-16days on market $315,000 Active 5 DOM
-
2026-06-15days on market $315,000 Active 4 DOM
-
2026-06-13statusdays on market $315,000 Active 2 DOM
-
2026-06-09days on market $315,000 Coming Soon 3 DOM
-
2026-06-08remarks 699-char remark
-
2026-06-08days on market $315,000 Coming Soon 2 DOM
-
2026-06-07remarks 673-char remark
-
2026-06-07$315,000 Coming Soon 1 DOM
ⓘ Source: listings_history table (triggers on properties + properties_extension) + one-shot
backfill from property_details.listing_events for pre-trigger history.
Tax reassessment forecast MD · Partial reset (capped growth)
- Current annual tax
- $3,354 · $279/mo
- Projected year-2 tax
- $3,394 · $283/mo
- Expected delta
- +$40/yr (+$3/mo · 1.2%)
ⓘ Screening estimate from a state-policy table — verify with the county assessor before closing.
Climate risk First Street
- Flood 1/10 Low FEMA zone X (unshaded) · 0% chance over 30 yrs
- Wildfire 1/10 Low
- Heat 7/10 Severe 7 d/yr ≥104°F today · 15 d/yr by 30 yrs out
- Wind 6/10 Major 27% chance of damaging wind over 30 yrs
- Air quality 4/10 Moderate 5 unhealthy d/yr today · 7 by 30 yrs out
Nearby sold comps map
Loading sold comps map…
Walkable amenities ~0.75 mi
Loading nearby amenities…
Taxation est. · year 1
- Rental income
- $31,087
- − Mortgage interest
- −$17,645
- − Property taxes
- −$3,354
- − Insurance
- −$1,575
- − Repairs & maintenance
- −$2,487
- − Management
- −$2,487
- − Depreciation
- −$9,164
- Taxable loss
- −$5,624
- Est. tax savings @ 24.0%
- +$1,350
- After-tax cash flow
- $1,157/yr
For passive investors: Depreciation is non-cash, so a rental often shows a tax loss while cash-flowing — sheltering income. Rental losses are passive: they offset passive income freely, and up to $25,000/yr can offset ordinary (W-2) income if you actively participate and your MAGI is under $100k (phasing out to $0 by $150k); unused losses carry forward. On sale, claimed depreciation is recaptured at up to 25%, and gains may owe capital-gains tax (a 1031 exchange can defer both). Figures are a year-1 estimate at your 24.0% rate — not tax advice; consult a CPA.
Schools (NCES district)
- District
- Baltimore County Public Schools
- NCES district ID
- 2400120
- Math proficiency
- 15% ▼ -16.00%
- Reading proficiency
- 34% ▼ -5.00%
- Median HH income
- $66,746
- Composite
- 23.17/100
- National rank
- #7948
- State rank
- #11 of 24 in MD
Livability — Overlea
- Score
- 81/100
- State rank
- #38
- US rank
- #1418
Category grades
Schools grade is shown separately in the Schools card above.
Census & demographics
- Census place
- Overlea, MD
- County
- Baltimore County · 769,527 people
- Metro
- Baltimore-Columbia-Towson, MD
- Population (ZIP)
- 39,514
- Household income
- $95,149
- Rent vs Own
- Severe rent burden
- 1476.0
Population outlook (Baltimore County) Hauer SSP2
- Today (2025)
- 885,518 people
- By 2030
- 909,272 · +2.7%
- By 2040
- 951,547 · +7.5%
- By 2050
- 990,955 · +11.9%
- By 2075
- 1,086,411 · +22.7%
- By 2100
- 1,135,078 · +28.2%
Race, ethnicity, and origin ACS 2023
- Neighborhood character
- Diverse neighborhood (Simpson 0.63)
- Race & ethnicity
- White 56% Black 19% Asian 16% Hispanic / Latino 6% Two or more races 5%
- Hispanic origin (detail)
- Mexican 1% Puerto Rican 1%
- Common ancestry
- Romanian 5% Lithuanian 2% Italian 1%
- Foreign-born
- 17% · Canada, South Korea, Vietnam
- Languages at home
- 79% English-only · Other Indo-European 8% Spanish 3% Tagalog/Filipino 2%
Political lean MEDSL · Baltimore
- 2024 margin
- Strong D (+24.5) · D 61.0% · R 36.5% · Other 2.5%
- 2008→2024 swing
- +9.9pp toward D · 2008: 14.6pp · 2024: 24.5pp
- All cycles
- 2024: D+24.5 2020: D+27.0 2016: D+17.4 2012: D+16.4 2008: D+14.6
Not yet ingested
- Civics
- —
Market trends
- HPI YoY
- ▼ -268.43%
- Current HPI
- 244.9907
- Rent YoY
- ▲ 5.34%
- Metro
- Baltimore-Columbia-Towson, MD
- State GDP YoY
- ▲ 2.97%
- F500 in state
- 12
Industry mix (Fortune 500 HQ in MD)
| Industry | F500 HQs | Revenue |
|---|---|---|
| Aerospace / Defense | 1 | $71B |
|
||
| Utilities | 1 | $25B |
|
||
| Hotels | 1 | $24B |
|
||
| Consumer Goods | 1 | $7B |
|
||
| Real Estate | 1 | $6B |
|
||
| Chemicals | 1 | $2B |
|
||
Price history
+50.7% since first listed20 events — show timeline
- 2026-06-06 Coming Soon $315,000 BRIGHT MLS
- 2024-03-21 Sold (Public Records) $295,000 Public Records
- 2024-03-05 Sold (MLS) $295,000 BRIGHT MLS
- 2024-01-22 Pending — BRIGHT MLS
- 2024-01-12 Listed $295,000 BRIGHT MLS
- 2023-12-27 Coming Soon $295,000 BRIGHT MLS
- 2018-03-01 Sold (Public Records) $192,500 Public Records
- 2018-02-09 Sold (MLS) $192,500 BRIGHT MLS
- 2018-02-09 Sold (MLS) $192,500 MRIS
- 2018-01-10 Pending — MRIS
- 2017-09-29 Relisted — MRIS
- 2017-09-21 Relisted — MRIS
- 2017-09-21 Delisted — MRIS
- 2017-09-21 Delisted — MRIS
- 2017-09-20 Relisted — MRIS
- 2017-09-19 Relisted — MRIS
- 2017-09-19 Listed $208,990 BRIGHT MLS
- 2017-09-19 Listed $208,990 MRIS
- 2017-09-19 Delisted — MRIS
- 2017-09-19 Delisted — MRIS
Property tax history
+3.7%/yrLatest (2025): $3,354 · +0.5% YoY. Source: county tax records.
Cash-flow waterfall
monthlySold comps — $/sqft
last 12 mo · ≤1 miLoading sold comps…