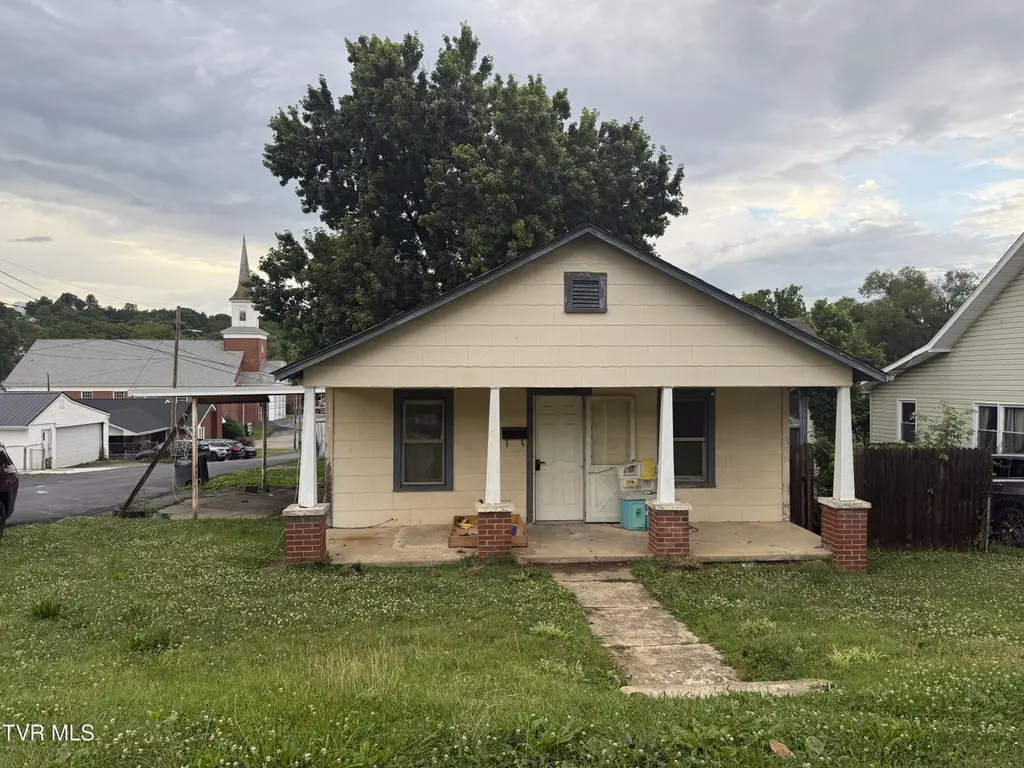
225 Lynn Ave · Kingsport, TN
Flood risk 1/10 · Minimal
- FEMA flood zone
- X (unshaded)
- Chance of flooding over 30 yrs
- 0.0%
- Est. flood insurance / yr
- $507 – $1,088
Fire risk 3/10 · Minor
- Est. fire insurance / yr
- $949 – $1,763
Heat risk 4/10 · Minor
- Hot days now (above 100°F)
- 7 days/yr
- Hot days in 30 yrs
- 20 days/yr
Wind risk 2/10 · Minimal
- Chance of severe wind over 30 yrs
- —
Air-quality risk 1/10 · Minimal
- Unhealthy air days now
- 0 days/yr
- Unhealthy air days in 30 yrs
- 0 days/yr
Risk factors via First Street. Map © Google.
Why this score? — see what drove the B grade
The composite is a weighted blend of 9 inputs, each scored 0–100. Each bar is that input's sub-score; the figure is the points it added to the 100-point composite (weight × sub-score).
- Cash flow +27.1/30.0
- ARV discount +15.0/15.0
- DSCR +9.4/10.0
- 1% rule +7.4/10.0
- Livability +3.6/5.0
- Schools +3.0/10.0
- Rent growth +2.5/5.0
- Condition / age +2.5/5.0
- Appreciation +1.3/10.0
$85,000
🖨 Deal sheet 📄 Offer letter ✓ Due diligence
Listing remarks MLS
Calling all investors! This property includes a house and a separate garage apartment. Two separate living quarters for the price of one. This home just needs a little TLC. The garage apartment is currently generating a monthly income. Buyer/Buyer's Agent to verify all information.
Key facts
- Close to schools
- Close to dining
- Renovation project
Tags
Property features AI
Exterior
- Parking: 2-car garage; 2-car carport; Asphalt parking
- Utilities: Public water; Public sewer
- Home design: Single-family house; One story; R 1B zoning; Located in Lynn Garden subdivision
- Construction: Brick and vinyl siding exterior; Shingle roof; Block foundation; Built as a house
- Exterior features: Level lot; Outbuilding
Interior
- Kitchen: Electric range
- Bathrooms: 1 full bathroom
- Heating & cooling: Central heating; Heat pump cooling
- Interior features: See remarks; Electric range
- Laundry & utility: Washer hookup; Electric dryer hookup
Neighborhood map
What this means for you Summary
Snapshot
- This is a 3-bed/1.0-bath single-family listed at $85k.
Deal economics
- At list price, monthly cash flow is $240 ($3k/yr) — positive.
- The deal already cash-flows at list — no discount required.
- Meets the 1% rule at list price ($1k rent vs $85k).
- Cap rate 9.7% vs local median 3.8% in Kingsport — top-decile yield for the area; either an underpriced asset or a hidden risk that comps aren't pricing in. Stress-test before assuming the spread holds.
Location & tenants
- Location reads 71/100 on livability (#39 in TN) — a middle-class / working-renter tenant base. Strengths: cost of living A+, health & safety A+, housing A; Watch: amenities C-, crime F, commute F.
- Kingsport (urban): math 35% / reading 38% proficiency, ranked #26 of 139 in TN (top 19%) — families likely to look elsewhere, expect single-tenant / working-renter base with shorter leases.
- Zoned schools: John F. Kennedy Elementary School (math 22% / reading 27%, grade F, #546 of 952 statewide, top 61%, 266 students, 0% FRL); John Sevier Middle School (math 21% / reading 24%, grade F, #172 of 333 statewide, top 52%, 750 students, 0% FRL); Dobyns - Bennett High School (math 23% / reading 56%, grade F, #28 of 332 statewide, top 9%, 2,514 students, 0% FRL) — zoned schools average 0% FRL vs 47% district-wide (47 pts lower); this property's tenant base skews higher-income than the district average.
- Market conditions: 30 active listings in the ZIP; 10 comparable units currently listed for rent nearby; rentals at typical pace (median 21d on market — plan ~3-4 weeks tenant-placement turnaround); 453 units permitted in Sullivan County in 2024 (6 in 5+ unit buildings).
Forward outlook
- Local home prices are declining (-3.0%/yr); year-one equity from $588 of loan paydown is wiped out by about $3k of value loss. Plan a longer hold.
- Sullivan County population projected to shrink 5% by 2050 — rents likely to lag national; underwrite the cash flow, not the appreciation.
- At projected returns (-3.0% appreciation + 3.0% rent growth), your $24k cash investment doubles in ~10 years — after that, you're playing with house money.
Negotiation context
- Only 9 days on market — expect competitive offers; lowballing is unlikely to land.
- 2 sale attempts since 6y ago with the ask held roughly flat each time — persistent listings suggest the price (not the market) is what's stuck; bring a comps-based counter.
- Current owner paid $26k; list at $85k implies a 233% gain — meaningful room to come down on a strong offer.
Risks & watch-outs
- Watch-outs: built in 1930 — expect roof / HVAC / electrical / plumbing capex.
Questions for the listing agent
- Built in 1930 — when were the roof, HVAC, electrical panel, plumbing, and water heater last replaced?
- Is there a deadline driving the sale (1031 exchange, divorce, estate, relocation)? That informs how much negotiation room exists.
- Schools are D-rated, which usually means shorter tenancies and higher turnover. Who's the typical renter profile here, and what's been the actual vacancy rate?
- Crime grade is F in this area — have there been break-ins, vandalism, or insurance claims at this property in the last 3 years? What carrier currently insures it and at what premium?
- What's the average days-on-market for RENTAL listings here right now (not sales)? A rising rental-DOM trend means longer vacancies and softer asking-rent achievability than the comps imply.
- What's the recent tenant-quality profile in this submarket — average credit score on applications, eviction rate, late-payment / NSF rate, and stable-employment percentage? A property-management company in the area should have these aggregated.
- How much new for-sale + rental construction is in the pipeline within 1–3 miles? Heavy new supply typically softens prices + rents 12–24 months out; constrained supply supports both.
Investment metrics
- 1% rule
- 1.24% ✓
- Cap rate
- 9.68%
- Cash-on-cash
- 12.09%
- DSCR
- 1.54
- GRM
- 6.7
CMA / ARV
- ARV (on-the-fly)
- $151,074
- Comps found
- 12
Show comp detail 12 sales within ~0.75 mi
| Address | Dist | Beds/Ba | Sqft | Sold | Price | $/sf | Match |
|---|---|---|---|---|---|---|---|
| 364 Glen Ave | 0.19mi | 3/1.0 | 980 (-0%) | 7mo | $156,700 | $160 | 85 |
| 205 Mullins St | 0.41mi | 3/1.0 | 996 (+2%) | 2mo | $140,000 | $141 | 77 |
| 364 Lynn Ave | 0.17mi | 3/1.0 | 888 (-10%) | 2mo | $160,000 | $180 | 75 |
| 233 Gravely Rd | 0.49mi | 3/1.0 | 960 (-2%) | 5mo | $139,000 | $145 | 69 |
| 427 Roan St | 0.38mi | 3/1.0 | 1,070 (+9%) | 4mo | $164,500 | $154 | 64 |
| 1937 Fairview Ave | 0.56mi | 3/1.0 | 926 (-6%) | 7mo | $215,500 | $233 | 59 |
| 1050 Cooper St | 0.32mi | 3/1.5 | 1,092 (+11%) | 7mo | $161,000 | $147 | 58 |
| 976 Lynn Garden Dr | 0.33mi | 2/2.0 (-1) | 1,069 (+9%) | 3mo | $147,000 | $138 | 58 |
| 137 Johnson St | 0.27mi | 2/1.0 (-1) | 840 (-14%) | 3mo | $125,000 | $149 | 56 |
| 1036 Oak Drive Cir | 0.67mi | 3/1.0 | 936 (-5%) | 7mo | $160,900 | $172 | 55 |
| 1141 Ridgecrest Ave | 0.65mi | 3/1.0 | 1,056 (+8%) | 6mo | $126,000 | $119 | 52 |
| 117 Dalton St | 0.47mi | 2/1.0 (-1) | 843 (-14%) | 9mo | $157,900 | $187 | 42 |
Match score weights: distance 35% · size 25% · config 20% · recency 20%. Top-matched comps best support the ARV.
Projected returns pro-forma
-3.0% appreciation · 3.0% rent growth · sell at horizon
- IRR
- 1.7%
- Equity multiple
- 1.06×
- Total profit
- $1,518
- Equity at exit
- $12,674
- IRR
- 11.3%
- Equity multiple
- 1.89×
- Total profit
- $21,070
- Equity at exit
- $7,349
Cash invested: $23,800 (down + closing). Projections, not guarantees.
Landlord ↔ Tenant lean methodology
- Overall (STATE)
- 87 Strongly Landlord-Friendly
- State Tennessee
- 87 Strongly Landlord-Friendly · R+13
- County
- — inherits STATE
- City
- — inherits STATE
ZIP-level market 37665
- Home prices YoY
- -2.6%
- Active inventory
- 30
- Price-to-rent
- 6.7×
Monthly cashflow live
- Estimated rent
- $1,058 high interval (Pro) →
- Mortgage (P&I)
- −$446
- Tax from tax record
- −$115 /mo · $1,377/yr
- Insurance
- −$35
- HOA
- −$0
- Vacancy / Maint / Mgmt
- −$222
- Net cashflow
- $240
Break-even live
UW: 25.0% down · 7.5% · 30yr · 1.5% tax · 5.0% vac · 8.0% maint · 8.0% mgmt
Financing live
Cash to close
- Down payment
- $21,250
- Closing costs
- $2,550
- Reserves months
- —
- Total cash needed
- —
Loan-product check · same deal, 3 products live
Conventional
25% down · 7.5% · 30yr
- Down + closing
- —
- Monthly P&I
- —
- Monthly cashflow
- —
- DSCR
- —
- Eligible?
- —
Personal DTI + credit; lowest rate.
DSCR
20% down · 8.5% · 30yr
- Down + closing
- —
- Monthly P&I
- —
- Monthly cashflow
- —
- DSCR
- —
- Eligible?
- —
No personal income docs; deal must DSCR.
Hard money
10% down · 12.0% · 12mo
- Down + closing
- —
- Monthly P&I
- —
- Monthly cashflow
- —
- DSCR
- —
- Eligible?
- —
Short-term bridge; refi at stabilization.
Rent comps 10 comps
| Address | Beds | Baths | Sqft | Rent | $/sqft | DOM | Units | Dist |
|---|---|---|---|---|---|---|---|---|
| 1040 Tiptop Ave Kingsport, TN | 2.0–3.0 | 2.0 | 947 | $1,025 | $1.08 | 13d | 1 | 0.07mi |
| 133 Walker St Kingsport, TN | 2.0 | 1.5 | 840 | $975 | $1.16 | 21d | 1 | 0.28mi |
| 208 Gravely Rd Kingsport, TN | 2.0 | 1.0 | 780 | $1,249 | $1.60 | 13d | 1 | 0.40mi |
| 1621 Arbor Pl Unit 4 Kingsport, TN | 2.0 | 1.0 | 900 | $1,000 | $1.11 | 43d | 1 | 0.46mi |
| 812 Burwind Ct Unit 812-3 Kingsport, TN | 2.0 | 1.0 | 800 | $950 | $1.19 | 21d | 1 | 0.51mi |
| 1208 Riverside Ave Kingsport, TN | 2.0 | 1.0 | 690 | $1,500 | $2.17 | 21d | 1 | 0.91mi |
| 1200 Riverside Ave Kingsport, TN | 2.0 | 1.0 | 624 | $1,200 | $1.92 | 13d | 1 | 0.92mi |
| 724 Teasel Dr Kingsport, TN | 1.0–2.0 | 1.0 | 927 | $999 | $1.08 | 21d | 1 | 0.99mi |
| 124 Bloomingdale Pike Kingsport, TN | 1.0–2.0 | 1.0–1.5 | 878 | $1,300 | $1.48 | 13d | 1 | 1.24mi |
| 340 E Carters Valley Rd Unit 1 Kingsport, TN | 2.0 | 1.0 | 870 | $925 | $1.06 | 21d | 1 | 1.39mi |
Listing history 10 events
-
2026-06-05statusdays on market $85,000 Pending 9 DOM
-
2026-06-03days on market $85,000 Active 8 DOM
-
2026-06-02days on market $85,000 Active 7 DOM
-
2026-06-01days on market $85,000 Active 6 DOM
-
2026-05-31days on market $85,000 Active 5 DOM
-
2026-05-30days on market $85,000 Active 4 DOM
-
2026-05-27$85,000 Active
-
2020-08-31soldstatus $25,500 282-char remark
Show marketing remark (282 chars)
Calling all investors! This property includes a house and a separate garage apartment. Two separate living quarters for the price of one. This home just needs a little TLC. The garage apartment is currently generating a monthly income. Buyer/Buyer's Agent to verify all information.
-
2020-06-02$35,000 282-char remark
Show marketing remark (282 chars)
Calling all investors! This property includes a house and a separate garage apartment. Two separate living quarters for the price of one. This home just needs a little TLC. The garage apartment is currently generating a monthly income. Buyer/Buyer's Agent to verify all information.
-
1989-04-19soldstatus $25,000
ⓘ Source: listings_history table (triggers on properties + properties_extension) + one-shot
backfill from property_details.listing_events for pre-trigger history.
Tax reassessment forecast TN · Resets to sale price
- Current annual tax
- $1,377 · $115/mo
- Projected year-2 tax
- $1,377 · $115/mo
- Expected delta
- $0/yr ($0/mo · 0.0%)
ⓘ Screening estimate from a state-policy table — verify with the county assessor before closing.
Climate risk First Street
- Flood 1/10 Low FEMA zone X (unshaded) · 0% chance over 30 yrs
- Wildfire 3/10 Moderate
- Heat 4/10 Moderate 7 d/yr ≥100°F today · 20 d/yr by 30 yrs out
- Wind 2/10 Low
- Air quality 1/10 Low 0 unhealthy d/yr today · 0 by 30 yrs out
Nearby sold comps map
Loading sold comps map…
Walkable amenities ~0.75 mi
Loading nearby amenities…
Taxation est. · year 1
- Rental income
- $12,693
- − Mortgage interest
- −$4,761
- − Property taxes
- −$1,377
- − Insurance
- −$425
- − Repairs & maintenance
- −$1,015
- − Management
- −$1,015
- − Depreciation
- −$2,473
- Taxable income
- $1,627
- Est. tax owed @ 24.0%
- −$390
- After-tax cash flow
- $2,487/yr
For passive investors: Depreciation is non-cash, so a rental often shows a tax loss while cash-flowing — sheltering income. Rental losses are passive: they offset passive income freely, and up to $25,000/yr can offset ordinary (W-2) income if you actively participate and your MAGI is under $100k (phasing out to $0 by $150k); unused losses carry forward. On sale, claimed depreciation is recaptured at up to 25%, and gains may owe capital-gains tax (a 1031 exchange can defer both). Figures are a year-1 estimate at your 24.0% rate — not tax advice; consult a CPA.
Schools (NCES district)
- District
- Kingsport
- NCES district ID
- 4702190
- Math proficiency
- 35% ▼ -12.00%
- Reading proficiency
- 38% ▼ -5.00%
- Median HH income
- $38,017
- Composite
- 30.44/100
- National rank
- #6233
- State rank
- #26 of 139 in TN
Livability — Kingsport
- Score
- 71/100
- State rank
- #39
- US rank
- #6587
Category grades
Schools grade is shown separately in the Schools card above.
Census & demographics
- Census place
- Kingsport, TN
- City population
- 83,493
- Population (ZIP)
- 5,156
Population outlook (Sullivan County) Hauer SSP2
- Today (2025)
- 157,030 people
- By 2030
- 156,415 · -0.4%
- By 2040
- 153,778 · -2.1%
- By 2050
- 149,018 · -5.1%
- By 2075
- 138,068 · -12.1%
- By 2100
- 119,927 · -23.6%
Race, ethnicity, and origin ACS 2023
- Neighborhood character
- Predominantly White (94%)
- Race & ethnicity
- White 94% Hispanic / Latino 4% Two or more races 3%
- Common ancestry
- Italian 6% Serbian 3% Slovak 1%
- Foreign-born
- 1% · Canada
- Languages at home
- 93% English-only · Spanish 7%
Political lean MEDSL · Sullivan
- 2024 margin
- Solid R (+55.0) · D 22.0% · R 77.0% · Other 1.0%
- 2008→2024 swing
- -13.6pp toward R · 2008: -41.3pp · 2024: -55.0pp
- All cycles
- 2024: R+55.0 2020: R+51.9 2016: R+56.2 2012: R+47.2 2008: R+41.3
Not yet ingested
- Civics
- —
Market trends
- HPI YoY
- ▼ -7.36%
- Current HPI
- 275.7692
- Rent YoY
- —
- Metro
- —
- State GDP YoY
- ▲ 2.78%
- F500 in state
- 22
Industry mix (Fortune 500 HQ in TN)
| Industry | F500 HQs | Revenue |
|---|---|---|
| Healthcare | 3 | $91B |
|
||
| Retail | 3 | $72B |
|
||
| Transportation / Logistics | 1 | $88B |
|
||
| Paper / Packaging | 1 | $19B |
|
||
| Insurance | 1 | $13B |
|
||
| Energy | 1 | $12B |
|
||
Price history
+240.0% since first listed4 events — show timeline
- 2026-05-27 Listed $85,000 TVRMLS
- 2020-08-31 Sold (MLS) $25,500 TVRMLS
- 2020-06-02 Listed $35,000 TVRMLS
- 1989-04-19 Sold (Public Records) $25,000 Public Records
Property tax history
+7.4%/yrLatest (2025): $1,377 · +50.3% YoY. Source: county tax records.
Cash-flow waterfall
monthlySold comps — $/sqft
last 12 mo · ≤1 miLoading sold comps…