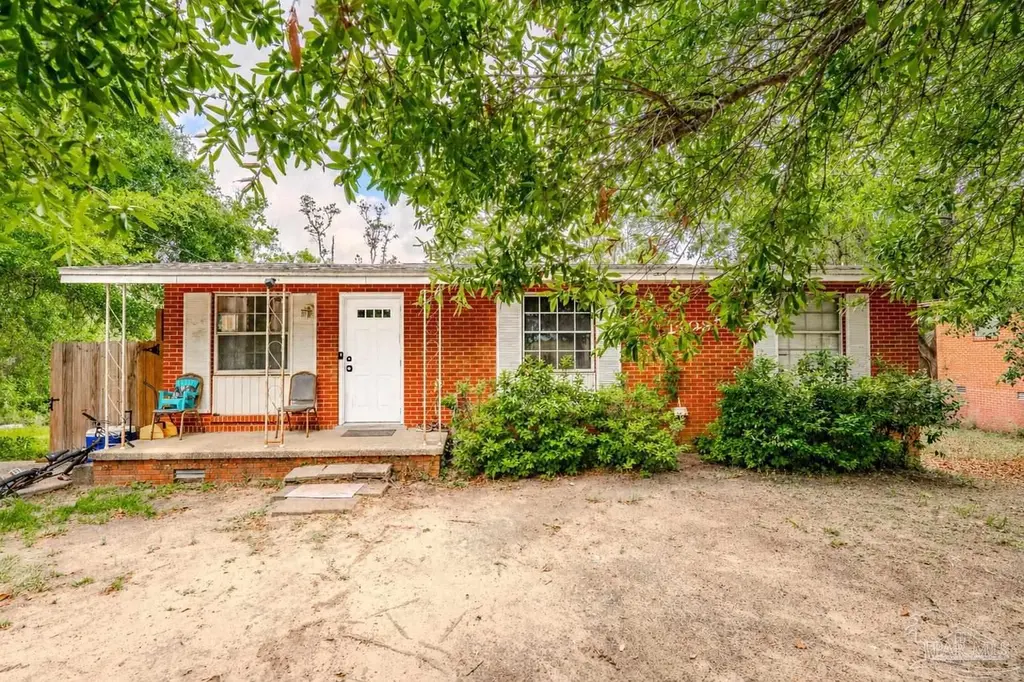
1408 Clio Dr · West Pensacola, FL
Flood risk 4/10 · Minor
- FEMA flood zone
- X (unshaded)
- Chance of flooding over 30 yrs
- 0.22%
- Est. flood insurance / yr
- $507 – $1,088
Fire risk 1/10 · Minimal
- Est. fire insurance / yr
- $947 – $1,759
Heat risk 10/10 · Severe
- Hot days now (above 105°F)
- 6 days/yr
- Hot days in 30 yrs
- 19 days/yr
Wind risk 9/10 · Severe
- Chance of severe wind over 30 yrs
- 99.0%
Air-quality risk 1/10 · Minimal
- Unhealthy air days now
- 0 days/yr
- Unhealthy air days in 30 yrs
- 0 days/yr
Risk factors via First Street. Map © Google.
Why this score? — see what drove the C+ grade
The composite is a weighted blend of 9 inputs, each scored 0–100. Each bar is that input's sub-score; the figure is the points it added to the 100-point composite (weight × sub-score).
- Cash flow +24.4/30.0
- ARV discount +13.2/15.0
- DSCR +7.9/10.0
- 1% rule +5.7/10.0
- Rent growth +3.7/5.0
- Schools +3.6/10.0
- Livability +3.3/5.0
- Condition / age +2.5/5.0
- Appreciation +0.0/10.0
$145,000
🖨 Deal sheet 📄 Offer letter ✓ Due diligence
Listing remarks
Welcome to this charming 3-bedroom, 1-bath brick home nestled on a spacious 0.18-acre lot surrounded by mature trees and natural greenery. Enjoy relaxing mornings on the covered front porch or unwind in the large backyard offering plenty of space for outdoor living, entertaining, or future improvements. Inside, the home features a functional layout with a comfortable living area, dedicated dining space, and an interior laundry room for added convenience. The kitchen offers ample cabinet storage and natural light with views of the backyard. With solid construction and great potential, this property is perfect for buyers looking to personalize a home or investors seeking their next opportunit
Key facts
- Covered front porch
- Large backyard
- Natural light
Tags
Property features AI
Finance
- Other: Located on a county-maintained road
- HOA & community: No association
Exterior
- Parking: 2 spaces per unit
- Utilities: Public water; Public sewer; Copper wiring with circuit breakers
- Home design: Single-story home; Resale property; Not attached to another property; One level
- Construction: Frame construction; Off-grade foundation
- Exterior features: Interior lot; Shingle roof
Interior
- Kitchen: Not updated; Electric water heater
- Bedrooms: Master bedroom on the first floor (15' x 12'); Bedroom 1 on the first floor (12' x 12'); Bedroom 2 on the first floor (12' x 10')
- Flooring: Tile; Carpet; Laminate
- Bathrooms: One full bathroom — updated within the last 6–10 years (see photos)
- Heating & cooling: Central heating; Central air; Ceiling fans
- Interior features: Tile, carpet, and laminate flooring; Kitchen/dining combo
- Laundry & utility: Electric water heater
Neighborhood map
What this means for you Summary
Snapshot
- This is a 3-bed/1.0-bath single-family listed at $145k.
Deal economics
- At list price, monthly cash flow is $295 ($4k/yr) — positive.
- The deal already cash-flows at list — no discount required.
- Meets the 1% rule at list price ($2k rent vs $145k).
- Recommended offer: $141k (3.0% below list) — sets the bar for market timing.
Location & tenants
- Location reads 66/100 on livability (#629 in FL) — a middle-class / working-renter tenant base. Strengths: cost of living A+, housing A+, health & safety B+; Watch: crime D, schools F, amenities F.
- Escambia (suburban): math 40% / reading 45% proficiency, ranked #56 of 73 in FL (top 77%) — families likely to look elsewhere, expect single-tenant / working-renter base with shorter leases.
- Market conditions: Rents rising fast (+4.9%/yr); 198 active listings in the ZIP; 17 comparable units currently listed for rent nearby; rentals at typical pace (median 23d on market — plan ~3-4 weeks tenant-placement turnaround); lower-income renter base — watch delinquency; 1,479 units permitted in Escambia County in 2024 (0 in 5+ unit buildings).
- This rent runs 42% of the median local income ($45k/yr) — at the standard rent-burdened threshold; future hikes will face affordability resistance.
Forward outlook
- Local home prices are declining (-3.0%/yr); year-one equity from $1k of loan paydown is wiped out by about $4k of value loss. Plan a longer hold.
- Escambia County population projected at +13% by 2050 — modest demand growth; plan on rents tracking national, not racing it.
- At projected returns (-3.0% appreciation + 4.9% rent growth), your $41k cash investment doubles in ~10 years — after that, you're playing with house money.
Negotiation context
- It's been on market 51 days — a 3% lower offer ($141k) is reasonable based on typical stale-listing flexibility.
- 2 sale attempts since 19y ago; this cycle's ask has dropped $35k (19%) from the opening price — seller is motivated, your offer sets the floor, not the list.
- Current owner paid $50k; list at $145k implies a 191% gain — meaningful room to come down on a strong offer.
Risks & watch-outs
- Climate carrying-cost: severe wind risk, 99% chance of damaging wind over 30y; extreme-heat days projected 6→19/yr by 2055 (HVAC capex compounding) — expect insurance premiums to compound above CPI over the hold.
Questions for the listing agent
- It's been on market 51 days. Have you received any prior offers? Is the seller open to a 3% concession, seller financing, or rate buy-down credit?
- Built in 1964 — when were the roof, HVAC, electrical panel, plumbing, and water heater last replaced?
- Is there a deadline driving the sale (1031 exchange, divorce, estate, relocation)? That informs how much negotiation room exists.
- Schools are F-rated, which usually means shorter tenancies and higher turnover. Who's the typical renter profile here, and what's been the actual vacancy rate?
- Crime grade is D in this area — have there been break-ins, vandalism, or insurance claims at this property in the last 3 years? What carrier currently insures it and at what premium?
- What's the average days-on-market for RENTAL listings here right now (not sales)? A rising rental-DOM trend means longer vacancies and softer asking-rent achievability than the comps imply.
- What's the recent tenant-quality profile in this submarket — average credit score on applications, eviction rate, late-payment / NSF rate, and stable-employment percentage? A property-management company in the area should have these aggregated.
- How much new for-sale + rental construction is in the pipeline within 1–3 miles? Heavy new supply typically softens prices + rents 12–24 months out; constrained supply supports both.
Investment metrics
- 1% rule
- 1.07% ✓
- Cap rate
- 8.73%
- Cash-on-cash
- 8.71%
- DSCR
- 1.39
- GRM
- 7.8
CMA / ARV
- ARV (median comp)
- $165,973
- List price
- $145,000
- Delta
- -12.64%
- Verdict
- UNDERPRICED
- Comps
- 20 within 1.0 mi
Show comp detail 12 sales within ~0.75 mi
| Address | Dist | Beds/Ba | Sqft | Sold | Price | $/sf | Match |
|---|---|---|---|---|---|---|---|
| 1020 E Madison Dr | 0.29mi | 3/2.0 | 1,042 (+2%) | 6mo | $175,000 | $168 | 75 |
| 219 Mckinley Dr | 0.62mi | 3/1.0 | 1,025 (0%) | 1mo | $160,000 | $156 | 70 |
| 4509 Cherbourg Way | 0.52mi | 3/1.5 | 1,040 (+2%) | 2mo | $159,000 | $153 | 70 |
| 219 Opal Ave | 0.47mi | 3/1.0 | 1,012 (-1%) | 8mo | $117,500 | $116 | 70 |
| 1309 Belair Dr | 0.45mi | 3/1.5 | 1,000 (-2%) | 5mo | $118,000 | $118 | 69 |
| 1201 Belair Rd | 0.42mi | 3/1.5 | 988 (-4%) | 4mo | $162,000 | $164 | 69 |
| 4413 Ellysee Way | 0.55mi | 3/1.5 | 1,012 (-1%) | 2mo | $90,000 | $89 | 68 |
| 835 S Madison Dr | 0.54mi | 3/1.0 | 1,014 (-1%) | 6mo | $81,500 | $80 | 68 |
| 202 Emerald Ave | 0.57mi | 3/1.5 | 1,012 (-1%) | 6mo | $137,500 | $136 | 65 |
| 4513 Guerlain Way | 0.59mi | 3/1.0 | 1,012 (-1%) | 8mo | $155,000 | $153 | 64 |
| 603 New York Dr | 0.53mi | 3/1.0 | 964 (-6%) | 2mo | $125,000 | $130 | 63 |
| 918 Belair Rd | 0.59mi | 3/2.0 | 1,012 (-1%) | 7mo | $160,000 | $158 | 61 |
Match score weights: distance 35% · size 25% · config 20% · recency 20%. Top-matched comps best support the ARV.
Projected returns pro-forma
-3.0% appreciation · 4.92% rent growth · sell at horizon
- IRR
- -1.1%
- Equity multiple
- 0.96×
- Total profit
- $-1,677
- Equity at exit
- $21,620
- IRR
- 10.4%
- Equity multiple
- 1.88×
- Total profit
- $35,715
- Equity at exit
- $12,537
Cash invested: $40,600 (down + closing). Projections, not guarantees.
Landlord ↔ Tenant lean methodology
- Overall (STATE)
- 87 Strongly Landlord-Friendly
- State Florida
- 87 Strongly Landlord-Friendly · R+3
- County
- — inherits STATE
- City
- — inherits STATE
ZIP-level market 32505
- Home prices YoY
- -26.5%
- Rents YoY
- 4.9%
- Active inventory
- 198
- Price-to-rent
- 7.8×
Monthly cashflow live
- Estimated rent
- $1,556 high interval (Pro) →
- Mortgage (P&I)
- −$760
- Tax from tax record
- −$114 /mo · $1,365/yr
- Insurance
- −$60
- HOA
- −$0
- Vacancy / Maint / Mgmt
- −$327
- Net cashflow
- $295
Break-even live
UW: 25.0% down · 7.5% · 30yr · 1.5% tax · 5.0% vac · 8.0% maint · 8.0% mgmt
Financing live
Cash to close
- Down payment
- $36,250
- Closing costs
- $4,350
- Reserves months
- —
- Total cash needed
- —
Loan-product check · same deal, 3 products live
Conventional
25% down · 7.5% · 30yr
- Down + closing
- —
- Monthly P&I
- —
- Monthly cashflow
- —
- DSCR
- —
- Eligible?
- —
Personal DTI + credit; lowest rate.
DSCR
20% down · 8.5% · 30yr
- Down + closing
- —
- Monthly P&I
- —
- Monthly cashflow
- —
- DSCR
- —
- Eligible?
- —
No personal income docs; deal must DSCR.
Hard money
10% down · 12.0% · 12mo
- Down + closing
- —
- Monthly P&I
- —
- Monthly cashflow
- —
- DSCR
- —
- Eligible?
- —
Short-term bridge; refi at stabilization.
Rent comps 17 comps
| Address | Beds | Baths | Sqft | Rent | $/sqft | DOM | Units | Dist |
|---|---|---|---|---|---|---|---|---|
| 707 New York Dr Pensacola, FL | 2.0 | 1.0 | 1266 | $1,185 | $0.94 | 23d | 1 | 0.51mi |
| 221 Edison Dr Pensacola, FL | 3.0 | 1.0 | 1500 | $1,598 | $1.07 | 23d | 1 | 0.65mi |
| 3216 Two Sisters Way Pensacola, FL | 3.0 | 2.0 | 1117 | $1,700 | $1.52 | 23d | 1 | 0.86mi |
| 3417 W Fisher St Unit C Pensacola, FL | 3.0 | 2.0 | 1106 | $1,350 | $1.22 | 23d | 1 | 0.87mi |
| 918 Montclair Rd Pensacola, FL | 3.0 | 1.0 | 1012 | $1,500 | $1.48 | 13d | 1 | 0.88mi |
| 2301 W Michigan Ave #21 Pensacola, FL | 2.0 | 2.5 | 1164 | $1,325 | $1.14 | 23d | 1 | 0.95mi |
| 2303 W Michigan Ave Unit A6 Pensacola, FL | 2.0 | 2.0 | 1014 | $1,300 | $1.28 | 23d | 1 | 0.95mi |
| 5602 W Shore Dr Unit B Pensacola, FL | 2.0 | 2.0 | 920 | $1,250 | $1.36 | 23d | 1 | 1.06mi |
| 902 Lucerne Ave Pensacola, FL | 3.0 | 2.0 | 1276 | $1,600 | $1.25 | 23d | 1 | 1.09mi |
| 2355 W Michigan Ave Pensacola, FL | 1.0–2.0 | 1.0–2.0 | 850 | $1,450 | $1.71 | 13d | 9 | 1.12mi |
| 2300 W Michigan Ave #12 Pensacola, FL | 2.0 | 2.0 | 1050 | $1,300 | $1.24 | 23d | 1 | 1.15mi |
| 101 Vanderbilt Rd Pensacola, FL | 3.0 | 2.0 | 1104 | $1,850 | $1.68 | 21d | 1 | 1.22mi |
| 2702 Massachusetts Ave Pensacola, FL | 1.0–3.0 | 1.0–2.5 | 1150 | $1,745 | $1.52 | 13d | 9 | 1.26mi |
| 5180 Burlington Ave Pensacola, FL | 3.0 | 2.0 | 1184 | $1,650 | $1.39 | 23d | 1 | 1.29mi |
| 925 Twinbrook Ave Pensacola, FL | 3.0 | 1.0 | 1105 | $1,750 | $1.58 | 23d | 1 | 1.35mi |
| 5207 Charbar Dr Unit B Pensacola, FL | 2.0 | 1.0 | 850 | $1,050 | $1.24 | 23d | 1 | 1.38mi |
| 5877 Tryton Cir Pensacola, FL | 4.0 | 2.0 | 1419 | $1,825 | $1.29 | 23d | 1 | 1.50mi |
Listing history 22 events
-
2026-06-18days on market $145,000 Active 51 DOM
-
2026-06-17days on market $145,000 Active 50 DOM
-
2026-06-16days on market $145,000 Active 49 DOM
-
2026-06-15days on market $145,000 Active 48 DOM
-
2026-06-14pricedays on market $145,000 Active 46 DOM
-
2026-06-10days on market $150,000 Active 43 DOM
-
2026-06-09days on market $150,000 Active 42 DOM
-
2026-06-08days on market $150,000 Active 41 DOM
-
2026-06-07days on market $150,000 Active 40 DOM
-
2026-06-03days on market $150,000 Active 36 DOM
-
2026-06-02days on market $150,000 Active 35 DOM
-
2026-06-01days on market $150,000 Active 34 DOM
-
2026-05-31days on market $150,000 Active 33 DOM
-
2026-05-31days on market $150,000 Active 32 DOM
-
2026-05-14price $155,000 765-char remark
-
2026-04-29price $165,000 765-char remark
-
2026-04-28$180,000 Active 765-char remark
-
2008-02-28historical
-
2007-09-05$84,900
-
1999-05-20soldstatus $49,900
-
1996-03-12soldstatus $45,000
-
1992-05-01soldstatus $32,000
ⓘ Source: listings_history table (triggers on properties + properties_extension) + one-shot
backfill from property_details.listing_events for pre-trigger history.
Tax reassessment forecast FL · Resets to sale price
- Current annual tax
- $1,365 · $114/mo
- Projected year-2 tax
- $1,365 · $114/mo
- Expected delta
- $0/yr ($0/mo · 0.0%)
ⓘ Screening estimate from a state-policy table — verify with the county assessor before closing.
Climate risk First Street
- Flood 4/10 Moderate FEMA zone X (unshaded) · 22% chance over 30 yrs
- Wildfire 1/10 Low
- Heat 10/10 Extreme 6 d/yr ≥105°F today · 19 d/yr by 30 yrs out
- Wind 9/10 Extreme 99% chance of damaging wind over 30 yrs
- Air quality 1/10 Low 0 unhealthy d/yr today · 0 by 30 yrs out
Nearby sold comps map
Loading sold comps map…
Walkable amenities ~0.75 mi
Loading nearby amenities…
Taxation est. · year 1
- Rental income
- $18,673
- − Mortgage interest
- −$8,122
- − Property taxes
- −$1,365
- − Insurance
- −$725
- − Repairs & maintenance
- −$1,494
- − Management
- −$1,494
- − Depreciation
- −$4,218
- Taxable income
- $1,255
- Est. tax owed @ 24.0%
- −$301
- After-tax cash flow
- $3,236/yr
For passive investors: Depreciation is non-cash, so a rental often shows a tax loss while cash-flowing — sheltering income. Rental losses are passive: they offset passive income freely, and up to $25,000/yr can offset ordinary (W-2) income if you actively participate and your MAGI is under $100k (phasing out to $0 by $150k); unused losses carry forward. On sale, claimed depreciation is recaptured at up to 25%, and gains may owe capital-gains tax (a 1031 exchange can defer both). Figures are a year-1 estimate at your 24.0% rate — not tax advice; consult a CPA.
Schools (NCES district)
- District
- Escambia
- NCES district ID
- 1200510
- Math proficiency
- 40% ▼ -9.00%
- Reading proficiency
- 45% ▼ -4.00%
- Median HH income
- $44,649
- Composite
- 36.04/100
- National rank
- #4773
- State rank
- #56 of 73 in FL
Livability — West Pensacola
- Score
- 66/100
- State rank
- #629
- US rank
- #12275
Category grades
Schools grade is shown separately in the Schools card above.
Census & demographics
- Census place
- West Pensacola, FL
- County
- Escambia County · 301,722 people
- Metro
- Pensacola-Ferry Pass-Brent, FL
- Population (ZIP)
- 27,877
- Household income
- $44,783
- Rent vs Own
- Severe rent burden
- 1458.0
Population outlook (Escambia County) Hauer SSP2
- Today (2025)
- 334,637 people
- By 2030
- 345,779 · +3.3%
- By 2040
- 364,828 · +9.0%
- By 2050
- 378,514 · +13.1%
- By 2075
- 403,220 · +20.5%
- By 2100
- 386,125 · +15.4%
Race, ethnicity, and origin ACS 2023
- Neighborhood character
- Diverse neighborhood (Simpson 0.66)
- Race & ethnicity
- Black 48% White 32% Hispanic / Latino 11% Two or more races 9% Asian 2%
- Hispanic origin (detail)
- Mexican 5% Cuban 2%
- Common ancestry
- Slovak 2% Italian 1% Serbian 1%
- Foreign-born
- 9% · Canada, Vietnam
- Languages at home
- 87% English-only · Spanish 9% Other Indo-European 1% Vietnamese 1%
Political lean MEDSL · Escambia
- 2024 margin
- R (+19.5) · D 39.7% · R 59.2% · Other 1.1%
- 2008→2024 swing
- -0.2pp no change · 2008: -19.3pp · 2024: -19.5pp
- All cycles
- 2024: R+19.5 2020: R+15.1 2016: R+20.6 2012: R+20.6 2008: R+19.3
Not yet ingested
- Civics
- —
Market trends
- HPI YoY
- ▼ -74.10%
- Current HPI
- 205.45
- Rent YoY
- ▲ 4.92%
- Metro
- Pensacola-Ferry Pass-Brent, FL
- State GDP YoY
- ▲ 3.28%
- F500 in state
- 36
Industry mix (Fortune 500 HQ in FL)
| Industry | F500 HQs | Revenue |
|---|---|---|
| Industrial Technology | 2 | $29B |
|
||
| Insurance | 2 | $17B |
|
||
| Retail | 1 | $60B |
|
||
| Technology Distribution | 1 | $58B |
|
||
| Homebuilding | 1 | $35B |
|
||
| Technology Manufacturing | 1 | $35B |
|
||
Price history
+353.1% since first listed10 events — show timeline
- 2026-06-13 Price Changed $145,000 PARMLS
- 2026-05-25 Price Changed $150,000 PARMLS
- 2026-05-14 Price Changed $155,000 PARMLS
- 2026-04-29 Price Changed $165,000 PARMLS
- 2026-04-28 Listed $180,000 PARMLS
- 2008-02-28 Listing Removed — PARMLS
- 2007-09-05 Listed $84,900 PARMLS
- 1999-05-20 Sold (Public Records) $49,900 Public Records
- 1996-03-12 Sold (Public Records) $45,000 Public Records
- 1992-05-01 Sold (Public Records) $32,000 Public Records
Property tax history
+7.5%/yrLatest (2025): $1,365 · +20.7% YoY. Source: county tax records.
Cash-flow waterfall
monthlySold comps — $/sqft
last 12 mo · ≤1 miLoading sold comps…