 Multi-family
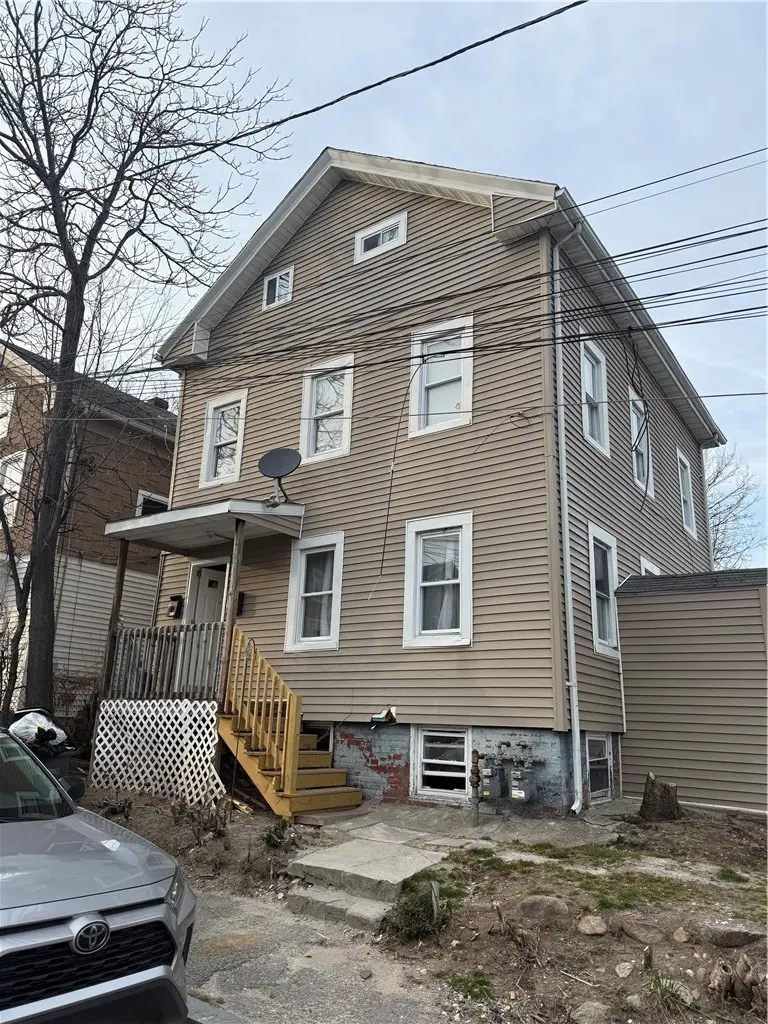
14 Dome St · Providence, RI
Flood risk 1/10 · Minimal
- FEMA flood zone
- X (unshaded)
- Chance of flooding over 30 yrs
- 0.0%
- Est. flood insurance / yr
- $473 – $860
Fire risk 1/10 · Minimal
- Est. fire insurance / yr
- $835 – $1,551
Heat risk 5/10 · Moderate
- Hot days now (above 97°F)
- 7 days/yr
- Hot days in 30 yrs
- 15 days/yr
Wind risk 6/10 · Moderate
- Chance of severe wind over 30 yrs
- 70.0%
Air-quality risk 2/10 · Minimal
- Unhealthy air days now
- 1 days/yr
- Unhealthy air days in 30 yrs
- 2 days/yr
Risk factors via First Street. Map © Google.
Why this score? — see what drove the B- grade
The composite is a weighted blend of 9 inputs, each scored 0–100. Each bar is that input's sub-score; the figure is the points it added to the 100-point composite (weight × sub-score).
- Cash flow +29.7/30.0
- DSCR +10.0/10.0
- ARV discount +7.5/15.0
- 1% rule +7.4/10.0
- Livability +4.2/5.0
- Rent growth +3.9/5.0
- Condition / age +2.5/5.0
- Schools +1.0/10.0
- Appreciation +0.0/10.0
$524,500
🖨 Deal sheet 📄 Offer letter ✓ Due diligence
Multi-family units
County records classify this as Multi-Family (2-4 Unit). Listing-text estimate: 1 unit. estimate disagrees with records
Listing remarks MLS
Attention investors/flippers: Two family house in need of rehab located near PC and everything Providence has to offer. Cash/private financing offers only.
Key facts
- 4,000 sq ft lot
- 6 parking spots
- Built 1900
Neighborhood map
What this means for you Summary
Snapshot
- This is a 4-bed/2.5-bath multifamily listed at $524k.
Deal economics
- At list price, monthly cash flow is $2k ($23k/yr) — positive.
- The deal already cash-flows at list — no discount required.
- Meets the 1% rule at list price ($6k rent vs $524k).
- Cap rate 10.6% vs local median 4.2% in Providence — top-decile yield for the area; either an underpriced asset or a hidden risk that comps aren't pricing in. Stress-test before assuming the spread holds.
Location & tenants
- Location reads 84/100 on livability (#2 in RI, #794 nationally) — a professional / high-income tenant draw. Strengths: amenities A+, commute A+, housing A+; Watch: employment C-, schools F.
- Providence (urban): math 8% / reading 16% proficiency, ranked #34 of 39 in RI (top 87%) — low school quality limits family demand, transient renter base, plan for 1-2y turnover; 79% free/reduced lunch — lower-income household profile, screen leases tightly.
- Market conditions: Rents rising fast (+5.5%/yr); 161 active listings in the ZIP; 11 comparable units currently listed for rent nearby; rentals at typical pace (median 17d on market — plan ~3-4 weeks tenant-placement turnaround); 776 units permitted in Providence County in 2024 (229 in 5+ unit buildings).
- At $6,493/mo this rent would consume 107% of the median local household income ($73k/yr) (locally 1561% of renters already pay >50% of income on rent) — very limited rent-growth headroom before tenants either downsize or default.
Forward outlook
- Local home prices are declining (-3.0%/yr); year-one equity from $4k of loan paydown is wiped out by about $16k of value loss. Plan a longer hold.
- Providence County population projected at +5% by 2050 — modest demand growth; plan on rents tracking national, not racing it.
- At projected returns (-3.0% appreciation + 5.5% rent growth), your $147k cash investment doubles in ~7 years — after that, you're playing with house money.
Negotiation context
- Only 6 days on market — expect competitive offers; lowballing is unlikely to land.
- 5 sale attempts since 27y ago with the ask held roughly flat each time — persistent listings suggest the price (not the market) is what's stuck; bring a comps-based counter.
- Current owner paid $340k; list at $524k implies a 54% gain — meaningful room to come down on a strong offer.
Risks & watch-outs
- Watch-outs: built in 1900 — expect roof / HVAC / electrical / plumbing capex.
- Climate carrying-cost: major wind risk, 70% chance of damaging wind over 30y; extreme-heat days projected 7→15/yr by 2055 (HVAC capex compounding) — expect insurance premiums to compound above CPI over the hold.
Questions for the listing agent
- Built in 1900 — when were the roof, HVAC, electrical panel, plumbing, and water heater last replaced?
- Is there a deadline driving the sale (1031 exchange, divorce, estate, relocation)? That informs how much negotiation room exists.
- Schools are F-rated, which usually means shorter tenancies and higher turnover. Who's the typical renter profile here, and what's been the actual vacancy rate?
- What's the average days-on-market for RENTAL listings here right now (not sales)? A rising rental-DOM trend means longer vacancies and softer asking-rent achievability than the comps imply.
- What's the recent tenant-quality profile in this submarket — average credit score on applications, eviction rate, late-payment / NSF rate, and stable-employment percentage? A property-management company in the area should have these aggregated.
- How much new apartment / multifamily construction is in the pipeline within 1–3 miles? Heavy new supply (>2% of stock underway) typically softens rents 12–24 months out; light construction supports rent growth.
Investment metrics
- 1% rule
- 1.24% ✓
- Cap rate
- 10.65%
- Cash-on-cash
- 15.56%
- DSCR
- 1.69
- GRM
- 6.7
CMA / ARV
No comps found within radius.
Projected returns pro-forma
-3.0% appreciation · 5.46% rent growth · sell at horizon
- IRR
- 8.9%
- Equity multiple
- 1.36×
- Total profit
- $52,613
- Equity at exit
- $78,205
- IRR
- 19.9%
- Equity multiple
- 2.86×
- Total profit
- $272,452
- Equity at exit
- $45,349
Cash invested: $146,860 (down + closing). Projections, not guarantees.
Landlord ↔ Tenant lean methodology
- Overall (STATE)
- 31 Tenant-Leaning
- State Rhode Island
- 31 Tenant-Leaning · D+8
- County
- — inherits STATE
- City
- — inherits STATE
ZIP-level market 02908
- Home prices YoY
- -27.1%
- Rents YoY
- 5.5%
- Active inventory
- 161
- Price-to-rent
- 20.2×
Monthly cashflow live
- Estimated rent
- $6,493 medium interval (Pro) →
- Mortgage (P&I)
- −$2,751
- Tax from tax record
- −$256 /mo · $3,073/yr
- Insurance
- −$219
- HOA
- −$0
- Vacancy / Maint / Mgmt
- −$1,364
- Net cashflow
- $1,904
Break-even live
3-unit breakdown (identical units grouped — click to expand)
| Units | Beds | Baths | Est. rent |
|---|---|---|---|
| 3× units | 2 | 1.5 | $6,492 |
| #1 | 2 | 1.5 | $2,164 |
| #2 | 2 | 1.5 | $2,164 |
| #3 | 2 | 1.5 | $2,164 |
| Total (3 units) | $6,493 | ||
UW: 25.0% down · 7.5% · 30yr · 1.5% tax · 5.0% vac · 8.0% maint · 8.0% mgmt
Financing live
Cash to close
- Down payment
- $131,125
- Closing costs
- $15,735
- Reserves months
- —
- Total cash needed
- —
Loan-product check · same deal, 3 products live
Conventional
25% down · 7.5% · 30yr
- Down + closing
- —
- Monthly P&I
- —
- Monthly cashflow
- —
- DSCR
- —
- Eligible?
- —
Personal DTI + credit; lowest rate.
DSCR
20% down · 8.5% · 30yr
- Down + closing
- —
- Monthly P&I
- —
- Monthly cashflow
- —
- DSCR
- —
- Eligible?
- —
No personal income docs; deal must DSCR.
Hard money
10% down · 12.0% · 12mo
- Down + closing
- —
- Monthly P&I
- —
- Monthly cashflow
- —
- DSCR
- —
- Eligible?
- —
Short-term bridge; refi at stabilization.
Rent comps 11 comps
| Address | Beds | Baths | Sqft | Rent | $/sqft | DOM | Units | Dist |
|---|---|---|---|---|---|---|---|---|
| 14 Eaton St Providence, RI | 3.0 | 1.0 | 1350 | $2,550 | $1.89 | 4d | 1 | 0.08mi |
| 38 Tyndall Ave Providence, RI | 4.0 | 2.0 | 1500 | $3,500 | $2.33 | 19d | 1 | 0.25mi |
| 711 Academy Ave Unit 2 Providence, RI | 3.0 | 1.0 | 1565 | $2,400 | $1.53 | 4d | 1 | 0.88mi |
| 729 Academy Ave Providence, RI | 3.0 | 1.0 | 1261 | $2,395 | $1.90 | 17d | 1 | 0.90mi |
| 788 Academy Ave Unit 2 Providence, RI | 3.0 | 1.0 | 1100 | $2,500 | $2.27 | 23d | 1 | 0.99mi |
| 23 Concannon St Providence, RI | 3.0 | 2.0 | 1484 | $2,700 | $1.82 | 23d | 1 | 1.01mi |
| 44 Hall St Unit 2 Providence, RI | 3.0 | 2.0 | 1200 | $2,850 | $2.38 | 23d | 1 | 1.06mi |
| 1189 Smith St Providence, RI | 3.0 | 1.5 | 1112 | $2,400 | $2.16 | 23d | 1 | 1.19mi |
| 191 Russo St Unit 1 Providence, RI | 4.0 | 2.0 | 1500 | $3,000 | $2.00 | 1d | 1 | 1.21mi |
| 270 Langdon St Unit 1 Providence, RI | 3.0 | 1.0 | 1189 | $2,300 | $1.93 | 11d | 1 | 1.36mi |
| 130 Smart St Providence, RI | 4.0 | 2.0 | 1743 | $3,500 | $2.01 | 1d | 1 | 1.42mi |
Listing history 13 events
-
2026-04-06status Pending
-
2026-03-31$524,500 Active
-
2025-08-29soldstatus $340,000
-
2025-08-28soldstatus $340,000 Closed 155-char remark
Show marketing remark (155 chars)
Attention investors/flippers: Two family house in need of rehab located near PC and everything Providence has to offer. Cash/private financing offers only.
-
2025-07-15status Pending 155-char remark
Show marketing remark (155 chars)
Attention investors/flippers: Two family house in need of rehab located near PC and everything Providence has to offer. Cash/private financing offers only.
-
2025-07-14$349,000 Active 155-char remark
Show marketing remark (155 chars)
Attention investors/flippers: Two family house in need of rehab located near PC and everything Providence has to offer. Cash/private financing offers only.
-
2025-05-05historical
-
2025-04-14$349,000 Active
-
2000-10-01historical
-
2000-06-01soldstatus $68,000
-
2000-03-21$80,000
-
1999-06-28soldstatus $42,000
-
1999-02-23$54,900
ⓘ Source: listings_history table (triggers on properties + properties_extension) + one-shot
backfill from property_details.listing_events for pre-trigger history.
Tax reassessment forecast RI · Partial reset (capped growth)
- Current annual tax
- $3,073 · $256/mo
- Projected year-2 tax
- $5,811 · $484/mo
- Expected delta
- +$2,738/yr (+$228/mo · 89.1%)
ⓘ Screening estimate from a state-policy table — verify with the county assessor before closing.
Climate risk First Street
- Flood 1/10 Low FEMA zone X (unshaded) · 0% chance over 30 yrs
- Wildfire 1/10 Low
- Heat 5/10 Major 7 d/yr ≥97°F today · 15 d/yr by 30 yrs out
- Wind 6/10 Major 70% chance of damaging wind over 30 yrs
- Air quality 2/10 Low 1 unhealthy d/yr today · 2 by 30 yrs out
Nearby sold comps map
Loading sold comps map…
Walkable amenities ~0.75 mi
Loading nearby amenities…
Taxation est. · year 1
- Rental income
- $77,916
- − Mortgage interest
- −$29,380
- − Property taxes
- −$3,073
- − Insurance
- −$2,622
- − Repairs & maintenance
- −$6,233
- − Management
- −$6,233
- − Depreciation
- −$15,258
- Taxable income
- $15,116
- Est. tax owed @ 24.0%
- −$3,628
- After-tax cash flow
- $19,224/yr
For passive investors: Depreciation is non-cash, so a rental often shows a tax loss while cash-flowing — sheltering income. Rental losses are passive: they offset passive income freely, and up to $25,000/yr can offset ordinary (W-2) income if you actively participate and your MAGI is under $100k (phasing out to $0 by $150k); unused losses carry forward. On sale, claimed depreciation is recaptured at up to 25%, and gains may owe capital-gains tax (a 1031 exchange can defer both). Figures are a year-1 estimate at your 24.0% rate — not tax advice; consult a CPA.
Schools (NCES district)
- District
- Providence
- NCES district ID
- 4400900
- Math proficiency
- 8% ▼ -4.00%
- Reading proficiency
- 16% ▼ -2.00%
- Median HH income
- $38,197
- Composite
- 10.12/100
- National rank
- #9803
- State rank
- #34 of 39 in RI
Livability — Providence
- Score
- 84/100
- State rank
- #2
- US rank
- #794
Category grades
Schools grade is shown separately in the Schools card above.
Census & demographics
- Census place
- Providence, RI
- County
- Providence County · 548,917 people
- City population
- 212,734
- Metro
- Providence-Warwick, RI-MA
- Population (ZIP)
- 39,500
- Household income
- $73,081
- Rent vs Own
- Severe rent burden
- 1561.0
Population outlook (Providence County) Hauer SSP2
- Today (2025)
- 653,469 people
- By 2030
- 660,819 · +1.1%
- By 2040
- 672,747 · +3.0%
- By 2050
- 683,741 · +4.6%
- By 2075
- 720,435 · +10.2%
- By 2100
- 741,582 · +13.5%
Race, ethnicity, and origin ACS 2023
- Neighborhood character
- Diverse neighborhood (Simpson 0.68)
- Race & ethnicity
- Hispanic / Latino 43% White 33% Two or more races 22% Black 15% Asian 4%
- Hispanic origin (detail)
- Mexican 4% Puerto Rican 5% Dominican 16%
- Common ancestry
- Swiss 4% Hispanic 3% Russian 3%
- Foreign-born
- 33% · Canada, China, South Korea
- Languages at home
- 53% English-only · Spanish 36% French/Haitian/Cajun 4% Other Indo-European 2%
Political lean MEDSL · Providence
- 2024 margin
- D (+14.4) · D 56.1% · R 41.7% · Other 2.2%
- 2008→2024 swing
- -20.0pp toward R · 2008: 34.4pp · 2024: 14.4pp
- All cycles
- 2024: D+14.4 2020: D+22.9 2016: D+21.2 2012: D+34.9 2008: D+34.4
Not yet ingested
- Civics
- —
Market trends
- HPI YoY
- ▼ -151.12%
- Current HPI
- 407.0502
- Rent YoY
- ▲ 5.46%
- Metro
- Providence-Warwick, RI-MA
- State GDP YoY
- ▲ 2.25%
- F500 in state
- 10
Industry mix (Fortune 500 HQ in RI)
| Industry | F500 HQs | Revenue |
|---|---|---|
| Healthcare | 1 | $373B |
|
||
| Food Distribution | 1 | $31B |
|
||
| Aerospace / Defense | 1 | $14B |
|
||
| Financial Services | 1 | $8B |
|
||
| Consumer Goods | 1 | $4B |
|
||
Price history
+855.4% since first listed13 events — show timeline
- 2026-04-06 Pending — RIS
- 2026-03-31 Listed $524,500 RIS
- 2025-08-29 Sold (Public Records) $340,000 Public Records
- 2025-08-28 Sold (MLS) $340,000 RIS
- 2025-07-15 Pending — RIS
- 2025-07-14 Listed $349,000 RIS
- 2025-05-05 Listing Removed — RIS
- 2025-04-14 Listed $349,000 RIS
- 2000-10-01 Listing Removed — RIS
- 2000-06-01 Sold (Public Records) $68,000 Public Records
- 2000-03-21 Listed $80,000 RIS
- 1999-06-28 Sold (Public Records) $42,000 Public Records
- 1999-02-23 Listed $54,900 RIS
Property tax history
-1.5%/yrLatest (2025): $3,073 · -34.8% YoY. Source: county tax records.
Cash-flow waterfall
monthlySold comps — $/sqft
last 12 mo · ≤1 miLoading sold comps…