933 Collier Ct Unit C401 · Marco Island, FL
Flood risk 9/10 · Severe
- FEMA flood zone
- AE
- Chance of flooding over 30 yrs
- 0.99%
- Est. flood insurance / yr
- $1,737 – $8,500
Fire risk 1/10 · Minimal
- Est. fire insurance / yr
- $947 – $1,759
Heat risk 10/10 · Severe
- Hot days now (above 107°F)
- 7 days/yr
- Hot days in 30 yrs
- 29 days/yr
Wind risk 10/10 · Severe
- Chance of severe wind over 30 yrs
- 99.0%
Air-quality risk 3/10 · Minor
- Unhealthy air days now
- 3 days/yr
- Unhealthy air days in 30 yrs
- 3 days/yr
Risk factors via First Street. Map © Google.
Why this score? — see what drove the F grade
The composite is a weighted blend of 9 inputs, each scored 0–100. Each bar is that input's sub-score; the figure is the points it added to the 100-point composite (weight × sub-score).
- ARV discount +7.5/15.0
- Cash flow +7.1/30.0
- Schools +5.0/10.0
- Rent growth +4.1/5.0
- Livability +3.6/5.0
- 1% rule +3.1/10.0
- Condition / age +2.5/5.0
- DSCR +1.3/10.0
- Appreciation +0.0/10.0
$583,999
🖨 Deal sheet 📄 Offer letter ✓ Due diligence
Listing remarks MLS
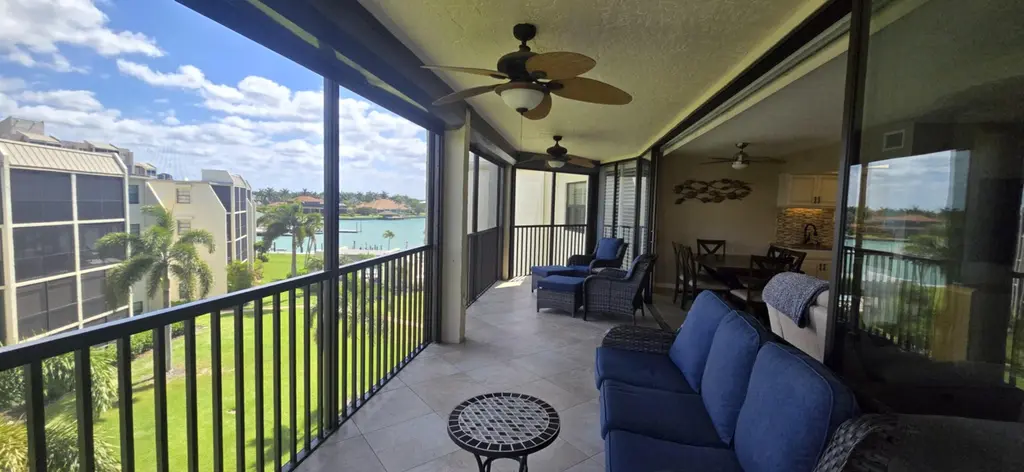
What a beauty this one is! Close to open water, free boat docks, direct access, classy remodeled kitchen in contemporary colors. This 2/2 condo has a unique sitting area and a spacious screened-in lanai.
Key facts
- Community pool
- Built 1980
- Listed 57 days
Property features AI
Finance
- Other: Pets allowed with approval
- HOA & community: Community amenities include pool, tennis courts, pickleball, barbecue area, picnic area, pier, boat launch, and elevators
Exterior
- Parking: No garage spaces
- Home design: Condo unit (4th floor unit C401); Living area approximately 1,330
- Exterior features: Pool; Tennis courts; Pickleball; Barbecue area; Picnic area; Pier; Boat launch; Elevator(s)
Interior
- Kitchen: Dishwasher; Disposal; Microwave; Range; Refrigerator with ice maker
- Bedrooms: 2 bedrooms
- Flooring: Tile
- Bathrooms: 2 full bathrooms
- Heating & cooling: Electric heating; Central heating; Central air; Ceiling fan(s)
- Interior features: Dishwasher; Disposal; Microwave; Refrigerator with ice maker; Range; Tile flooring; Ceiling fan(s); Central air
- Laundry & utility: Washer; Dryer
Neighborhood map
What this means for you Summary
Snapshot
- This is a 2-bed/2.0-bath condo listed at $584k.
Deal economics
- At list price, monthly cash flow is $-1k ($-15k/yr) — negative.
- To cash-flow at today's rent, offer at most $536k (8.2% below list).
- To meet the 1% rule (rent ≥ 1% of price), the offer needs to be $476k (18.6% below list).
- Recommended offer: $476k (18.6% below list) — sets the bar for 1% rule.
Location & tenants
- Location reads 71/100 on livability (#404 in FL) — a middle-class / working-renter tenant base. Strengths: crime A+, employment A+, health & safety A+; Watch: amenities F, commute F, cost of living F.
- Collier (suburban): math 60% / reading 56% proficiency, ranked #16 of 73 in FL (top 22%) — acceptable for families but not a draw, mixed tenant base, ~2y average lease.
- Market conditions: Rents rising fast (+6.6%/yr); 687 active listings in the ZIP; 10 comparable units currently listed for rent nearby; rentals at typical pace (median 24d on market — plan ~3-4 weeks tenant-placement turnaround); solid renter incomes; 3,520 units permitted in Collier County in 2024 (959 in 5+ unit buildings).
- At $4,756/mo this rent would consume 56% of the median local household income ($102k/yr) (locally 314% of renters already pay >50% of income on rent) — very limited rent-growth headroom before tenants either downsize or default.
Forward outlook
- Local home prices are declining (-3.0%/yr); year-one equity from $4k of loan paydown is wiped out by about $18k of value loss. Plan a longer hold.
- Collier County population projected at +30% by 2050 — long-run rental-demand tailwind backs the buy-and-hold thesis.
Negotiation context
- It's been on market 57 days — a 3% lower offer ($566k) is reasonable based on typical stale-listing flexibility.
- 5 sale attempts since 16y ago with the ask held roughly flat each time — persistent listings suggest the price (not the market) is what's stuck; bring a comps-based counter.
- Current owner paid $425k; 37% above their basis — modest negotiation headroom, anchor on the comps not their cost.
Risks & watch-outs
- Watch-outs: flood insurance adds $427/mo; HOA is 21% of rent.
- Climate carrying-cost: in FEMA flood zone AE (mandatory federal flood insurance); severe wind risk, 99% chance of damaging wind over 30y; extreme-heat days projected 7→29/yr by 2055 (HVAC capex compounding) — expect insurance premiums to compound above CPI over the hold.
Questions for the listing agent
- What do current leases actually rent for vs. the listed asking? Can we see a recent rent roll and the last 12 months of T-12 income?
- It's been on market 57 days. Have you received any prior offers? Is the seller open to a 19% concession, seller financing, or rate buy-down credit?
- What's the actual annual flood-insurance premium (NFIP or private), and is the property in a SFHA with mandatory coverage?
- What does the HOA fee cover, when was the last increase, and are there any pending special assessments or reserve-fund shortfalls?
- Any open or pending special assessments — roof, HVAC, plumbing, elevator, façade? What's the per-unit balance and payoff schedule, and is the seller paying it off at close or rolling it to the buyer?
- Is there a deadline driving the sale (1031 exchange, divorce, estate, relocation)? That informs how much negotiation room exists.
- Schools are A-rated — typically a magnet for longer-tenancy family renters. What's the average tenant stay here, and is there a school-zone premium baked into asking?
- The area grade is low — what's the realistic commute time and amenity access for the typical tenant pool here? Any planned neighborhood developments (good or bad) we should know about?
- What's the average days-on-market for RENTAL listings here right now (not sales)? A rising rental-DOM trend means longer vacancies and softer asking-rent achievability than the comps imply.
- What's the recent tenant-quality profile in this submarket — average credit score on applications, eviction rate, late-payment / NSF rate, and stable-employment percentage? A property-management company in the area should have these aggregated.
- How much new apartment / multifamily construction is in the pipeline within 1–3 miles? Heavy new supply (>2% of stock underway) typically softens rents 12–24 months out; light construction supports rent growth.
Investment metrics
- 1% rule
- 0.81% ✗
- Cap rate
- 4.59%
- Cash-on-cash
- -6.08%
- DSCR
- 0.73
- GRM
- 10.2
CMA / ARV
No comps found within radius.
Projected returns pro-forma
-3.0% appreciation · 6.59% rent growth · sell at horizon
- IRR
- -27.4%
- Equity multiple
- 0.05×
- Total profit
- $-156,076
- Equity at exit
- $87,076
- IRR
- -14.0%
- Equity multiple
- 0.04×
- Total profit
- $-157,439
- Equity at exit
- $50,494
Cash invested: $163,520 (down + closing). Projections, not guarantees.
Landlord ↔ Tenant lean methodology
- Overall (STATE)
- 87 Strongly Landlord-Friendly
- State Florida
- 87 Strongly Landlord-Friendly · R+3
- County
- — inherits STATE
- City
- — inherits STATE
ZIP-level market 34145
- Rents YoY
- 6.6%
- Active inventory
- 687
- Price-to-rent
- 10.2×
Monthly cashflow live
- Estimated rent
- $4,756 medium interval (Pro) →
- Mortgage (P&I)
- −$3,063
- Tax from tax record
- −$297 /mo · $3,560/yr
- Insurance
- −$243
- Flood insurance flood zone
- −$427 /mo · $5,118/yr
- HOA est. from 1 same-building comp
- −$983
- Vacancy / Maint / Mgmt
- −$999
- Net cashflow
- $-1,255
Break-even live
UW: 25.0% down · 7.5% · 30yr · 1.5% tax · 5.0% vac · 8.0% maint · 8.0% mgmt
Financing live
Cash to close
- Down payment
- $146,000
- Closing costs
- $17,520
- Reserves months
- —
- Total cash needed
- —
Loan-product check · same deal, 3 products live
Conventional
25% down · 7.5% · 30yr
- Down + closing
- —
- Monthly P&I
- —
- Monthly cashflow
- —
- DSCR
- —
- Eligible?
- —
Personal DTI + credit; lowest rate.
DSCR
20% down · 8.5% · 30yr
- Down + closing
- —
- Monthly P&I
- —
- Monthly cashflow
- —
- DSCR
- —
- Eligible?
- —
No personal income docs; deal must DSCR.
Hard money
10% down · 12.0% · 12mo
- Down + closing
- —
- Monthly P&I
- —
- Monthly cashflow
- —
- DSCR
- —
- Eligible?
- —
Short-term bridge; refi at stabilization.
Rent comps 10 comps
| Address | Beds | Baths | Sqft | Rent | $/sqft | DOM | Units | Dist |
|---|---|---|---|---|---|---|---|---|
| 900 Collier Ct #406 Marco Island, FL | 2.0 | 2.0 | 1158 | $8,500 | $7.34 | 23d | 1 | 0.12mi |
| 1080 S Collier Blvd #408 Marco Island, FL | 2.0 | 2.0 | 1300 | $12,200 | $9.38 | 23d | 1 | 0.21mi |
| 1100 S Collier Blvd #721 Marco Island, FL | 2.0 | 2.0 | 1296 | $7,500 | $5.79 | 23d | 1 | 0.21mi |
| 860 Panama Ct #205 Marco Island, FL | 2.0 | 2.0 | 1210 | $2,500 | $2.07 | 23d | 1 | 0.24mi |
| 900 Huron Ct Unit A1 Marco Island, FL | 2.0 | 2.0 | 1138 | $2,500 | $2.20 | 23d | 1 | 0.24mi |
| 1020 S Collier Blvd #507 Marco Island, FL | 2.0 | 2.0 | 1358 | $9,000 | $6.63 | 23d | 1 | 0.31mi |
| 690 Amber Dr Marco Island, FL | 3.0 | 2.0 | 1499 | $8,000 | $5.34 | 23d | 1 | 0.59mi |
| 520 S Collier Blvd Marco Island, FL | 2.0–3.0 | 2.5–3.0 | 1975 | $12,500 | $6.33 | 23d | 2 | 1.02mi |
| 1740 Ludlow Rd Marco Island, FL | 3.0 | 3.0 | 1804 | $4,300 | $2.38 | 23d | 1 | 1.16mi |
| 261 S Collier Blvd #309 Marco Island, FL | 2.0 | 2.0 | 1000 | $6,200 | $6.20 | 23d | 1 | 1.50mi |
HOA detail condo
- Monthly dues
- $0 · $0/yr
- Likely covers
- water
- Assessments
- None detected in remarks — confirm with the listing agent.
Listing history 28 events
-
2026-06-18days on market $583,999 Active 57 DOM
-
2026-06-17days on market $583,999 Active 56 DOM
-
2026-06-16days on market $583,999 Active 55 DOM
-
2026-06-15days on market $583,999 Active 54 DOM
-
2026-06-14days on market $583,999 Active 52 DOM
-
2026-06-10days on market $583,999 Active 49 DOM
-
2026-06-09days on market $583,999 Active 48 DOM
-
2026-06-08days on market $583,999 Active 47 DOM
-
2026-06-07days on market $583,999 Active 46 DOM
-
2026-06-03days on market $583,999 Active 42 DOM
-
2026-06-02days on market $583,999 Active 41 DOM
-
2026-06-01days on market $583,999 Active 40 DOM
-
2026-05-31days on market $583,999 Active 39 DOM
-
2026-05-30days on market $583,999 Active 38 DOM
-
2026-05-08price $583,999
-
2026-04-22$589,000 Active
-
2018-05-02soldstatus $425,000
-
2018-04-10soldstatus $425,000 Sold 203-char remark
Show marketing remark (203 chars)
What a beauty this one is! Close to open water, free boat docks, direct access, classy remodeled kitchen in contemporary colors. This 2/2 condo has a unique sitting area and a spacious screened-in lanai.
-
2018-03-20status Pending 203-char remark
Show marketing remark (203 chars)
What a beauty this one is! Close to open water, free boat docks, direct access, classy remodeled kitchen in contemporary colors. This 2/2 condo has a unique sitting area and a spacious screened-in lanai.
-
2018-02-09$439,000 Active 203-char remark
Show marketing remark (203 chars)
What a beauty this one is! Close to open water, free boat docks, direct access, classy remodeled kitchen in contemporary colors. This 2/2 condo has a unique sitting area and a spacious screened-in lanai.
-
2011-06-20soldstatus $260,000 332-char remark
Show marketing remark (332 chars)
Spacious top floor, corner, two bedroom, two bath condo on south end of Marco Island. Direct access docks available, gorgeous views, and a short distance to the beach entrance. Unit comes furnished, has expansive lanai with electric hurricane shutters. Furnished nicely and ready for you to enjoy the best of the Florida life style.
-
2011-06-20soldstatus $260,000
Show marketing remark (332 chars)
Spacious top floor, corner, two bedroom, two bath condo on south end of Marco Island. Direct access docks available, gorgeous views, and a short distance to the beach entrance. Unit comes furnished, has expansive lanai with electric hurricane shutters. Furnished nicely and ready for you to enjoy the best of the Florida life style.
-
2011-03-22$275,000 332-char remark
Show marketing remark (332 chars)
Spacious top floor, corner, two bedroom, two bath condo on south end of Marco Island. Direct access docks available, gorgeous views, and a short distance to the beach entrance. Unit comes furnished, has expansive lanai with electric hurricane shutters. Furnished nicely and ready for you to enjoy the best of the Florida life style.
-
2010-09-20$369,000
-
2010-02-19$395,000
-
2003-12-11soldstatus $381,900
-
1986-06-01soldstatus $111,000
-
1982-01-01soldstatus $105,000
ⓘ Source: listings_history table (triggers on properties + properties_extension) + one-shot
backfill from property_details.listing_events for pre-trigger history.
Tax reassessment forecast FL · Resets to sale price
- Current annual tax
- $3,560 · $297/mo
- Projected year-2 tax
- $4,847 · $404/mo
- Expected delta
- +$1,288/yr (+$107/mo · 36.2%)
ⓘ Screening estimate from a state-policy table — verify with the county assessor before closing.
Climate risk First Street
- Flood 9/10 Extreme FEMA zone AE · 99% chance over 30 yrs
- Wildfire 1/10 Low
- Heat 10/10 Extreme 7 d/yr ≥107°F today · 29 d/yr by 30 yrs out
- Wind 10/10 Extreme 99% chance of damaging wind over 30 yrs
- Air quality 3/10 Moderate 3 unhealthy d/yr today · 3 by 30 yrs out
Nearby sold comps map
Loading sold comps map…
Walkable amenities ~0.75 mi
Loading nearby amenities…
Taxation est. · year 1
- Rental income
- $57,074
- − Mortgage interest
- −$32,713
- − Property taxes
- −$3,560
- − Insurance
- −$8,038
- − Repairs & maintenance
- −$4,566
- − Management
- −$4,566
- − HOA
- −$11,796
- − Depreciation
- −$16,989
- Taxable loss
- −$25,154
- Est. tax savings @ 24.0%
- +$6,037
- After-tax cash flow
- $-9,019/yr
For passive investors: Depreciation is non-cash, so a rental often shows a tax loss while cash-flowing — sheltering income. Rental losses are passive: they offset passive income freely, and up to $25,000/yr can offset ordinary (W-2) income if you actively participate and your MAGI is under $100k (phasing out to $0 by $150k); unused losses carry forward. On sale, claimed depreciation is recaptured at up to 25%, and gains may owe capital-gains tax (a 1031 exchange can defer both). Figures are a year-1 estimate at your 24.0% rate — not tax advice; consult a CPA.
Schools (NCES district)
- District
- Collier
- NCES district ID
- 1200330
- Math proficiency
- 60% ▼ -4.00%
- Reading proficiency
- 56% ▼ -2.00%
- Median HH income
- $58,275
- Composite
- 50.23/100
- National rank
- #1892
- State rank
- #16 of 73 in FL
Livability — Marco Island
- Score
- 71/100
- State rank
- #404
- US rank
- #7149
Category grades
Schools grade is shown separately in the Schools card above.
Census & demographics
- Census place
- Marco Island, FL
- County
- Collier County · 396,295 people
- City population
- 16,205
- Metro
- Naples-Marco Island, FL
- Population (ZIP)
- 16,205
- Household income
- $101,523
- Rent vs Own
- Severe rent burden
- 314.0
Population outlook (Collier County) Hauer SSP2
- Today (2025)
- 420,858 people
- By 2030
- 450,054 · +6.9%
- By 2040
- 502,232 · +19.3%
- By 2050
- 544,932 · +29.5%
- By 2075
- 627,203 · +49.0%
- By 2100
- 659,015 · +56.6%
Race, ethnicity, and origin ACS 2023
- Neighborhood character
- Predominantly White (90%)
- Race & ethnicity
- White 90% Hispanic / Latino 7% Two or more races 6%
- Hispanic origin (detail)
- Mexican 1% Puerto Rican 1% Cuban 2%
- Common ancestry
- Romanian 5% Lithuanian 2% Slovak 2%
- Foreign-born
- 9% · Canada
- Languages at home
- 90% English-only · Spanish 5% Other Indo-European 1% German/W. Germanic 1%
Political lean MEDSL · Collier
- 2024 margin
- Solid R (+33.1) · D 33.1% · R 66.2%
- 2008→2024 swing
- -10.6pp toward R · 2008: -22.5pp · 2024: -33.1pp
- All cycles
- 2024: R+33.1 2020: R+24.7 2016: R+26.0 2012: R+30.1 2008: R+22.5
Not yet ingested
- Civics
- —
Market trends
- HPI YoY
- ▼ -374.55%
- Current HPI
- 284.7538
- Rent YoY
- ▲ 6.59%
- Metro
- Naples-Marco Island, FL
- State GDP YoY
- ▲ 3.28%
- F500 in state
- 36
Industry mix (Fortune 500 HQ in FL)
| Industry | F500 HQs | Revenue |
|---|---|---|
| Industrial Technology | 2 | $29B |
|
||
| Insurance | 2 | $17B |
|
||
| Retail | 1 | $60B |
|
||
| Technology Distribution | 1 | $58B |
|
||
| Homebuilding | 1 | $35B |
|
||
| Technology Manufacturing | 1 | $35B |
|
||
Price history
+456.2% since first listed14 events — show timeline
- 2026-05-08 Price Changed $583,999 MIML
- 2026-04-22 Listed $589,000 MIML
- 2018-05-02 Sold (Public Records) $425,000 Public Records
- 2018-04-10 Sold (MLS) $425,000 NAPLESMLS
- 2018-03-20 Pending — NAPLESMLS
- 2018-02-09 Listed $439,000 NAPLESMLS
- 2011-06-20 Sold (Public Records) $260,000 Public Records
- 2011-06-20 Sold (MLS) $260,000 NAPLESMLS
- 2011-03-22 Listed $275,000 NAPLESMLS
- 2010-09-20 Listed $369,000 NAPLESMLS
- 2010-02-19 Listed $395,000 NAPLESMLS
- 2003-12-11 Sold (Public Records) $381,900 Public Records
- 1986-06-01 Sold (Public Records) $111,000 Public Records
- 1982-01-01 Sold (Public Records) $105,000 Public Records
Property tax history
+3.9%/yrLatest (2025): $3,560 · +2.6% YoY. Source: county tax records.
Cash-flow waterfall
monthlySold comps — $/sqft
last 12 mo · ≤1 miLoading sold comps…