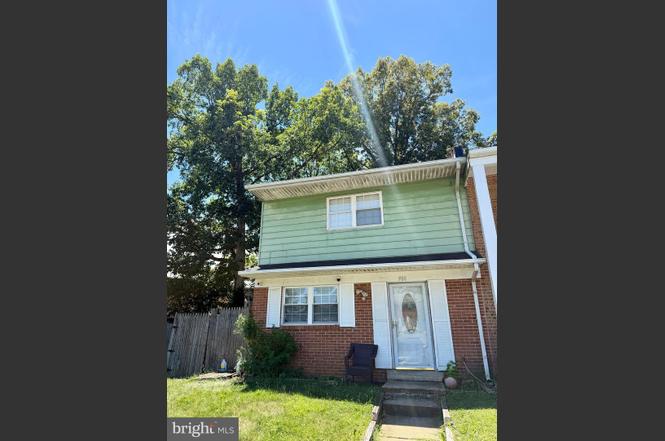
900 Anvil Rd · Southern Gateway, VA
Flood risk 1/10 · Minimal
- FEMA flood zone
- X (unshaded)
- Chance of flooding over 30 yrs
- 0.0%
- Est. flood insurance / yr
- $507 – $1,088
Fire risk 3/10 · Minor
- Est. fire insurance / yr
- $666 – $1,236
Heat risk 7/10 · Major
- Hot days now (above 107°F)
- 7 days/yr
- Hot days in 30 yrs
- 16 days/yr
Wind risk 4/10 · Minor
- Chance of severe wind over 30 yrs
- 16.0%
Air-quality risk 2/10 · Minimal
- Unhealthy air days now
- 0 days/yr
- Unhealthy air days in 30 yrs
- 1 days/yr
Risk factors via First Street. Map © Google.
Why this score? — see what drove the D grade
The composite is a weighted blend of 9 inputs, each scored 0–100. Each bar is that input's sub-score; the figure is the points it added to the 100-point composite (weight × sub-score).
- Cash flow +12.8/30.0
- ARV discount +9.0/15.0
- Schools +5.5/10.0
- DSCR +3.8/10.0
- Livability +3.8/5.0
- Rent growth +3.4/5.0
- 1% rule +3.2/10.0
- Condition / age +2.5/5.0
- Appreciation +0.0/10.0
$270,000
🖨 Deal sheet 📄 Offer letter ✓ Due diligence
Listing remarks MLS
NEWER HEAT PUMP * * NEWER KITCHEN CABINETS AND COUNTER TOPS * * TILE KITCHEN FLOORS * * W/ W CARPETING * * 3 BEDROOMS 1.5 BATHS * * FENCED REAR YARD
Key facts
- End-unit townhouse
- $52 HOA
- 2 parking spots
Tags
Property features AI
Finance
- HOA & community: HOA fee $60 monthly; HOA covers common area maintenance and trash
Exterior
- Parking: Assigned parking in lot (2 assigned spaces, numbers include 900); Total of 2 parking spaces in parking lot
- Utilities: Public water; Public sewer; Electric service for heating, cooling, and hot water
- Home design: End-of-row townhouse; Located outside city limits; Building name: OLDE FORGE; Ownership: Fee simple
- Construction: Brick front; Slab foundation; Year built per assessor
- Exterior features: Rear yard and side yard(s); Fully wood fenced yard; Shed on property; Above-grade and below-grade structures listed
Interior
- Bedrooms: Three bedrooms on the upper level
- Bathrooms: One full bath on the upper level; One half bath on the main level
- Heating & cooling: Central heating (electric); Central air conditioning (electric); Electric hot water
- Interior features: No basement; Living area per assessor
- Laundry & utility: Washer and dryer in unit; Laundry available on main and lower floors
Neighborhood map
What this means for you Summary
Snapshot
- This is a 3-bed/1.5-bath townhouse listed at $270k.
Deal economics
- At list price, monthly cash flow is $-27 ($-319/yr) — negative.
- To cash-flow at today's rent, offer at most $265k (1.7% below list).
- To meet the 1% rule (rent ≥ 1% of price), the offer needs to be $221k (18.0% below list).
- Recommended offer: $221k (18.0% below list) — sets the bar for 1% rule.
- Cap rate 6.2% vs local median 2.4% in Southern Gateway — top-decile yield for the area; either an underpriced asset or a hidden risk that comps aren't pricing in. Stress-test before assuming the spread holds.
Location & tenants
- Location reads 75/100 on livability (#136 in VA, #4,350 nationally) — a middle-class / working-renter tenant base. Strengths: crime A+, health & safety A+, housing A-; Watch: amenities F, commute F, cost of living F.
- Stafford County Public School District (suburban): math 50% / reading 68% proficiency, ranked #42 of 131 in VA (top 32%) — acceptable for families but not a draw, mixed tenant base, ~2y average lease.
- Zoned schools: Rocky Run Elementary (math 57% / reading 62%, grade B-, #536 of 1,108 statewide, top 51%, 850 students, 77% FRL); Andrew G. Wright Middle (math 43% / reading 71%, grade B, #178 of 342 statewide, top 53%, 868 students, 35% FRL); North Stafford High (math 64% / reading 82%, grade B+, #129 of 319 statewide, top 41%, 1,925 students, 44% FRL) — zoned schools average 52% FRL vs 22% district-wide (31 pts higher); higher-poverty schools than district average — tighter screening recommended.
- Market conditions: Rents rising (+3.5%/yr); 174 active listings in the ZIP; 8 comparable units currently listed for rent nearby; rentals leasing fast (median 2d on market — plan ~1-2 weeks tenant-placement turnaround); high-income renter base; 361 units permitted in Stafford County in 2024 (0 in 5+ unit buildings).
Forward outlook
- Local home prices are declining (-3.0%/yr); year-one equity from $2k of loan paydown is wiped out by about $8k of value loss. Plan a longer hold.
- Stafford County population projected at +39% by 2050 — long-run rental-demand tailwind backs the buy-and-hold thesis.
Negotiation context
- Only 1 days on market — expect competitive offers; lowballing is unlikely to land.
- 7 sale attempts since 23y ago; this cycle's ask is 200% above the opening price — seller raised mid-cycle; expect resistance to lowballs.
- Current owner paid $80k; list at $270k implies a 238% gain — meaningful room to come down on a strong offer.
Risks & watch-outs
- Climate carrying-cost: extreme-heat days projected 7→16/yr by 2055 (HVAC capex compounding) — expect insurance premiums to compound above CPI over the hold.
Questions for the listing agent
- What do current leases actually rent for vs. the listed asking? Can we see a recent rent roll and the last 12 months of T-12 income?
- Built in 1972 — when were the roof, HVAC, electrical panel, plumbing, and water heater last replaced?
- What does the HOA fee cover, when was the last increase, and are there any pending special assessments or reserve-fund shortfalls?
- Is there a deadline driving the sale (1031 exchange, divorce, estate, relocation)? That informs how much negotiation room exists.
- Schools are A-rated — typically a magnet for longer-tenancy family renters. What's the average tenant stay here, and is there a school-zone premium baked into asking?
- The area grade is low — what's the realistic commute time and amenity access for the typical tenant pool here? Any planned neighborhood developments (good or bad) we should know about?
- What's the average days-on-market for RENTAL listings here right now (not sales)? A rising rental-DOM trend means longer vacancies and softer asking-rent achievability than the comps imply.
- What's the recent tenant-quality profile in this submarket — average credit score on applications, eviction rate, late-payment / NSF rate, and stable-employment percentage? A property-management company in the area should have these aggregated.
- How much new for-sale + rental construction is in the pipeline within 1–3 miles? Heavy new supply typically softens prices + rents 12–24 months out; constrained supply supports both.
Investment metrics
- 1% rule
- 0.82% ✗
- Cap rate
- 6.17%
- Cash-on-cash
- -0.42%
- DSCR
- 0.98
- GRM
- 10.2
CMA / ARV
- ARV (on-the-fly)
- $279,600
- Comps found
- 12
Show comp detail 12 sales within ~0.75 mi
| Address | Dist | Beds/Ba | Sqft | Sold | Price | $/sf | Match |
|---|---|---|---|---|---|---|---|
| 902 Anvil Rd | 0.00mi | 3/1.5 | 1,200 (0%) | 6mo | $285,000 | $238 | 95 |
| 910 Anvil Rd | 0.02mi | 3/2.5 | 1,200 (0%) | 1mo | $230,000 | $192 | 94 |
| 903 Bellows Ave | 0.10mi | 3/1.5 | 1,200 (0%) | 11mo | $279,500 | $233 | 86 |
| 931 Anvil Rd | 0.08mi | 3/1.5 | 1,200 (0%) | 13mo | $270,000 | $225 | 85 |
| 926 Anvil Rd | 0.05mi | 3/1.5 | 1,200 (0%) | 15mo | $275,000 | $229 | 85 |
| 817 Anvil Rd | 0.06mi | 3/1.5 | 1,160 (-3%) | 16mo | $268,000 | $231 | 78 |
| 107 Bancroft Dr #96 | 0.13mi | 3/2.5 | 1,280 (+7%) | 11mo | $399,900 | $312 | 70 |
| 623 Olde Forge Dr | 0.20mi | 3/2.0 | 1,364 (+14%) | 6mo | $301,000 | $221 | 61 |
| 517 View Point Way | 0.53mi | 3/3.0 | 1,280 (+7%) | 1mo | $395,000 | $309 | 57 |
| 826 Sledgehammer Dr | 0.10mi | 3/2.5 | 1,356 (+13%) | 15mo | $302,000 | $223 | 57 |
| 515 Rolling Valley Dr | 0.44mi | 3/3.5 | 1,152 (-4%) | 10mo | $392,000 | $340 | 56 |
| 522 River Crest Way | 0.48mi | 3/3.0 | 1,280 (+7%) | 10mo | $425,000 | $332 | 52 |
Match score weights: distance 35% · size 25% · config 20% · recency 20%. Top-matched comps best support the ARV.
Projected returns pro-forma
-3.0% appreciation · 3.48% rent growth · sell at horizon
- IRR
- -16.5%
- Equity multiple
- 0.41×
- Total profit
- $-44,395
- Equity at exit
- $40,258
- IRR
- -7.5%
- Equity multiple
- 0.52×
- Total profit
- $-36,482
- Equity at exit
- $23,345
Cash invested: $75,600 (down + closing). Projections, not guarantees.
Landlord ↔ Tenant lean methodology
- Overall (STATE)
- 55 Moderately Landlord-Leaning
- State Virginia
- 55 Moderately Landlord-Leaning · D+2
- County
- — inherits STATE
- City
- — inherits STATE
ZIP-level market 22405
- Rents YoY
- 3.5%
- Active inventory
- 174
- Price-to-rent
- 10.2×
Monthly cashflow live
- Estimated rent
- $2,213 high interval (Pro) →
- Mortgage (P&I)
- −$1,416
- Tax from tax record
- −$194 /mo · $2,332/yr
- Insurance
- −$112
- HOA
- −$52
- Vacancy / Maint / Mgmt
- −$465
- Net cashflow
- $-27
Break-even live
UW: 25.0% down · 7.5% · 30yr · 1.5% tax · 5.0% vac · 8.0% maint · 8.0% mgmt
Financing live
Cash to close
- Down payment
- $67,500
- Closing costs
- $8,100
- Reserves months
- —
- Total cash needed
- —
Loan-product check · same deal, 3 products live
Conventional
25% down · 7.5% · 30yr
- Down + closing
- —
- Monthly P&I
- —
- Monthly cashflow
- —
- DSCR
- —
- Eligible?
- —
Personal DTI + credit; lowest rate.
DSCR
20% down · 8.5% · 30yr
- Down + closing
- —
- Monthly P&I
- —
- Monthly cashflow
- —
- DSCR
- —
- Eligible?
- —
No personal income docs; deal must DSCR.
Hard money
10% down · 12.0% · 12mo
- Down + closing
- —
- Monthly P&I
- —
- Monthly cashflow
- —
- DSCR
- —
- Eligible?
- —
Short-term bridge; refi at stabilization.
Rent comps 8 comps
| Address | Beds | Baths | Sqft | Rent | $/sqft | DOM | Units | Dist |
|---|---|---|---|---|---|---|---|---|
| 908 Anvil Rd Fredericksburg, VA | 3.0 | 1.5 | 1200 | $1,550 | $1.29 | 5d | 1 | 0.01mi |
| 929 Anvil Rd Fredericksburg, VA | 3.0 | 1.5 | 1200 | $1,900 | $1.58 | 43d | 1 | 0.06mi |
| 123 Streamview Dr Fredericksburg, VA | 3.0 | 3.0 | 1280 | $2,300 | $1.80 | 43d | 1 | 0.21mi |
| 57 Denison St Fredericksburg, VA | 2.0 | 2.0 | 1476 | $3,500 | $2.37 | 2d | 1 | 1.26mi |
| 319 Brock Sq Fredericksburg, VA | 2.0 | 2.0 | 950 | $1,749 | $1.84 | 2d | 1 | 1.31mi |
| 1300 Forest Vlg Fredericksburg, VA | 1.0–3.0 | 1.0 | 916 | $1,450 | $1.58 | 1d | 1 | 1.32mi |
| 330 Brock Sq Fredericksburg, VA | 3.0 | 1.5 | 1141 | $2,050 | $1.80 | 1d | 1 | 1.34mi |
| 3107 Linden Ave Fredericksburg, VA | 4.0 | 1.0 | 1152 | $2,400 | $2.08 | 1d | 1 | 1.44mi |
HOA detail
- Monthly dues
- $52 · $624/yr
Listing history 3 events
-
2026-06-18status $270,000 Active 1 DOM
-
2026-06-17remarks 630-char remark
-
2026-06-17$270,000 Coming Soon 1 DOM
ⓘ Source: listings_history table (triggers on properties + properties_extension) + one-shot
backfill from property_details.listing_events for pre-trigger history.
Tax reassessment forecast VA · Resets to sale price
- Current annual tax
- $2,332 · $194/mo
- Projected year-2 tax
- $2,332 · $194/mo
- Expected delta
- $0/yr ($0/mo · 0.0%)
ⓘ Screening estimate from a state-policy table — verify with the county assessor before closing.
Climate risk First Street
- Flood 1/10 Low FEMA zone X (unshaded) · 0% chance over 30 yrs
- Wildfire 3/10 Moderate
- Heat 7/10 Severe 7 d/yr ≥107°F today · 16 d/yr by 30 yrs out
- Wind 4/10 Moderate 16% chance of damaging wind over 30 yrs
- Air quality 2/10 Low 0 unhealthy d/yr today · 1 by 30 yrs out
Nearby sold comps map
Loading sold comps map…
Walkable amenities ~0.75 mi
Loading nearby amenities…
Taxation est. · year 1
- Rental income
- $26,554
- − Mortgage interest
- −$15,124
- − Property taxes
- −$2,332
- − Insurance
- −$1,350
- − Repairs & maintenance
- −$2,124
- − Management
- −$2,124
- − HOA
- −$624
- − Depreciation
- −$7,855
- Taxable loss
- −$4,979
- Est. tax savings @ 24.0%
- +$1,195
- After-tax cash flow
- $876/yr
For passive investors: Depreciation is non-cash, so a rental often shows a tax loss while cash-flowing — sheltering income. Rental losses are passive: they offset passive income freely, and up to $25,000/yr can offset ordinary (W-2) income if you actively participate and your MAGI is under $100k (phasing out to $0 by $150k); unused losses carry forward. On sale, claimed depreciation is recaptured at up to 25%, and gains may owe capital-gains tax (a 1031 exchange can defer both). Figures are a year-1 estimate at your 24.0% rate — not tax advice; consult a CPA.
Schools (NCES district)
- District
- Stafford County Public School District
- NCES district ID
- 5103660
- Math proficiency
- 50% ▼ -34.00%
- Reading proficiency
- 68% ▼ -11.00%
- Median HH income
- $96,389
- Composite
- 54.61/100
- National rank
- #1336
- State rank
- #42 of 131 in VA
Livability — Southern Gateway
- Score
- 75/100
- State rank
- #136
- US rank
- #4350
Category grades
Schools grade is shown separately in the Schools card above.
Census & demographics
- County
- Stafford County · 161,536 people
- Metro
- Washington-Arlington-Alexandria, DC-VA-MD-WV
- Population (ZIP)
- 36,890
- Household income
- $128,259
- Rent vs Own
- Severe rent burden
- 257.0
Population outlook (Stafford County) Hauer SSP2
- Today (2025)
- 169,882 people
- By 2030
- 183,934 · +8.3%
- By 2040
- 211,031 · +24.2%
- By 2050
- 235,391 · +38.6%
- By 2075
- 297,080 · +74.9%
- By 2100
- 334,680 · +97.0%
Race, ethnicity, and origin ACS 2023
- Neighborhood character
- Diverse neighborhood (Simpson 0.56)
- Race & ethnicity
- White 64% Black 14% Two or more races 12% Hispanic / Latino 10% Asian 2%
- Hispanic origin (detail)
- Mexican 2%
- Common ancestry
- Italian 3% Romanian 2% Lithuanian 2%
- Foreign-born
- 10% · Canada, Dominican Republic, South Korea
- Languages at home
- 89% English-only · Spanish 8% Other Indo-European 1% Arabic 1%
Political lean MEDSL · Stafford
- 2024 margin
- Toss-up / Even · D 49.6% · R 48.8% · Other 1.5%
- 2008→2024 swing
- +7.1pp toward D · 2008: -6.3pp · 2024: 0.8pp
- All cycles
- 2024: D+0.8 2020: D+3.3 2016: R+9.1 2012: R+8.8 2008: R+6.3
Not yet ingested
- Civics
- —
Market trends
- HPI YoY
- ▼ -207.28%
- Current HPI
- 287.0876
- Rent YoY
- ▲ 3.48%
- Metro
- Washington-Arlington-Alexandria, DC-VA-MD-WV
- State GDP YoY
- ▲ 2.40%
- F500 in state
- 50
Industry mix (Fortune 500 HQ in VA)
| Industry | F500 HQs | Revenue |
|---|---|---|
| Aerospace / Defense | 4 | $236B |
|
||
| Technology / Defense | 3 | $32B |
|
||
| Financial Services | 2 | $176B |
|
||
| Utilities | 2 | $27B |
|
||
| Insurance | 2 | $25B |
|
||
| Technology | 2 | $15B |
|
||
Price history
+583.5% since first listed27 events — show timeline
- 2026-06-16 Coming Soon $270,000 BRIGHT MLS
- 2013-11-18 Sold (MLS) $80,000 BRIGHT MLS
- 2013-11-18 Sold (MLS) $80,000 MRIS
- 2013-10-16 Pending — MRIS
- 2013-10-16 Listing Removed — BRIGHT MLS
- 2013-10-08 Listed $90,000 MRIS
- 2013-10-08 Listed $90,000 BRIGHT MLS
- 2010-02-26 Sold (MLS) $53,000 MRIS
- 2010-02-26 Sold (MLS) $53,000 BRIGHT MLS
- 2009-11-10 Pending — MRIS
- 2009-11-09 Listing Removed — BRIGHT MLS
- 2009-11-07 Price Changed $55,000 MRIS
- 2009-10-23 Relisted — MRIS
- 2009-10-23 Price Changed $70,000 MRIS
- 2009-10-06 Contingent — MRIS
- 2009-09-23 Listed $60,000 MRIS
- 2009-09-22 Listed $55,000 BRIGHT MLS
- 2006-01-04 Sold (Public Records) $182,000 Public Records
- 2005-12-30 Sold (MLS) $182,000 MRIS
- 2005-11-01 Delisted — MRIS
- 2005-09-07 Listed $187,000 MRIS
- 2003-07-29 Sold (Public Records) $63,000 Public Records
- 2003-07-24 Sold (MLS) $63,000 MRIS
- 2003-07-23 Listed $63,000 MRIS
- 2003-07-23 Delisted — MRIS
- 1998-02-02 Sold (Public Records) $44,000 Public Records
- 1995-11-03 Sold (Public Records) $39,500 Public Records
Property tax history
+4.1%/yrLatest (2026): $2,332 · +33.2% YoY. Source: county tax records.
Cash-flow waterfall
monthlySold comps — $/sqft
last 12 mo · ≤1 miLoading sold comps…