 🏷️ Likely Rental
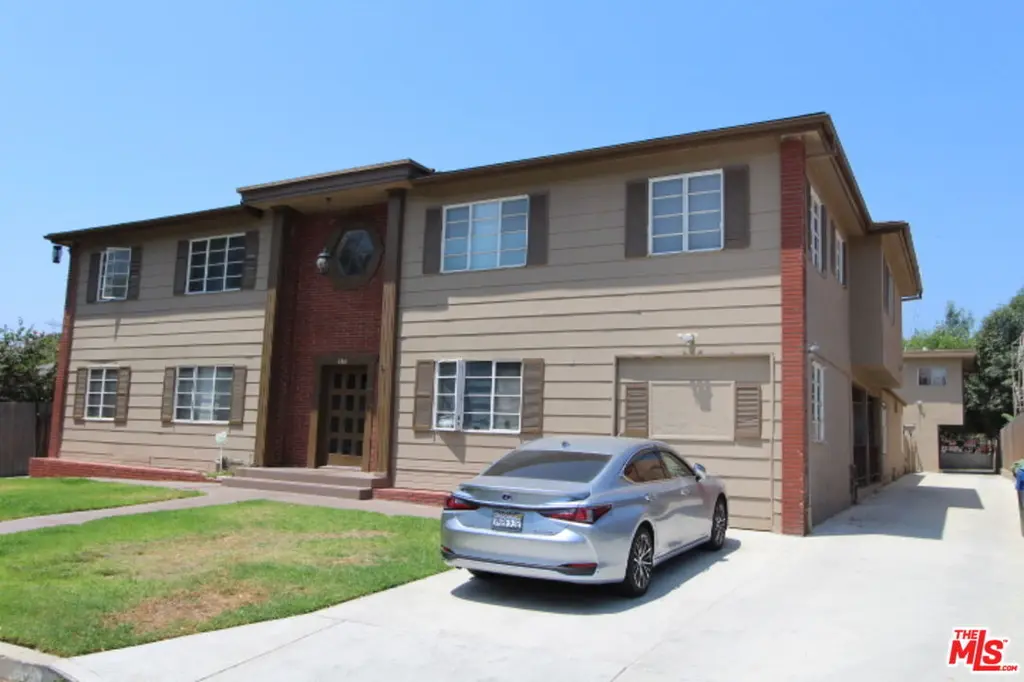
4316 Edenhurst Ave · Los Angeles, CA
Flood risk 1/10 · Minimal
- FEMA flood zone
- X (unshaded)
- Chance of flooding over 30 yrs
- 0.0%
- Est. flood insurance / yr
- $507 – $1,088
Fire risk 5/10 · Moderate
- Est. fire insurance / yr
- $659 – $1,223
Heat risk 6/10 · Moderate
- Hot days now (above 94°F)
- 7 days/yr
- Hot days in 30 yrs
- 23 days/yr
Wind risk 1/10 · Minimal
- Chance of severe wind over 30 yrs
- —
Air-quality risk 5/10 · Moderate
- Unhealthy air days now
- 8 days/yr
- Unhealthy air days in 30 yrs
- 8 days/yr
Risk factors via First Street. Map © Google.
Why this score? — see what drove the D grade
The composite is a weighted blend of 9 inputs, each scored 0–100. Each bar is that input's sub-score; the figure is the points it added to the 100-point composite (weight × sub-score).
- ARV discount +15.0/15.0
- Cash flow +9.8/30.0
- Schools +3.6/10.0
- Livability +3.4/5.0
- DSCR +2.8/10.0
- Rent growth +2.8/5.0
- Condition / age +2.5/5.0
- 1% rule +1.8/10.0
- Appreciation +0.0/10.0
$2,495,000
🖨 Deal sheet 📄 Offer letter ✓ Due diligence
Multi-family units
County records classify this as Multi-Family (5+ Unit). Listing-text estimate: 8 units. confirmed
5+ unit building — per-unit beds/baths from public records are typically unavailable; the breakdown below (if shown) is an estimate from the listing text.
Listing remarks MLS
4316 Edenhurst Avenue presents a well-maintained and recently improved multifamily investment opportunity in a strong rental pocket of Los Angeles, near the border of Glendale. Offering an attractive and diverse unit mix, completed seismic retrofit upgrades, and proximity to major retail and transit corridors, the property is well positioned for both stable cash flow and long-term appreciation. The building features a desirable 8-unit configuration consisting of 4 one-bedroom/one-bath units, 3 two-bedroom/one-bath units, and 1 spacious four-bedroom/three-bath unit. This blend of unit sizes appeals to a wide tenant base, from individuals and couples to larger households seeking additional space helping support strong occupancy in this high-demand rental location. Individually metered gas and electric service enhances operational efficiency and reduces owner utility exposure. Recent capital improvements further strengthen the asset. Seismic retrofitting was completed in March 2025, providing compliance and added structural security. The property also features new exterior paint and a recently repaved driveway, improving curb appeal and overall functionality. A central water heater system supports building efficiency, while on-site laundry facilities and on-site parking add convenience and tenant appeal key amenities in this competitive rental market. Location is a major highlight. The property offers quick access to the Interstate 5 and California State Route 134, allowing convenient connectivity to surrounding employment hubs and lifestyle destinations. It is a short distance from the Glendale Transportation Center, enhancing public transit accessibility. Tenants also benefit from proximity to major shopping and entertainment at the Glendale Galleria, as well as national retailers including Costco and The Home Depot. With its strong Los Angeles location, completed 2025 seismic retrofit, recent exterior upgrades, and well-balanced unit mix including a large four-bedroom unit 4316 Edenhurst Avenue represents a compelling multifamily opportunity combining stability, improved infrastructure, and long-term upside in a proven rental corridor. This information has been secured from sources we believe to be reliable, but we make no representations or warranties, expressed or implied as to the accuracy of the information. References to square footage or age are approximate. Buyer must verify the information and bears all risk for any inaccuracies.
Key facts
- New exterior paint
- On-site parking
- 0.28 acre lot
Tags
Neighborhood map
What this means for you Summary
Snapshot
- This is a 4×1bd/1ba + 3×2bd/1ba + 1×4bd/3ba units multifamily listed at $2.50M.
Deal economics
- At list price, monthly cash flow is $-2k ($-19k/yr) — negative. Per door: $-202/mo.
- To cash-flow at today's rent, offer at most $2.21M (11.4% below list).
- To meet the 1% rule (rent ≥ 1% of price), the offer needs to be $1.70M (31.9% below list).
- Recommended offer: $1.70M (31.9% below list) — sets the bar for 1% rule.
- Cap rate 5.5% vs local median 2.1% in Los Angeles — top-decile yield for the area; either an underpriced asset or a hidden risk that comps aren't pricing in. Stress-test before assuming the spread holds.
Location & tenants
- Location reads 68/100 on livability (#273 in CA) — a middle-class / working-renter tenant base. Strengths: amenities A+, commute A+, employment B; Watch: health & safety C-, schools D+, crime F.
- Los Angeles Unified (urban): math 29% / reading 54% proficiency, ranked #223 of 517 in CA (top 43%) — families likely to look elsewhere, expect single-tenant / working-renter base with shorter leases; 67% free/reduced lunch — lower-income household profile, screen leases tightly.
- Market conditions: Rents rising (+1.0%/yr); 102 active listings in the ZIP; 9 comparable units currently listed for rent nearby; rentals lingering (median 44d on market — plan ~5-8 weeks vacancy on turnover, expect pricing pressure); 78% of comp listings sitting > 30 days — soft ceiling on asking rent; high-income renter base; 19,697 units permitted in Los Angeles County in 2024 (9,426 in 5+ unit buildings).
- At $16,994/mo this rent would consume 179% of the median local household income ($114k/yr) (locally 1726% of renters already pay >50% of income on rent) — very limited rent-growth headroom before tenants either downsize or default.
Forward outlook
- Local home prices are declining (-3.0%/yr); year-one equity from $17k of loan paydown is wiped out by about $75k of value loss. Plan a longer hold.
- Los Angeles County population projected at +9% by 2050 — modest demand growth; plan on rents tracking national, not racing it.
Negotiation context
- It's been on market 106 days — a 9% lower offer ($2.27M) is reasonable based on typical stale-listing flexibility.
- 12 sale attempts since 27y ago; this cycle's ask has dropped $355k (12%) from the opening price — seller is motivated, your offer sets the floor, not the list.
- Current owner paid $492k; list at $2.50M implies a 407% gain — meaningful room to come down on a strong offer.
Risks & watch-outs
- Watch-outs: built in 1941 — expect roof / HVAC / electrical / plumbing capex.
- Climate carrying-cost: moderate wildfire risk; extreme-heat days projected 7→23/yr by 2055 (HVAC capex compounding) — expect insurance premiums to compound above CPI over the hold.
Questions for the listing agent
- What do current leases actually rent for vs. the listed asking? Can we see a recent rent roll and the last 12 months of T-12 income?
- It's been on market 106 days. Have you received any prior offers? Is the seller open to a 32% concession, seller financing, or rate buy-down credit?
- Can we see the unit-by-unit rent roll, current vacancy, and any below-market leases? What's the average tenancy length?
- What capital expenditures (roof, boiler, parking lot, exteriors) have been made in the last 5 years, and what's planned in the next 2?
- Built in 1941 — when were the roof, HVAC, electrical panel, plumbing, and water heater last replaced?
- Why hasn't it sold? Are there any deal-killer items the seller is aware of (foundation, flood, title, zoning, code violations)?
- Is there a deadline driving the sale (1031 exchange, divorce, estate, relocation)? That informs how much negotiation room exists.
- Schools are D-rated, which usually means shorter tenancies and higher turnover. Who's the typical renter profile here, and what's been the actual vacancy rate?
- Crime grade is F in this area — have there been break-ins, vandalism, or insurance claims at this property in the last 3 years? What carrier currently insures it and at what premium?
- The area grade is low — what's the realistic commute time and amenity access for the typical tenant pool here? Any planned neighborhood developments (good or bad) we should know about?
- What's the average days-on-market for RENTAL listings here right now (not sales)? A rising rental-DOM trend means longer vacancies and softer asking-rent achievability than the comps imply.
- What's the recent tenant-quality profile in this submarket — average credit score on applications, eviction rate, late-payment / NSF rate, and stable-employment percentage? A property-management company in the area should have these aggregated.
- How much new apartment / multifamily construction is in the pipeline within 1–3 miles? Heavy new supply (>2% of stock underway) typically softens rents 12–24 months out; light construction supports rent growth.
Investment metrics
- 1% rule
- 0.68% ✗
- Cap rate
- 5.52%
- Cash-on-cash
- -2.77%
- DSCR
- 0.88
- GRM
- 12.2
CMA / ARV
- ARV (median comp)
- $3,155,624
- List price
- $2,495,000
- Delta
- -20.93%
- Verdict
- UNDERPRICED
- Comps
- 4 within 1.0 mi
Show comp detail 5 sales within ~0.75 mi
| Address | Dist | Beds/Ba | Sqft | Sold | Price | $/sf | Match |
|---|---|---|---|---|---|---|---|
| 4074 Veselich | 0.40mi | 4/3.0 | 2,375 (-4%) | 3mo | $1,425,000 | $600 | 69 |
| 4046 Baywood St | 0.24mi | 5/3.0 (+1) | 2,283 (-8%) | 11mo | $1,240,000 | $543 | 58 |
| 4401 La Clede Ave | 0.24mi | 5/4.0 (+1) | 2,150 (-13%) | 0mo | $1,450,000 | $674 | 54 |
| 4031 Sequoia St | 0.32mi | 4/4.0 | 2,340 (-5%) | 21mo | $875,000 | $374 | 51 |
| 4022 Goodwin Ave | 0.36mi | 5/4.0 (+1) | 2,736 (+11%) | 10mo | $975,000 | $356 | 44 |
Match score weights: distance 35% · size 25% · config 20% · recency 20%. Top-matched comps best support the ARV.
Projected returns pro-forma
-3.0% appreciation · 1.02% rent growth · sell at horizon
- IRR
- -22.9%
- Equity multiple
- 0.23×
- Total profit
- $-541,292
- Equity at exit
- $372,013
- IRR
- -22.6%
- Equity multiple
- -0.06×
- Total profit
- $-738,976
- Equity at exit
- $215,722
Cash invested: $698,600 (down + closing). Projections, not guarantees.
Landlord ↔ Tenant lean methodology
- Overall (CITY)
- 0 Strongly Tenant-Friendly
- State California
- 18 Strongly Tenant-Friendly · D+13
- County
- — inherits STATE
- City Los Angeles
- 0 Strongly Tenant-Friendly · D+22
ZIP-level market 90039
- Rents YoY
- 1.0%
- Active inventory
- 102
- Price-to-rent
- 109.6×
Monthly cashflow live
- Estimated rent
- $16,994 high interval (Pro) →
- Mortgage (P&I)
- −$13,084
- Tax from tax record
- −$914 /mo · $10,968/yr
- Insurance
- −$1,040
- HOA
- −$0
- Vacancy / Maint / Mgmt
- −$3,569
- Net cashflow
- $-1,612
Break-even live
8-unit breakdown (identical units grouped — click to expand)
| Units | Beds | Baths | Est. rent |
|---|---|---|---|
| 4× units | 1 | 1 | $7,588 |
| #1 | 1 | 1 | $1,897 |
| #2 | 1 | 1 | $1,897 |
| #3 | 1 | 1 | $1,897 |
| #4 | 1 | 1 | $1,897 |
| 3× units | 2 | 1 | $6,237 |
| #5 | 2 | 1 | $2,079 |
| #6 | 2 | 1 | $2,079 |
| #7 | 2 | 1 | $2,079 |
| 1× unit | 4 | 3 | $3,167 |
| Total (8 units) | $16,994 | ||
UW: 25.0% down · 7.5% · 30yr · 1.5% tax · 5.0% vac · 8.0% maint · 8.0% mgmt
Financing live
Cash to close
- Down payment
- $623,750
- Closing costs
- $74,850
- Reserves months
- —
- Total cash needed
- —
Loan-product check · same deal, 3 products live
Conventional
25% down · 7.5% · 30yr
- Down + closing
- —
- Monthly P&I
- —
- Monthly cashflow
- —
- DSCR
- —
- Eligible?
- —
Personal DTI + credit; lowest rate.
DSCR
20% down · 8.5% · 30yr
- Down + closing
- —
- Monthly P&I
- —
- Monthly cashflow
- —
- DSCR
- —
- Eligible?
- —
No personal income docs; deal must DSCR.
Hard money
10% down · 12.0% · 12mo
- Down + closing
- —
- Monthly P&I
- —
- Monthly cashflow
- —
- DSCR
- —
- Eligible?
- —
Short-term bridge; refi at stabilization.
Rent comps 9 comps
| Address | Beds | Baths | Sqft | Rent | $/sqft | DOM | Units | Dist |
|---|---|---|---|---|---|---|---|---|
| 4288 Perlita Ave Los Angeles, CA | 3.0 | 3.0 | 1658 | $5,900 | $3.56 | 44d | 1 | 0.18mi |
| 4114 Edenhurst Ave Los Angeles, CA | 4.0 | 2.0 | 1784 | $7,500 | $4.20 | 24d | 1 | 0.39mi |
| 349 W Lomita Ave Glendale, CA | 5.0 | 2.0 | 2076 | $5,500 | $2.65 | 44d | 1 | 0.84mi |
| 327 Vine St Glendale, CA | 3.0 | 2.0 | 1854 | $6,500 | $3.51 | 44d | 1 | 0.93mi |
| 3710 Arbolada Rd Los Angeles, CA | 3.0 | 2.0 | 1624 | $7,800 | $4.80 | 44d | 1 | 1.22mi |
| 4053 Cromwell Ave Los Angeles, CA | 3.0 | 3.0 | 2515 | $10,500 | $4.17 | 44d | 1 | 1.28mi |
| 3365 Ley Dr Los Angeles, CA | 4.0 | 3.0 | 2436 | $10,000 | $4.11 | 44d | 1 | 1.29mi |
| 3084 St George St Los Angeles, CA | 3.0 | 3.0 | 2113 | $7,795 | $3.69 | 5d | 1 | 1.32mi |
| 3037 St George St Los Angeles, CA | 3.0 | 2.0 | 1890 | $6,950 | $3.68 | 44d | 1 | 1.41mi |
Listing history 39 events
-
2026-06-18days on market $2,495,000 Active 106 DOM
-
2026-06-17days on market $2,495,000 Active 105 DOM
-
2026-06-16days on market $2,495,000 Active 104 DOM
-
2026-06-15days on market $2,495,000 Active 103 DOM
-
2026-06-13pricedays on market $2,495,000 Active 101 DOM
-
2026-06-09days on market $2,595,000 Active 97 DOM
-
2026-06-08days on market $2,595,000 Active 96 DOM
-
2026-06-07days on market $2,595,000 Active 95 DOM
-
2026-06-04days on market $2,595,000 Active 92 DOM
-
2026-06-03days on market $2,595,000 Active 91 DOM
-
2026-06-02days on market $2,595,000 Active 90 DOM
-
2026-06-01days on market $2,595,000 Active 89 DOM
-
2026-05-31days on market $2,595,000 Active 88 DOM
-
2026-04-22price $2,595,000 2481-char remark
Show marketing remark (2481 chars)
4316 Edenhurst Avenue presents a well-maintained and recently improved multifamily investment opportunity in a strong rental pocket of Los Angeles, near the border of Glendale. Offering an attractive and diverse unit mix, completed seismic retrofit upgrades, and proximity to major retail and transit corridors, the property is well positioned for both stable cash flow and long-term appreciation. The building features a desirable 8-unit configuration consisting of 4 one-bedroom/one-bath units, 3 two-bedroom/one-bath units, and 1 spacious four-bedroom/three-bath unit. This blend of unit sizes appeals to a wide tenant base, from individuals and couples to larger households seeking additional space helping support strong occupancy in this high-demand rental location. Individually metered gas and electric service enhances operational efficiency and reduces owner utility exposure. Recent capital improvements further strengthen the asset. Seismic retrofitting was completed in March 2025, providing compliance and added structural security. The property also features new exterior paint and a recently repaved driveway, improving curb appeal and overall functionality. A central water heater system supports building efficiency, while on-site laundry facilities and on-site parking add convenience and tenant appeal key amenities in this competitive rental market. Location is a major highlight. The property offers quick access to the Interstate 5 and California State Route 134, allowing convenient connectivity to surrounding employment hubs and lifestyle destinations. It is a short distance from the Glendale Transportation Center, enhancing public transit accessibility. Tenants also benefit from proximity to major shopping and entertainment at the Glendale Galleria, as well as national retailers including Costco and The Home Depot. With its strong Los Angeles location, completed 2025 seismic retrofit, recent exterior upgrades, and well-balanced unit mix including a large four-bedroom unit 4316 Edenhurst Avenue represents a compelling multifamily opportunity combining stability, improved infrastructure, and long-term upside in a proven rental corridor. This information has been secured from sources we believe to be reliable, but we make no representations or warranties, expressed or implied as to the accuracy of the information. References to square footage or age are approximate. Buyer must verify the information and bears all risk for any inaccuracies.
-
2026-03-03$2,850,000 Active 2481-char remark
Show marketing remark (2481 chars)
4316 Edenhurst Avenue presents a well-maintained and recently improved multifamily investment opportunity in a strong rental pocket of Los Angeles, near the border of Glendale. Offering an attractive and diverse unit mix, completed seismic retrofit upgrades, and proximity to major retail and transit corridors, the property is well positioned for both stable cash flow and long-term appreciation. The building features a desirable 8-unit configuration consisting of 4 one-bedroom/one-bath units, 3 two-bedroom/one-bath units, and 1 spacious four-bedroom/three-bath unit. This blend of unit sizes appeals to a wide tenant base, from individuals and couples to larger households seeking additional space helping support strong occupancy in this high-demand rental location. Individually metered gas and electric service enhances operational efficiency and reduces owner utility exposure. Recent capital improvements further strengthen the asset. Seismic retrofitting was completed in March 2025, providing compliance and added structural security. The property also features new exterior paint and a recently repaved driveway, improving curb appeal and overall functionality. A central water heater system supports building efficiency, while on-site laundry facilities and on-site parking add convenience and tenant appeal key amenities in this competitive rental market. Location is a major highlight. The property offers quick access to the Interstate 5 and California State Route 134, allowing convenient connectivity to surrounding employment hubs and lifestyle destinations. It is a short distance from the Glendale Transportation Center, enhancing public transit accessibility. Tenants also benefit from proximity to major shopping and entertainment at the Glendale Galleria, as well as national retailers including Costco and The Home Depot. With its strong Los Angeles location, completed 2025 seismic retrofit, recent exterior upgrades, and well-balanced unit mix including a large four-bedroom unit 4316 Edenhurst Avenue represents a compelling multifamily opportunity combining stability, improved infrastructure, and long-term upside in a proven rental corridor. This information has been secured from sources we believe to be reliable, but we make no representations or warranties, expressed or implied as to the accuracy of the information. References to square footage or age are approximate. Buyer must verify the information and bears all risk for any inaccuracies.
-
2024-08-09historical
-
2024-03-20$3,495,000 Active
-
2023-08-19historical
-
2023-07-19
-
2011-09-23historical
-
2010-06-23price $1,495,000
-
2010-05-19$1,595,000 Active
-
2008-12-31historical
-
2008-12-31historical
-
2008-05-01$1,395,000
-
2008-04-29historical
-
2008-04-25historical
-
2008-04-24
-
2007-01-01$1,395,000
-
2007-01-01$1,395,000
-
2006-12-29
-
2006-12-26historical
-
2006-12-25historical
-
2006-04-20
-
2006-04-20$1,250,000
-
1999-07-07soldstatus $492,500
-
1999-06-07soldstatus $492,500
-
1999-04-19historical
-
1999-03-22$549,000
ⓘ Source: listings_history table (triggers on properties + properties_extension) + one-shot
backfill from property_details.listing_events for pre-trigger history.
Tax reassessment forecast CA · Resets to sale price
- Current annual tax
- $10,968 · $914/mo
- Projected year-2 tax
- $18,962 · $1,580/mo
- Expected delta
- +$7,994/yr (+$666/mo · 72.9%)
ⓘ Screening estimate from a state-policy table — verify with the county assessor before closing.
Climate risk First Street
- Flood 1/10 Low FEMA zone X (unshaded) · 0% chance over 30 yrs
- Wildfire 5/10 Major
- Heat 6/10 Major 7 d/yr ≥94°F today · 23 d/yr by 30 yrs out
- Wind 1/10 Low
- Air quality 5/10 Major 8 unhealthy d/yr today · 8 by 30 yrs out
Nearby sold comps map
Loading sold comps map…
Walkable amenities ~0.75 mi
Loading nearby amenities…
Taxation est. · year 1
- Rental income
- $203,928
- − Mortgage interest
- −$139,759
- − Property taxes
- −$10,968
- − Insurance
- −$12,475
- − Repairs & maintenance
- −$16,314
- − Management
- −$16,314
- − Depreciation
- −$72,582
- Taxable loss
- −$64,484
- Est. tax savings @ 24.0%
- +$15,476
- After-tax cash flow
- $-3,873/yr
For passive investors: Depreciation is non-cash, so a rental often shows a tax loss while cash-flowing — sheltering income. Rental losses are passive: they offset passive income freely, and up to $25,000/yr can offset ordinary (W-2) income if you actively participate and your MAGI is under $100k (phasing out to $0 by $150k); unused losses carry forward. On sale, claimed depreciation is recaptured at up to 25%, and gains may owe capital-gains tax (a 1031 exchange can defer both). Figures are a year-1 estimate at your 24.0% rate — not tax advice; consult a CPA.
Schools (NCES district)
- District
- Los Angeles Unified
- NCES district ID
- 0622710
- Math proficiency
- 29% ▼ -4.00%
- Reading proficiency
- 54% ▲ 10.00%
- Median HH income
- $50,403
- Composite
- 35.67/100
- National rank
- #4875
- State rank
- #223 of 517 in CA
Livability — Los Angeles
- Score
- 68/100
- State rank
- #273
- US rank
- #9237
Category grades
Schools grade is shown separately in the Schools card above.
Census & demographics
- Census place
- Los Angeles, CA
- County
- Los Angeles County · 9,444,647 people
- City population
- 3,838,149
- Metro
- Los Angeles-Long Beach-Anaheim, CA
- Population (ZIP)
- 28,884
- Household income
- $113,818
- Rent vs Own
- Severe rent burden
- 1726.0
Population outlook (Los Angeles County) Hauer SSP2
- Today (2025)
- 10,940,515 people
- By 2030
- 11,256,481 · +2.9%
- By 2040
- 11,729,929 · +7.2%
- By 2050
- 11,948,407 · +9.2%
- By 2075
- 11,818,114 · +8.0%
- By 2100
- 10,842,928 · -0.9%
Race, ethnicity, and origin ACS 2023
- Neighborhood character
- Diverse neighborhood (Simpson 0.69)
- Race & ethnicity
- White 42% Hispanic / Latino 31% Asian 19% Two or more races 14% Black 2%
- Hispanic origin (detail)
- Mexican 17%
- Common ancestry
- Romanian 2% Italian 2% Scotch-Irish 2%
- Foreign-born
- 30% · Canada, China, South Korea
- Languages at home
- 59% English-only · Spanish 25% Tagalog/Filipino 8% Other Indo-European 2%
Political lean MEDSL · Los Angeles
- 2024 margin
- Solid D (+32.9) · D 64.8% · R 31.9% · Other 3.3%
- 2008→2024 swing
- -7.4pp toward R · 2008: 40.4pp · 2024: 32.9pp
- All cycles
- 2024: D+32.9 2020: D+44.2 2016: D+48.0 2012: D+40.0 2008: D+40.4
Not yet ingested
- Civics
- —
Market trends
- HPI YoY
- ▼ -987.09%
- Current HPI
- 469.7964
- Rent YoY
- ▲ 1.02%
- Metro
- Los Angeles-Long Beach-Anaheim, CA
- State GDP YoY
- ▲ 3.21%
- F500 in state
- 116
Industry mix (Fortune 500 HQ in CA)
| Industry | F500 HQs | Revenue |
|---|---|---|
| Technology | 27 | $1,492B |
|
||
| Financial Services | 3 | $174B |
|
||
| Retail | 3 | $44B |
|
||
| Insurance | 3 | $26B |
|
||
| Media / Entertainment | 2 | $115B |
|
||
| Pharmaceuticals / Biotech | 2 | $62B |
|
||
Price history
+372.7% since first listed26 events — show timeline
- 2026-04-22 Price Changed $2,595,000 TheMLS
- 2026-03-03 Listed $2,850,000 TheMLS
- 2024-08-09 Listing Removed — CRMLS
- 2024-03-20 Listed $3,495,000 CRMLS
- 2023-08-19 Rental Removed — RENT.
- 2023-07-19 Listed for Rent — RENT.
- 2011-09-23 Listing Removed — CRMLS
- 2010-06-23 Price Changed $1,495,000 CRMLS
- 2010-05-19 Listed $1,595,000 CRMLS
- 2008-12-31 Delisted — TheMLS
- 2008-12-31 Listing Removed — CRMLS
- 2008-05-01 Listed $1,395,000 CRMLS
- 2008-04-29 Listing Removed — CRMLS
- 2008-04-25 Delisted — TheMLS
- 2008-04-24 Listed — TheMLS
- 2007-01-01 Listed $1,395,000 CRMLS
- 2007-01-01 Listed $1,395,000 CRMLS
- 2006-12-29 Listed — TheMLS
- 2006-12-26 Delisted — TheMLS
- 2006-12-25 Listing Removed — CRMLS
- 2006-04-20 Listed $1,250,000 CRMLS
- 2006-04-20 Listed — TheMLS
- 1999-07-07 Sold (Public Records) $492,500 Public Records
- 1999-06-07 Sold (MLS) $492,500 TheMLS
- 1999-04-19 Delisted — TheMLS
- 1999-03-22 Listed $549,000 TheMLS
Property tax history
+1.9%/yrLatest (2025): $10,968 · +2.3% YoY. Source: county tax records.
Cash-flow waterfall
monthlySold comps — $/sqft
last 12 mo · ≤1 miLoading sold comps…