29 River St · Stamford, NY
Flood risk 9/10 · Severe
- FEMA flood zone
- X (unshaded)
- Chance of flooding over 30 yrs
- 0.99%
- Est. flood insurance / yr
- $473 – $860
Fire risk 3/10 · Minor
- Est. fire insurance / yr
- $691 – $1,283
Heat risk 1/10 · Minimal
- Hot days now (above 87°F)
- 8 days/yr
- Hot days in 30 yrs
- 19 days/yr
Wind risk 2/10 · Minimal
- Chance of severe wind over 30 yrs
- 2.0%
Air-quality risk 1/10 · Minimal
- Unhealthy air days now
- 0 days/yr
- Unhealthy air days in 30 yrs
- 0 days/yr
Risk factors via First Street. Map © Google.
Why this score? — see what drove the A- grade
The composite is a weighted blend of 9 inputs, each scored 0–100. Each bar is that input's sub-score; the figure is the points it added to the 100-point composite (weight × sub-score).
- Cash flow +30.0/30.0
- ARV discount +15.0/15.0
- 1% rule +10.0/10.0
- DSCR +10.0/10.0
- Appreciation +7.6/10.0
- Schools +3.4/10.0
- Livability +3.4/5.0
- Rent growth +2.5/5.0
- Condition / age +2.5/5.0
$180,000
🖨 Deal sheet (PDF) 📄 Offer letter ✓ Due diligence
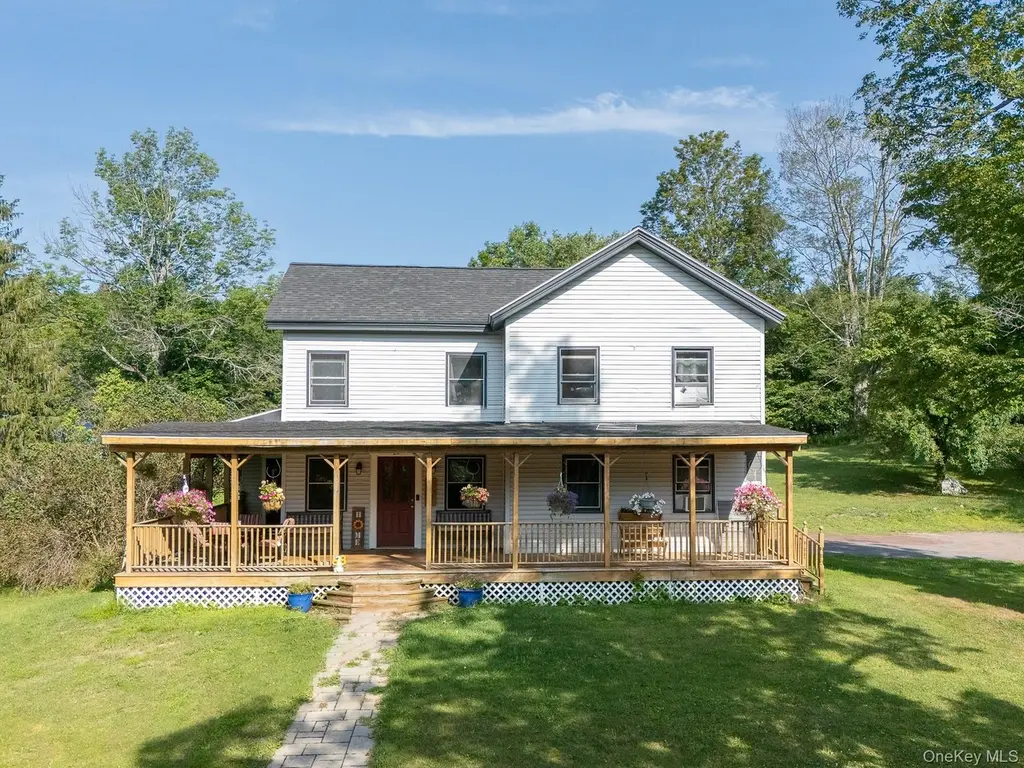
Listing remarks
Welcome to living in beautiful Stamford, New York! This lovely home boasts a large wrap around porch, four bedrooms, a back deck with hot tub, ample parking, newer kitchen with quartz counters and slow close drawers and cabinets! This home has a newer roof, newer water heater, brand new dishwasher, updated kitchen with a propane stove too. Entertaining will be a breeze here as you have a large wrap around porch, back deck with a hot tub and 1.22 acres to gather everyone together. From the living room and front porch, you have a seasonal view of the mountains which turn incredible shades of red, yellow and orange come Autumn. Enjoy a cup of coffee on the deck each morning and a glass of wine
Key facts
- Wrap around porch
- Propane stove
- Brand new dishwasher
Tags
Neighborhood map
What this means for you Summary
Snapshot
- This is a 3-bed/1.5-bath single-family listed at $180k.
Deal economics
- At list price, monthly cash flow is $1k ($14k/yr) — positive.
- The deal already cash-flows at list — no discount required.
- Meets the 1% rule at list price ($3k rent vs $180k).
- Recommended offer: $158k (12.0% below list) — sets the bar for market timing.
- Cap rate 14.7% vs local median 5.3% in Stamford — top-decile yield for the area; either an underpriced asset or a hidden risk that comps aren't pricing in. Stress-test before assuming the spread holds.
Location & tenants
- Location reads 67/100 on livability (#574 in NY) — a middle-class / working-renter tenant base. Strengths: housing A+, cost of living A, crime A-; Watch: employment C-, schools D-, amenities F.
- Stamford Central School District (rural): math 40% / reading 35% proficiency, ranked #675 of 755 in NY (top 89%) — families likely to look elsewhere, expect single-tenant / working-renter base with shorter leases.
- Market conditions: 36 active listings in the ZIP; 66 units permitted in Delaware County in 2024 (0 in 5+ unit buildings).
Forward outlook
- In year one you build about $11k of equity ($1k loan paydown + $9k appreciation (5.2% local appreciation)).
- Delaware County population projected at -27% by 2050 — secular population decline; favor cash flow + early exit over multi-decade hold.
- At projected returns (5.2% appreciation + 3.0% rent growth), your $50k cash investment doubles in ~2 years — after that, you're playing with house money.
- By year 4, paydown + projected appreciation supports a ~$36k cash-out refi (75% LTV) — recoverable capital for the next deal without selling this one.
Negotiation context
- It's been on market 218 days — a 12% lower offer ($158k) is reasonable based on typical stale-listing flexibility.
- 2 sale attempts; this cycle's ask has dropped $95k (35%) from the opening price — seller is motivated, your offer sets the floor, not the list.
- Current owner paid $82k; list at $180k implies a 120% gain — meaningful room to come down on a strong offer.
Risks & watch-outs
- Watch-outs: property tax is 2.7% of price; flood insurance adds $56/mo; built in 1900 — expect roof / HVAC / electrical / plumbing capex.
- Climate carrying-cost: severe flood risk — expect insurance premiums to compound above CPI over the hold.
Questions for the listing agent
- It's been on market 218 days. Have you received any prior offers? Is the seller open to a 12% concession, seller financing, or rate buy-down credit?
- Built in 1900 — when were the roof, HVAC, electrical panel, plumbing, and water heater last replaced?
- Property tax is high relative to price — has the assessment been appealed recently, and will the sale trigger a re-assessment?
- What's the actual annual flood-insurance premium (NFIP or private), and is the property in a SFHA with mandatory coverage?
- Why hasn't it sold? Are there any deal-killer items the seller is aware of (foundation, flood, title, zoning, code violations)?
- Is there a deadline driving the sale (1031 exchange, divorce, estate, relocation)? That informs how much negotiation room exists.
- Schools are D-rated, which usually means shorter tenancies and higher turnover. Who's the typical renter profile here, and what's been the actual vacancy rate?
- What's the average days-on-market for RENTAL listings here right now (not sales)? A rising rental-DOM trend means longer vacancies and softer asking-rent achievability than the comps imply.
- What's the recent tenant-quality profile in this submarket — average credit score on applications, eviction rate, late-payment / NSF rate, and stable-employment percentage? A property-management company in the area should have these aggregated.
- How much new for-sale + rental construction is in the pipeline within 1–3 miles? Heavy new supply typically softens prices + rents 12–24 months out; constrained supply supports both.
Investment metrics
- 1% rule
- 1.89% ✓
- Cap rate
- 14.70%
- Cash-on-cash
- 30.03%
- DSCR
- 2.34
- GRM
- 4.4
CMA / ARV
- ARV (on-the-fly)
- $266,700
- Comps found
- 3
Show comp detail 3 sales within ~0.75 mi
| Address | Dist | Beds/Ba | Sqft | Sold | Price | $/sf | Match |
|---|---|---|---|---|---|---|---|
| 11 River St | 0.14mi | 4/2.0 (+1) | 2,040 (-3%) | 3mo | $260,000 | $127 | 79 |
| 15 Lake St | 0.26mi | 4/1.5 (+1) | 2,400 (+14%) | 2mo | $215,000 | $90 | 58 |
| 94 Main St | 0.41mi | 3/2.0 | 1,830 (-13%) | 8mo | $292,000 | $160 | 51 |
Match score weights: distance 35% · size 25% · config 20% · recency 20%. Top-matched comps best support the ARV.
Projected returns pro-forma
5.21% appreciation · 3.0% rent growth · sell at horizon
- IRR
- 38.4%
- Equity multiple
- 3.39×
- Total profit
- $120,616
- Equity at exit
- $104,275
- IRR
- 36.4%
- Equity multiple
- 6.91×
- Total profit
- $297,674
- Equity at exit
- $181,871
Cash invested: $50,400 (down + closing). Projections, not guarantees.
Landlord ↔ Tenant lean methodology
- Overall (STATE)
- 15 Strongly Tenant-Friendly
- State New York
- 15 Strongly Tenant-Friendly · D+10
- County
- — inherits STATE
- City
- — inherits STATE
ZIP-level market 12167
- Home prices YoY
- 1.4%
- Active inventory
- 36
- Price-to-rent
- 4.4×
Monthly cashflow live
- Estimated rent
- $3,408 medium interval (Pro) →
- Mortgage (P&I)
- −$944
- Tax from tax record
- −$412 /mo · $4,946/yr
- Insurance
- −$75
- Flood insurance flood zone
- −$56 /mo · $666/yr
- HOA
- −$0
- Vacancy / Maint / Mgmt
- −$716
- Net cashflow
- $1,206
Break-even live
Sensitivity live
| Price | -10% $1,308 | -5% $1,257 | +0% $1,206 | +5% $1,155 | +10% $1,104 |
|---|---|---|---|---|---|
| Rent | -10% $936 | -5% $1,071 | +0% $1,206 | +5% $1,340 | +10% $1,475 |
| Rate | -1.0pp $1,296 | -0.5pp $1,252 | base $1,206 | +0.5pp $1,159 | +1.0pp $1,112 |
UW: 25.0% down · 7.5% · 30yr · 1.5% tax · 5.0% vac · 8.0% maint · 8.0% mgmt
Financing live
Cash to close
- Down payment
- $45,000
- Closing costs
- $5,400
- Reserves months
- —
- Total cash needed
- —
Loan-product check · same deal, 3 products live
Conventional
25% down · 7.5% · 30yr
- Down + closing
- —
- Monthly P&I
- —
- Monthly cashflow
- —
- DSCR
- —
- Eligible?
- —
Personal DTI + credit; lowest rate.
DSCR
20% down · 8.5% · 30yr
- Down + closing
- —
- Monthly P&I
- —
- Monthly cashflow
- —
- DSCR
- —
- Eligible?
- —
No personal income docs; deal must DSCR.
Hard money
10% down · 12.0% · 12mo
- Down + closing
- —
- Monthly P&I
- —
- Monthly cashflow
- —
- DSCR
- —
- Eligible?
- —
Short-term bridge; refi at stabilization.
Listing history 11 events
-
2026-03-24status Pending
-
2026-02-20price $180,000
-
2026-02-09status Active
-
2026-01-05price $190,000
-
2025-12-06price $210,000
-
2025-10-29price $225,000
-
2025-10-15price $249,000
-
2025-09-10price $265,000
-
2025-08-10$275,000 Active
-
2001-03-08soldstatus $82,000
-
1994-12-14soldstatus $35,000
ⓘ Source: listings_history table (triggers on properties + properties_extension) + one-shot
backfill from property_details.listing_events for pre-trigger history.
Tax reassessment forecast NY · Partial reset (capped growth)
- Current annual tax
- $4,946 · $412/mo
- Projected year-2 tax
- $4,946 · $412/mo
- Expected delta
- $0/yr ($0/mo · 0.0%)
ⓘ Screening estimate from a state-policy table — verify with the county assessor before closing.
Climate risk First Street
- Flood 9/10 Extreme FEMA zone X (unshaded) · 99% chance over 30 yrs
- Wildfire 3/10 Moderate
- Heat 1/10 Low 8 d/yr ≥87°F today · 19 d/yr by 30 yrs out
- Wind 2/10 Low 2% chance of damaging wind over 30 yrs
- Air quality 1/10 Low 0 unhealthy d/yr today · 0 by 30 yrs out
Nearby sold comps map
Loading sold comps map…
Walkable amenities ~0.75 mi
Loading nearby amenities…
Taxation est. · year 1
- Rental income
- $40,897
- − Mortgage interest
- −$10,083
- − Property taxes
- −$4,946
- − Insurance
- −$1,566
- − Repairs & maintenance
- −$3,272
- − Management
- −$3,272
- − Depreciation
- −$5,236
- Taxable income
- $12,522
- Est. tax owed @ 24.0%
- −$3,005
- After-tax cash flow
- $11,464/yr
For passive investors: Depreciation is non-cash, so a rental often shows a tax loss while cash-flowing — sheltering income. Rental losses are passive: they offset passive income freely, and up to $25,000/yr can offset ordinary (W-2) income if you actively participate and your MAGI is under $100k (phasing out to $0 by $150k); unused losses carry forward. On sale, claimed depreciation is recaptured at up to 25%, and gains may owe capital-gains tax (a 1031 exchange can defer both). Figures are a year-1 estimate at your 24.0% rate — not tax advice; consult a CPA.
Schools (NCES district)
- District
- Stamford Central School District
- NCES district ID
- 3628020
- Math proficiency
- 40% ▼ -10.00%
- Reading proficiency
- 35% ▼ -10.00%
- Median HH income
- $42,968
- Composite
- 34.29/100
- National rank
- #10231
- State rank
- #675 of 755 in NY
Livability — Stamford
- Score
- 67/100
- State rank
- #574
- US rank
- #10332
Category grades
Schools grade is shown separately in the Schools card above.
Census & demographics
- Census place
- Stamford, NY
- Population (ZIP)
- 2,257
Population outlook (Delaware County) Hauer SSP2
- Today (2025)
- 42,668 people
- By 2030
- 40,337 · -5.5%
- By 2040
- 35,514 · -16.8%
- By 2050
- 31,265 · -26.7%
- By 2075
- 24,455 · -42.7%
- By 2100
- 19,529 · -54.2%
Race, ethnicity, and origin ACS 2023
- Neighborhood character
- Predominantly White (94%)
- Race & ethnicity
- White 94% Two or more races 4% Hispanic / Latino 2%
- Common ancestry
- Romanian 8% Iranian 3% Lithuanian 2%
- Foreign-born
- 3% · Canada, China
- Languages at home
- 94% English-only · Other Indo-European 3% Spanish 1% Russian/Polish/Slavic 1%
Political lean MEDSL · Delaware
- 2024 margin
- R (+19.8) · D 40.1% · R 59.9%
- 2008→2024 swing
- -14.6pp toward R · 2008: -5.2pp · 2024: -19.8pp
- All cycles
- 2024: R+19.8 2020: R+18.4 2016: R+29.2 2012: R+9.6 2008: R+5.2
Not yet ingested
- Civics
- —
Market trends
- HPI YoY
- ▲ 5.21%
- Current HPI
- 368.4492
- Rent YoY
- —
- Metro
- —
- State GDP YoY
- ▲ 2.60%
- F500 in state
- 92
Industry mix (Fortune 500 HQ in NY)
| Industry | F500 HQs | Revenue |
|---|---|---|
| Financial Services | 10 | $950B |
|
||
| Consumer Goods | 9 | $162B |
|
||
| Insurance | 4 | $225B |
|
||
| Telecommunications | 2 | $144B |
|
||
| Pharmaceuticals | 2 | $112B |
|
||
| Media / Entertainment | 2 | $69B |
|
||
Price history
+414.3% since first listed11 events — show timeline
- 2026-03-24 Pending — OneKey® MLS as Distributed by MLS Grid
- 2026-02-20 Price Changed $180,000 OneKey® MLS as Distributed by MLS Grid
- 2026-02-09 Relisted — OneKey® MLS as Distributed by MLS Grid
- 2026-01-05 Price Changed $190,000 OneKey® MLS as Distributed by MLS Grid
- 2025-12-06 Price Changed $210,000 OneKey® MLS as Distributed by MLS Grid
- 2025-10-29 Price Changed $225,000 OneKey® MLS as Distributed by MLS Grid
- 2025-10-15 Price Changed $249,000 OneKey® MLS as Distributed by MLS Grid
- 2025-09-10 Price Changed $265,000 OneKey® MLS as Distributed by MLS Grid
- 2025-08-10 Listed $275,000 OneKey® MLS as Distributed by MLS Grid
- 2001-03-08 Sold (Public Records) $82,000 Public Records
- 1994-12-14 Sold (Public Records) $35,000 Public Records
Property tax history
+3.6%/yrLatest (2025): $4,946 · +2.7% YoY. Source: county tax records.
Cash-flow waterfall
monthlySold comps — $/sqft
last 12 mo · ≤1 miLoading sold comps…