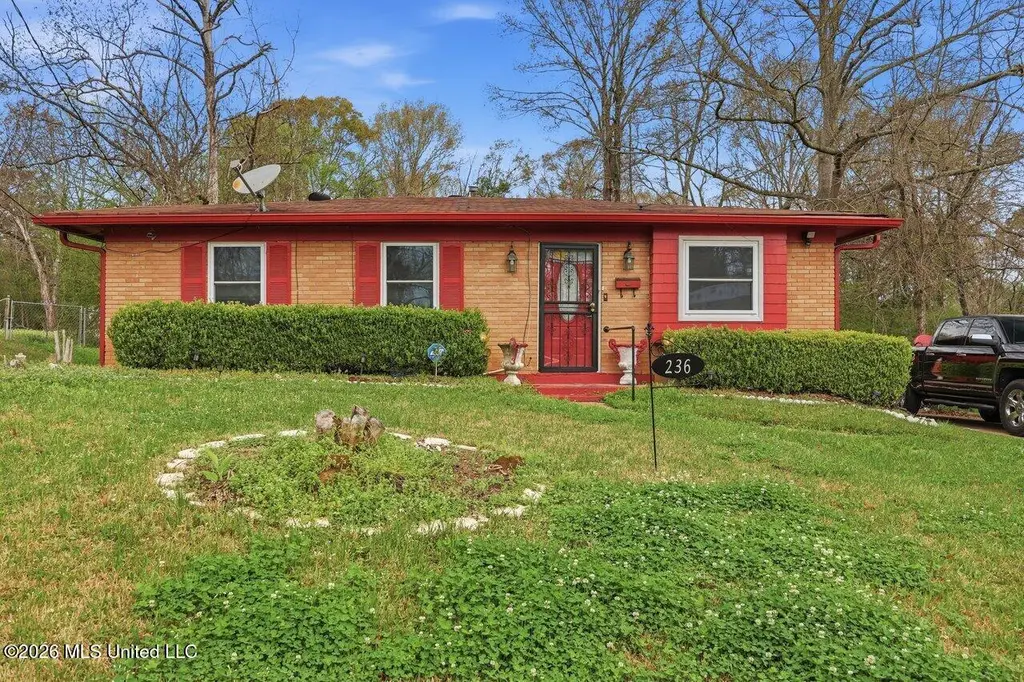
236 Cherry Hill Dr · Jackson, MS
Flood risk 1/10 · Minimal
- FEMA flood zone
- X (unshaded)
- Chance of flooding over 30 yrs
- 0.0%
- Est. flood insurance / yr
- $507 – $1,088
Fire risk 1/10 · Minimal
- Est. fire insurance / yr
- $1,241 – $2,305
Heat risk 7/10 · Major
- Hot days now (above 108°F)
- 7 days/yr
- Hot days in 30 yrs
- 19 days/yr
Wind risk 8/10 · Major
- Chance of severe wind over 30 yrs
- 80.0%
Air-quality risk 1/10 · Minimal
- Unhealthy air days now
- 0 days/yr
- Unhealthy air days in 30 yrs
- 0 days/yr
Risk factors via First Street. Map © Google.
Why this score? — see what drove the B- grade
The composite is a weighted blend of 9 inputs, each scored 0–100. Each bar is that input's sub-score; the figure is the points it added to the 100-point composite (weight × sub-score).
- Cash flow +30.0/30.0
- DSCR +10.0/10.0
- 1% rule +9.0/10.0
- ARV discount +7.5/15.0
- Rent growth +3.6/5.0
- Livability +3.4/5.0
- Condition / age +2.5/5.0
- Schools +1.1/10.0
- Appreciation +0.0/10.0
$87,500
🖨 Deal sheet 📄 Offer letter ✓ Due diligence
Listing remarks MLS
Opportunity awaits with this charming 3-bedroom, 1-bath home offering over 1,300 square feet of living space! This property features a beautiful setting and a welcoming side deck--perfect for relaxing or entertaining. The home has had a minor electrical fire and is priced accordingly, making it an excellent opportunity for investors, flippers, or first-time buyers looking to add value and make it their own. With new windows already installed and a partially updated roof, this home has a strong foundation for your vision. Whether you're looking for your next investment project or a place to customize to your taste, this motivated seller is ready to make a deal. Don't miss out on the potential this property has to offer!
Key facts
- Welcoming side deck
- Strong foundation
- New windows
Tags
Neighborhood map
What this means for you Summary
Snapshot
- This is a 3-bed/1.0-bath single-family listed at $88k.
Deal economics
- At list price, monthly cash flow is $422 ($5k/yr) — positive.
- The deal already cash-flows at list — no discount required.
- Meets the 1% rule at list price ($1k rent vs $88k).
- Recommended offer: $80k (9.0% below list) — sets the bar for market timing.
- Cap rate 12.1% vs local median 9.9% in Jackson — meaningfully above typical; check what's discounted (condition, days-on-market, listing class) to confirm the premium yield is real.
Location & tenants
- Location reads 68/100 on livability (#66 in MS) — a middle-class / working-renter tenant base. Strengths: commute A+, cost of living A+, housing A+; Watch: schools F, amenities F, employment F.
- Jackson Public School District (urban): math 9% / reading 18% proficiency, ranked #112 of 130 in MS (top 86%) — low school quality limits family demand, transient renter base, plan for 1-2y turnover; 88% free/reduced lunch — lower-income household profile, screen leases tightly.
- Market conditions: Rents rising fast (+4.2%/yr); 302 active listings in the ZIP; 40 comparable units currently listed for rent nearby; rentals at typical pace (median 24d on market — plan ~3-4 weeks tenant-placement turnaround); 167 units permitted in Hinds County in 2024 (0 in 5+ unit buildings).
Forward outlook
- Local home prices are declining (-3.0%/yr); year-one equity from $605 of loan paydown is wiped out by about $3k of value loss. Plan a longer hold.
- Hinds County population projected to shrink 6% by 2050 — rents likely to lag national; underwrite the cash flow, not the appreciation.
- At projected returns (-3.0% appreciation + 4.2% rent growth), your $24k cash investment doubles in ~6 years — after that, you're playing with house money.
Negotiation context
- It's been on market 91 days — a 9% lower offer ($80k) is reasonable based on typical stale-listing flexibility.
- 6 sale attempts since 20y ago with the ask held roughly flat each time — persistent listings suggest the price (not the market) is what's stuck; bring a comps-based counter.
Risks & watch-outs
- Climate carrying-cost: severe wind risk, 80% chance of damaging wind over 30y; extreme-heat days projected 7→19/yr by 2055 (HVAC capex compounding) — expect insurance premiums to compound above CPI over the hold.
Questions for the listing agent
- It's been on market 91 days. Have you received any prior offers? Is the seller open to a 9% concession, seller financing, or rate buy-down credit?
- Built in 1966 — when were the roof, HVAC, electrical panel, plumbing, and water heater last replaced?
- Why hasn't it sold? Are there any deal-killer items the seller is aware of (foundation, flood, title, zoning, code violations)?
- Is there a deadline driving the sale (1031 exchange, divorce, estate, relocation)? That informs how much negotiation room exists.
- Schools are F-rated, which usually means shorter tenancies and higher turnover. Who's the typical renter profile here, and what's been the actual vacancy rate?
- What's the average days-on-market for RENTAL listings here right now (not sales)? A rising rental-DOM trend means longer vacancies and softer asking-rent achievability than the comps imply.
- What's the recent tenant-quality profile in this submarket — average credit score on applications, eviction rate, late-payment / NSF rate, and stable-employment percentage? A property-management company in the area should have these aggregated.
- How much new for-sale + rental construction is in the pipeline within 1–3 miles? Heavy new supply typically softens prices + rents 12–24 months out; constrained supply supports both.
Investment metrics
- 1% rule
- 1.40% ✓
- Cap rate
- 12.09%
- Cash-on-cash
- 20.69%
- DSCR
- 1.92
- GRM
- 5.9
CMA / ARV
- ARV (median comp)
- $31,505
- List price
- $87,500
- Delta
- 177.74%
- Verdict
- OVERPRICED
- Comps
- 20 within 1.0 mi
Show comp detail 12 sales within ~0.75 mi
| Address | Dist | Beds/Ba | Sqft | Sold | Price | $/sf | Match |
|---|---|---|---|---|---|---|---|
| 242 Shiloh Dr | 0.37mi | 3/2.0 | 1,396 (+6%) | 0mo | $53,500 | $38 | 68 |
| 167 Treehaven Dr | 0.17mi | 3/2.0 | 1,151 (-12%) | 1mo | $39,500 | $34 | 67 |
| 2524 Coronet Pl | 0.43mi | 3/1.0 | 1,190 (-9%) | 3mo | $30,000 | $25 | 62 |
| 170 Cooper Rd | 0.74mi | 3/1.0 | 1,370 (+4%) | 2mo | $18,500 | $14 | 57 |
| 2805 Engleside Dr | 0.67mi | 3/1.0 | 1,200 (-8%) | 0mo | $54,200 | $45 | 54 |
| 2364 Coronet Pl | 0.67mi | 3/1.0 | 1,190 (-9%) | 6mo | $74,500 | $63 | 48 |
| 2365 Paden St | 0.71mi | 3/2.0 | 1,236 (-6%) | 7mo | $32,500 | $26 | 48 |
| 267 Woody Dr | 0.57mi | 3/1.5 | 1,165 (-11%) | 8mo | $38,000 | $33 | 46 |
| 2416 Paden St | 0.62mi | 4/2.0 (+1) | 1,178 (-10%) | 0mo | $84,900 | $72 | 45 |
| 3148 Sylvester Dr | 0.67mi | 4/2.0 (+1) | 1,440 (+10%) | 0mo | $59,500 | $41 | 43 |
| 2813 Brookwood Dr | 0.73mi | 3/1.0 | 1,141 (-13%) | 3mo | $45,000 | $39 | 41 |
| 715 Dorgan St | 0.63mi | 3/1.0 | 1,122 (-14%) | 6mo | $77,500 | $69 | 41 |
Match score weights: distance 35% · size 25% · config 20% · recency 20%. Top-matched comps best support the ARV.
Projected returns pro-forma
-3.0% appreciation · 4.23% rent growth · sell at horizon
- IRR
- 14.3%
- Equity multiple
- 1.58×
- Total profit
- $14,249
- Equity at exit
- $13,047
- IRR
- 23.9%
- Equity multiple
- 3.18×
- Total profit
- $53,452
- Equity at exit
- $7,565
Cash invested: $24,500 (down + closing). Projections, not guarantees.
Landlord ↔ Tenant lean methodology
- Overall (STATE)
- 90 Strongly Landlord-Friendly
- State Mississippi
- 90 Strongly Landlord-Friendly · R+11
- County
- — inherits STATE
- City
- — inherits STATE
ZIP-level market 39212
- Home prices YoY
- -11.7%
- Rents YoY
- 4.2%
- Active inventory
- 302
- Price-to-rent
- 5.9×
Monthly cashflow live
- Estimated rent
- $1,227 high interval (Pro) →
- Mortgage (P&I)
- −$459
- Tax from tax record
- −$51 /mo · $616/yr
- Insurance
- −$36
- HOA
- −$0
- Vacancy / Maint / Mgmt
- −$258
- Net cashflow
- $422
Break-even live
UW: 25.0% down · 7.5% · 30yr · 1.5% tax · 5.0% vac · 8.0% maint · 8.0% mgmt
Financing live
Cash to close
- Down payment
- $21,875
- Closing costs
- $2,625
- Reserves months
- —
- Total cash needed
- —
Loan-product check · same deal, 3 products live
Conventional
25% down · 7.5% · 30yr
- Down + closing
- —
- Monthly P&I
- —
- Monthly cashflow
- —
- DSCR
- —
- Eligible?
- —
Personal DTI + credit; lowest rate.
DSCR
20% down · 8.5% · 30yr
- Down + closing
- —
- Monthly P&I
- —
- Monthly cashflow
- —
- DSCR
- —
- Eligible?
- —
No personal income docs; deal must DSCR.
Hard money
10% down · 12.0% · 12mo
- Down + closing
- —
- Monthly P&I
- —
- Monthly cashflow
- —
- DSCR
- —
- Eligible?
- —
Short-term bridge; refi at stabilization.
Rent comps 40 comps
| Address | Beds | Baths | Sqft | Rent | $/sqft | DOM | Units | Dist |
|---|---|---|---|---|---|---|---|---|
| 225 W McDowell Rd Jackson, MS | 1.0–3.0 | 1.0–2.0 | 900 | $1,200 | $1.33 | 43d | 18 | 0.27mi |
| 201 W Santa Clair St Jackson, MS | 2.0 | 1.0 | 1182 | $950 | $0.80 | 13d | 1 | 0.29mi |
| 201 W Santa Clair St Jackson, MS | 2.0 | 1.0 | 1182 | $950 | $0.80 | 23d | 1 | 0.29mi |
| 2858 Fairhill Dr Jackson, MS | 2.0 | 1.0 | 900 | $825 | $0.92 | 43d | 1 | 0.53mi |
| 267 Woody Dr Jackson, MS | 3.0 | 1.5 | 1165 | $1,100 | $0.94 | 43d | 1 | 0.58mi |
| 316 Woody Dr Jackson, MS | 3.0 | 1.0 | 1185 | $1,250 | $1.05 | 13d | 1 | 0.59mi |
| 316 Woody Dr Jackson, MS | 3.0 | 1.0 | 1185 | $1,250 | $1.05 | 43d | 1 | 0.59mi |
| 843 Reaves St Jackson, MS | 3.0 | 2.0 | 1408 | $1,084 | $0.77 | 43d | 1 | 0.62mi |
| 2401 Coronet Pl Jackson, MS | 3.0 | 1.0 | 1200 | $1,400 | $1.17 | 23d | 1 | 0.64mi |
| 2786 Brookwood Dr Jackson, MS | 3.0 | 1.0 | 1003 | $1,100 | $1.10 | 43d | 1 | 0.68mi |
| 3152 Bilgray Dr Jackson, MS | 3.0 | 1.5 | 1200 | $1,100 | $0.92 | 13d | 1 | 0.91mi |
| 3147 Bilgray Dr Jackson, MS | 3.0 | 2.0 | 1850 | $1,306 | $0.71 | 43d | 1 | 0.93mi |
| 360 Cooper Rd Jackson, MS | 4.0 | 2.0 | 1624 | $1,575 | $0.97 | 13d | 1 | 0.94mi |
| 422 Cooper Rd Jackson, MS | 3.0 | 1.0 | 1049 | $1,426 | $1.36 | 23d | 1 | 0.99mi |
| 2729 Carleton St Jackson, MS | 4.0 | 2.0 | 1666 | $1,575 | $0.95 | 13d | 1 | 1.02mi |
| 2873 Teresa Dr Jackson, MS | 3.0 | 1.0 | 1100 | $1,100 | $1.00 | 43d | 1 | 1.13mi |
| 1126 Barbara Ann Dr Jackson, MS | 3.0 | 1.0 | 1343 | $1,000 | $0.74 | 43d | 1 | 1.14mi |
| 1126 Barbara Ann Dr Jackson, MS | 3.0 | 1.0 | 1343 | $1,000 | $0.74 | 13d | 1 | 1.14mi |
| 1223 Marydale Dr Jackson, MS | 3.0 | 1.0 | 1300 | $950 | $0.73 | 43d | 1 | 1.14mi |
| 245 Shady Cir Jackson, MS | 3.0 | 2.0 | 1510 | $1,100 | $0.73 | 23d | 1 | 1.16mi |
| 2242 Castle Hill Dr Jackson, MS | 4.0 | 2.0 | 1500 | $1,475 | $0.98 | 13d | 1 | 1.24mi |
| 2242 Castle Hill Dr Jackson, MS | 4.0 | 2.0 | 1500 | $1,475 | $0.98 | 23d | 1 | 1.24mi |
| 346 Mason Blvd Jackson, MS | 3.0 | 1.0 | 1048 | $1,050 | $1.00 | 13d | 1 | 1.25mi |
| 346 Mason Blvd Jackson, MS | 3.0 | 1.0 | 1048 | $1,050 | $1.00 | 23d | 1 | 1.25mi |
| 3511 Sykes Park Dr Jackson, MS | 3.0 | 2.0 | 1225 | $1,426 | $1.16 | 13d | 1 | 1.28mi |
| 3645 Lee Dr Jackson, MS | 3.0 | 1.0 | 1105 | $895 | $0.81 | 23d | 1 | 1.28mi |
| 1848 Willaneel Dr Jackson, MS | 4.0 | 2.0 | 1623 | $1,100 | $0.68 | 13d | 1 | 1.30mi |
| 3151 Shirley Dr Jackson, MS | 4.0 | 2.0 | 1474 | $1,306 | $0.89 | 13d | 1 | 1.32mi |
| 2732 Woodside Dr Jackson, MS | 4.0 | 2.0 | 1566 | $1,050 | $0.67 | 23d | 1 | 1.37mi |
| 3030 Oak Forest Dr Jackson, MS | 3.0 | 1.5 | 1200 | $1,100 | $0.92 | 43d | 1 | 1.39mi |
| 3030 Oak Forest Dr Jackson, MS | 3.0 | 2.0 | 1200 | $1,100 | $0.92 | 13d | 1 | 1.39mi |
| 2694 Woodside Dr Jackson, MS | 3.0 | 1.0 | 1509 | $1,075 | $0.71 | 23d | 1 | 1.40mi |
| 2694 Woodside Dr Jackson, MS | 3.0 | 1.0 | 1509 | $1,075 | $0.71 | 13d | 1 | 1.40mi |
| 3122 Oak Forest Dr Jackson, MS | 3.0 | 2.0 | 1421 | $1,100 | $0.77 | 43d | 1 | 1.42mi |
| 3162 Oak Forest Dr Jackson, MS | 3.0 | 1.5 | 1280 | $1,236 | $0.97 | 43d | 1 | 1.44mi |
| 103 Sykes Park Cir Jackson, MS | 3.0 | 2.0 | 1500 | $1,250 | $0.83 | 43d | 1 | 1.44mi |
| 3875 Interstate 55 Jackson, MS | 1.0–2.0 | 1.5 | 800 | $1,100 | $1.38 | 13d | 1 | 1.45mi |
| 270 Wildwood Ct Jackson, MS | 3.0 | 1.0 | 1200 | $1,200 | $1.00 | 21d | 1 | 1.47mi |
| 1513 Maria Dr Jackson, MS | 3.0 | 2.0 | 1120 | $1,200 | $1.07 | 13d | 1 | 1.48mi |
| 1513 Maria Dr Jackson, MS | 3.0 | 2.0 | 1120 | $1,200 | $1.07 | 23d | 1 | 1.48mi |
Listing history 34 events
-
2026-06-18days on market $87,500 Active 91 DOM
-
2026-06-17days on market $87,500 Active 90 DOM
-
2026-06-16days on market $87,500 Active 89 DOM
-
2026-06-15days on market $87,500 Active 88 DOM
-
2026-06-14days on market $87,500 Active 86 DOM
-
2026-06-13days on market $87,500 Active 85 DOM
-
2026-06-10days on market $87,500 Active 83 DOM
-
2026-06-09days on market $87,500 Active 82 DOM
-
2026-06-08days on market $87,500 Active 81 DOM
-
2026-06-07days on market $87,500 Active 80 DOM
-
2026-06-05days on market $87,500 Active 77 DOM
-
2026-06-03days on market $87,500 Active 76 DOM
-
2026-06-02pricedays on market $87,500 Active 75 DOM
-
2026-06-01days on market $90,000 Active 74 DOM
-
2026-05-31days on market $90,000 Active 73 DOM
-
2026-05-30days on market $90,000 Active 72 DOM
-
2026-03-18$90,000 Active 734-char remark
Show marketing remark (734 chars)
Opportunity awaits with this charming 3-bedroom, 1-bath home offering over 1,300 square feet of living space! This property features a beautiful setting and a welcoming side deck--perfect for relaxing or entertaining. The home has had a minor electrical fire and is priced accordingly, making it an excellent opportunity for investors, flippers, or first-time buyers looking to add value and make it their own. With new windows already installed and a partially updated roof, this home has a strong foundation for your vision. Whether you're looking for your next investment project or a place to customize to your taste, this motivated seller is ready to make a deal. Don't miss out on the potential this property has to offer!
-
2023-07-24soldstatus
-
2022-09-22soldstatus Closed 376-char remark
Show marketing remark (376 chars)
Why rent when you can own this cute 3/1 that's located in a quiet cul de sac. The owners have put so much love into maintaining this home, and it soon can be yours. Investors if you are thinking about adding another property to your portfolio, this is it. Move in ready and is ready to go for the next owner or tenant. Call your favorite Realtor to schedule a private showing.
-
2022-09-22soldstatus
Show marketing remark (376 chars)
Why rent when you can own this cute 3/1 that's located in a quiet cul de sac. The owners have put so much love into maintaining this home, and it soon can be yours. Investors if you are thinking about adding another property to your portfolio, this is it. Move in ready and is ready to go for the next owner or tenant. Call your favorite Realtor to schedule a private showing.
-
2022-07-27status Pending 376-char remark
Show marketing remark (376 chars)
Why rent when you can own this cute 3/1 that's located in a quiet cul de sac. The owners have put so much love into maintaining this home, and it soon can be yours. Investors if you are thinking about adding another property to your portfolio, this is it. Move in ready and is ready to go for the next owner or tenant. Call your favorite Realtor to schedule a private showing.
-
2022-07-21$75,000 Active 376-char remark
Show marketing remark (376 chars)
Why rent when you can own this cute 3/1 that's located in a quiet cul de sac. The owners have put so much love into maintaining this home, and it soon can be yours. Investors if you are thinking about adding another property to your portfolio, this is it. Move in ready and is ready to go for the next owner or tenant. Call your favorite Realtor to schedule a private showing.
-
2021-10-02historical
-
2021-10-02historical
-
2011-08-15$68,500
-
2010-04-30soldstatus
-
2009-11-09soldstatus
-
2009-04-21soldstatus
-
2009-01-21$24,900
-
2007-04-09$73,000
-
2006-10-13soldstatus
-
2006-10-13soldstatus
-
2006-06-08$71,000
-
1968-09-19soldstatus
ⓘ Source: listings_history table (triggers on properties + properties_extension) + one-shot
backfill from property_details.listing_events for pre-trigger history.
Tax reassessment forecast MS · Resets to sale price
- Current annual tax
- $616 · $51/mo
- Projected year-2 tax
- $691 · $58/mo
- Expected delta
- +$75/yr (+$6/mo · 12.2%)
ⓘ Screening estimate from a state-policy table — verify with the county assessor before closing.
Climate risk First Street
- Flood 1/10 Low FEMA zone X (unshaded) · 0% chance over 30 yrs
- Wildfire 1/10 Low
- Heat 7/10 Severe 7 d/yr ≥108°F today · 19 d/yr by 30 yrs out
- Wind 8/10 Severe 80% chance of damaging wind over 30 yrs
- Air quality 1/10 Low 0 unhealthy d/yr today · 0 by 30 yrs out
Nearby sold comps map
Loading sold comps map…
Walkable amenities ~0.75 mi
Loading nearby amenities…
Taxation est. · year 1
- Rental income
- $14,721
- − Mortgage interest
- −$4,901
- − Property taxes
- −$616
- − Insurance
- −$438
- − Repairs & maintenance
- −$1,178
- − Management
- −$1,178
- − Depreciation
- −$2,545
- Taxable income
- $3,865
- Est. tax owed @ 24.0%
- −$928
- After-tax cash flow
- $4,142/yr
For passive investors: Depreciation is non-cash, so a rental often shows a tax loss while cash-flowing — sheltering income. Rental losses are passive: they offset passive income freely, and up to $25,000/yr can offset ordinary (W-2) income if you actively participate and your MAGI is under $100k (phasing out to $0 by $150k); unused losses carry forward. On sale, claimed depreciation is recaptured at up to 25%, and gains may owe capital-gains tax (a 1031 exchange can defer both). Figures are a year-1 estimate at your 24.0% rate — not tax advice; consult a CPA.
Schools (NCES district)
- District
- Jackson Public School District
- NCES district ID
- 2802190
- Math proficiency
- 9% ▼ -14.00%
- Reading proficiency
- 18% ▼ -7.00%
- Median HH income
- $33,234
- Composite
- 10.89/100
- National rank
- #9755
- State rank
- #112 of 130 in MS
Livability — Jackson
- Score
- 68/100
- State rank
- #66
- US rank
- #9695
Category grades
Schools grade is shown separately in the Schools card above.
Census & demographics
- Census place
- Jackson, MS
- County
- Hinds County · 167,040 people
- City population
- 140,204
- Metro
- Jackson, MS
- Population (ZIP)
- 25,659
- Household income
- $50,722
- Rent vs Own
- Severe rent burden
- 1314.0
Population outlook (Hinds County) Hauer SSP2
- Today (2025)
- 242,528 people
- By 2030
- 241,113 · -0.6%
- By 2040
- 235,557 · -2.9%
- By 2050
- 226,946 · -6.4%
- By 2075
- 199,995 · -17.5%
- By 2100
- 164,165 · -32.3%
Race, ethnicity, and origin ACS 2023
- Neighborhood character
- Predominantly Black (86%)
- Race & ethnicity
- Black 86% White 9% Hispanic / Latino 3% Two or more races 3%
- Common ancestry
- Serbian 1% Lithuanian 1%
- Foreign-born
- 1% · Canada
- Languages at home
- 97% English-only · Spanish 2%
Political lean MEDSL · Hinds
- 2024 margin
- Solid D (+46.1) · D 72.4% · R 26.3% · Other 1.4%
- 2008→2024 swing
- +7.1pp toward D · 2008: 39.0pp · 2024: 46.1pp
- All cycles
- 2024: D+46.1 2020: D+48.3 2016: D+43.7 2012: D+45.1 2008: D+39.0
Not yet ingested
- Civics
- —
Market trends
- HPI YoY
- ▼ -23.01%
- Current HPI
- 174.4025
- Rent YoY
- ▲ 4.23%
- Metro
- Jackson, MS
- State GDP YoY
- —
- F500 in state
- 0
Price history
+26.8% since first listed18 events — show timeline
- 2026-03-18 Listed $90,000 MLSU
- 2023-07-24 Sold (Public Records) — Public Records
- 2022-09-22 Sold (Public Records) — Public Records
- 2022-09-22 Sold (MLS) — MLSU
- 2022-07-27 Pending — MLSU
- 2022-07-21 Listed $75,000 MLSU
- 2021-10-02 Listing Removed — MLSU
- 2021-10-02 Listing Removed — MLSU
- 2011-08-15 Listed $68,500 MLSU
- 2010-04-30 Sold (Public Records) — Public Records
- 2009-11-09 Sold (Public Records) — Public Records
- 2009-04-21 Sold (MLS) — MLSU
- 2009-01-21 Listed $24,900 MLSU
- 2007-04-09 Listed $73,000 MLSU
- 2006-10-13 Sold (Public Records) — Public Records
- 2006-10-13 Sold (MLS) — MLSU
- 2006-06-08 Listed $71,000 MLSU
- 1968-09-19 Sold (Public Records) — Public Records
Property tax history
+1.9%/yrLatest (2021): $616 · +0.7% YoY. Source: county tax records.
Cash-flow waterfall
monthlySold comps — $/sqft
last 12 mo · ≤1 miLoading sold comps…