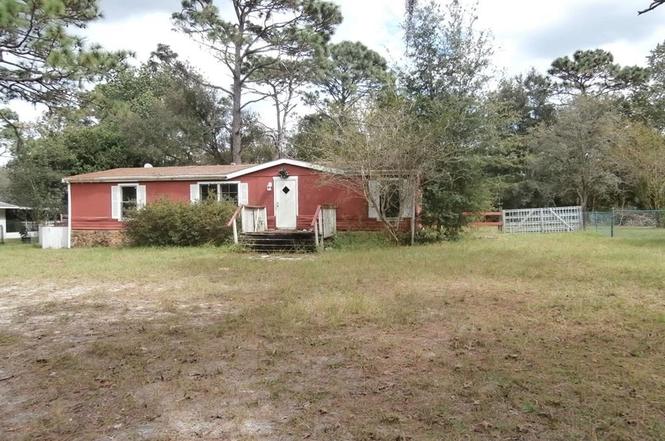
4555 S Leisure Blvd · Lecanto, FL
Flood risk 4/10 · Minor
- FEMA flood zone
- X (unshaded)
- Chance of flooding over 30 yrs
- 0.23%
- Est. flood insurance / yr
- $507 – $1,088
Fire risk 6/10 · Moderate
- Est. fire insurance / yr
- $947 – $1,759
Heat risk 10/10 · Severe
- Hot days now (above 108°F)
- 7 days/yr
- Hot days in 30 yrs
- 26 days/yr
Wind risk 9/10 · Severe
- Chance of severe wind over 30 yrs
- 99.0%
Air-quality risk 1/10 · Minimal
- Unhealthy air days now
- 0 days/yr
- Unhealthy air days in 30 yrs
- 0 days/yr
Risk factors via First Street. Map © Google.
Why this score? — see what drove the B+ grade
The composite is a weighted blend of 9 inputs, each scored 0–100. Each bar is that input's sub-score; the figure is the points it added to the 100-point composite (weight × sub-score).
- Cash flow +30.0/30.0
- ARV discount +15.0/15.0
- 1% rule +10.0/10.0
- DSCR +10.0/10.0
- Schools +4.1/10.0
- Livability +3.2/5.0
- Rent growth +2.5/5.0
- Condition / age +2.5/5.0
- Appreciation +0.0/10.0
$135,000
🖨 Deal sheet 📄 Offer letter ✓ Due diligence
Listing remarks
Under contract-accepting backup offers. Enjoy comfortable and elegant living in this spacious four-bedroom, three-bathroom home, featuring a luxurious master suite with a brand-new jacuzzi. Designed for a modern lifestyle, this property offers expansive open spaces, abundant natural light, and high-quality finishes throughout. Ideal for families or professionals seeking comfort and style, this residence combines relaxation and functionality in a prime location. Back on the Market
Key facts
- Master suite
- Open spaces
- Natural light
Tags
Property features AI
Finance
- Other: Zoning: Rural residential; Lot size approx. 0.5 acre (100 x 218); Total acreage: 1/2 to less than 1
- Financial info: Unfurnished; Association amenities: Other
- HOA & community: Community features: None; Pets allowed: Cats and dogs
Exterior
- Parking: Boat parking; Open parking; RV carport; RV garage; 2-car carport
- Security: Smoke detector(s)
- Utilities: Septic tank; No public water; Other utilities
- Home design: Manufactured home (double wide); Residential property; One story; South facing; Completed condition; Entry level: 1
- Construction: Frame construction; Shingle roof; Slab foundation; Built as a double wide; Living area approx. 1,152 (per appraiser)
- Exterior features: Patio; Paved lot; Road surface: paved
Interior
- Kitchen: Range; Refrigerator
- Bedrooms: 3 bedrooms
- Flooring: Laminate
- Bathrooms: 2 full bathrooms
- Heating & cooling: Central heating; No cooling
- Interior features: Ceiling fans; Smoke detector(s)
- Laundry & utility: Inside laundry
Neighborhood map
What this means for you Summary
Snapshot
- This is a 3-bed/2.0-bath manufactured listed at $135k.
Deal economics
- At list price, monthly cash flow is $736 ($9k/yr) — positive.
- The deal already cash-flows at list — no discount required.
- Meets the 1% rule at list price ($2k rent vs $135k).
- Recommended offer: $123k (9.0% below list) — sets the bar for market timing.
- Cap rate 12.8% vs local median 5.2% in Lecanto — top-decile yield for the area; either an underpriced asset or a hidden risk that comps aren't pricing in. Stress-test before assuming the spread holds.
Location & tenants
- Location reads 64/100 on livability (#680 in FL) — a middle-class / working-renter tenant base. Strengths: cost of living A+, housing A, crime B; Watch: health & safety C-, employment D, amenities F.
- Citrus (rural): math 49% / reading 50% proficiency, ranked #44 of 73 in FL (top 60%) — families likely to look elsewhere, expect single-tenant / working-renter base with shorter leases.
- Zoned schools: Lecanto Primary School (math 55% / reading 53%, grade C, #936 of 2,144 statewide, top 44%, 820 students, 63% FRL); Lecanto High School (math 46% / reading 53%, grade D, #179 of 667 statewide, top 29%, 1,630 students, 46% FRL) — zoned schools at 54% FRL track the district average.
- Market conditions: 197 active listings in the ZIP; 2,443 units permitted in Citrus County in 2024 (0 in 5+ unit buildings).
- This rent runs 38% of the median local income ($63k/yr) — at the standard rent-burdened threshold; future hikes will face affordability resistance.
Forward outlook
- Local home prices are declining (-3.0%/yr); year-one equity from $933 of loan paydown is wiped out by about $4k of value loss. Plan a longer hold.
- Citrus County population projected to shrink 10% by 2050 — rents likely to lag national; underwrite the cash flow, not the appreciation.
- At projected returns (-3.0% appreciation + 3.0% rent growth), your $38k cash investment doubles in ~6 years — after that, you're playing with house money.
Negotiation context
- It's been on market 97 days — a 9% lower offer ($123k) is reasonable based on typical stale-listing flexibility.
- 6 sale attempts since 5y ago with the ask held roughly flat each time — persistent listings suggest the price (not the market) is what's stuck; bring a comps-based counter.
- Current owner paid $60k; list at $135k implies a 125% gain — meaningful room to come down on a strong offer.
Risks & watch-outs
- Climate carrying-cost: severe wind risk, 99% chance of damaging wind over 30y; major wildfire risk; extreme-heat days projected 7→26/yr by 2055 (HVAC capex compounding) — expect insurance premiums to compound above CPI over the hold.
Questions for the listing agent
- It's been on market 97 days. Have you received any prior offers? Is the seller open to a 9% concession, seller financing, or rate buy-down credit?
- Why hasn't it sold? Are there any deal-killer items the seller is aware of (foundation, flood, title, zoning, code violations)?
- Is there a deadline driving the sale (1031 exchange, divorce, estate, relocation)? That informs how much negotiation room exists.
- Schools are D-rated, which usually means shorter tenancies and higher turnover. Who's the typical renter profile here, and what's been the actual vacancy rate?
- What's the average days-on-market for RENTAL listings here right now (not sales)? A rising rental-DOM trend means longer vacancies and softer asking-rent achievability than the comps imply.
- What's the recent tenant-quality profile in this submarket — average credit score on applications, eviction rate, late-payment / NSF rate, and stable-employment percentage? A property-management company in the area should have these aggregated.
- How much new for-sale + rental construction is in the pipeline within 1–3 miles? Heavy new supply typically softens prices + rents 12–24 months out; constrained supply supports both.
Investment metrics
- 1% rule
- 1.51% ✓
- Cap rate
- 12.83%
- Cash-on-cash
- 23.35%
- DSCR
- 2.04
- GRM
- 5.5
CMA / ARV
- ARV (on-the-fly)
- $170,496
- Comps found
- 1
Show comp detail 1 sale within ~0.75 mi
| Address | Dist | Beds/Ba | Sqft | Sold | Price | $/sf | Match |
|---|---|---|---|---|---|---|---|
| 4729 S Hatteray Pt | 0.52mi | 3/2.0 | 1,080 (-6%) | 6mo | $160,000 | $148 | 61 |
Match score weights: distance 35% · size 25% · config 20% · recency 20%. Top-matched comps best support the ARV.
Projected returns pro-forma
-3.0% appreciation · 3.0% rent growth · sell at horizon
- IRR
- 16.4%
- Equity multiple
- 1.66×
- Total profit
- $24,964
- Equity at exit
- $20,129
- IRR
- 25.0%
- Equity multiple
- 3.17×
- Total profit
- $82,032
- Equity at exit
- $11,672
Cash invested: $37,800 (down + closing). Projections, not guarantees.
Landlord ↔ Tenant lean methodology
- Overall (STATE)
- 87 Strongly Landlord-Friendly
- State Florida
- 87 Strongly Landlord-Friendly · R+3
- County
- — inherits STATE
- City
- — inherits STATE
ZIP-level market 34461
- Home prices YoY
- -10.2%
- Active inventory
- 197
- Price-to-rent
- 5.5×
Monthly cashflow live
- Estimated rent
- $2,034 medium interval (Pro) →
- Mortgage (P&I)
- −$708
- Tax from tax record
- −$107 /mo · $1,281/yr
- Insurance
- −$56
- HOA
- −$0
- Vacancy / Maint / Mgmt
- −$427
- Net cashflow
- $736
Break-even live
UW: 25.0% down · 7.5% · 30yr · 1.5% tax · 5.0% vac · 8.0% maint · 8.0% mgmt
Financing live
Cash to close
- Down payment
- $33,750
- Closing costs
- $4,050
- Reserves months
- —
- Total cash needed
- —
Loan-product check · same deal, 3 products live
Conventional
25% down · 7.5% · 30yr
- Down + closing
- —
- Monthly P&I
- —
- Monthly cashflow
- —
- DSCR
- —
- Eligible?
- —
Personal DTI + credit; lowest rate.
DSCR
20% down · 8.5% · 30yr
- Down + closing
- —
- Monthly P&I
- —
- Monthly cashflow
- —
- DSCR
- —
- Eligible?
- —
No personal income docs; deal must DSCR.
Hard money
10% down · 12.0% · 12mo
- Down + closing
- —
- Monthly P&I
- —
- Monthly cashflow
- —
- DSCR
- —
- Eligible?
- —
Short-term bridge; refi at stabilization.
Listing history 30 events
-
2026-06-18remarks 484-char remark
-
2026-06-18status $135,000 Pending 97 DOM
-
2026-06-18days on market $135,000 Active 97 DOM
-
2026-06-17days on market $135,000 Active 96 DOM
-
2026-06-16days on market $135,000 Active 95 DOM
-
2026-06-15days on market $135,000 Active 94 DOM
-
2026-06-14days on market $135,000 Active 92 DOM
-
2026-06-13days on market $135,000 Active 91 DOM
-
2026-06-09days on market $135,000 Active 88 DOM
-
2026-06-08days on market $135,000 Active 87 DOM
-
2026-06-03days on market $135,000 Active 82 DOM
-
2026-06-02days on market $135,000 Active 81 DOM
-
2026-06-01days on market $135,000 Active 80 DOM
-
2026-05-31days on market $135,000 Active 79 DOM
-
2026-05-30days on market $135,000 Active 78 DOM
-
2026-03-31status Active
-
2026-03-08status Pending
-
2026-02-13$135,000 Active
-
2026-01-05$135,000
-
2026-01-05historical
-
2025-12-06historical $1,500
-
2025-11-21price $1,500
-
2025-07-27$1,700
-
2022-12-31historical
-
2022-06-02$170,000 Active
-
2021-11-15soldstatus $60,000 Closed
-
2021-11-15soldstatus $60,000
-
2021-11-01status Pending
-
2021-10-11$80,000 Active
-
2005-08-16soldstatus $60,000
ⓘ Source: listings_history table (triggers on properties + properties_extension) + one-shot
backfill from property_details.listing_events for pre-trigger history.
Tax reassessment forecast FL · Resets to sale price
- Current annual tax
- $1,281 · $107/mo
- Projected year-2 tax
- $1,281 · $107/mo
- Expected delta
- $0/yr ($0/mo · 0.0%)
ⓘ Screening estimate from a state-policy table — verify with the county assessor before closing.
Climate risk First Street
- Flood 4/10 Moderate FEMA zone X (unshaded) · 23% chance over 30 yrs
- Wildfire 6/10 Major
- Heat 10/10 Extreme 7 d/yr ≥108°F today · 26 d/yr by 30 yrs out
- Wind 9/10 Extreme 99% chance of damaging wind over 30 yrs
- Air quality 1/10 Low 0 unhealthy d/yr today · 0 by 30 yrs out
Nearby sold comps map
Loading sold comps map…
Walkable amenities ~0.75 mi
Loading nearby amenities…
Taxation est. · year 1
- Rental income
- $24,403
- − Mortgage interest
- −$7,562
- − Property taxes
- −$1,281
- − Insurance
- −$675
- − Repairs & maintenance
- −$1,952
- − Management
- −$1,952
- − Depreciation
- −$3,927
- Taxable income
- $7,053
- Est. tax owed @ 24.0%
- −$1,693
- After-tax cash flow
- $7,134/yr
For passive investors: Depreciation is non-cash, so a rental often shows a tax loss while cash-flowing — sheltering income. Rental losses are passive: they offset passive income freely, and up to $25,000/yr can offset ordinary (W-2) income if you actively participate and your MAGI is under $100k (phasing out to $0 by $150k); unused losses carry forward. On sale, claimed depreciation is recaptured at up to 25%, and gains may owe capital-gains tax (a 1031 exchange can defer both). Figures are a year-1 estimate at your 24.0% rate — not tax advice; consult a CPA.
Schools (NCES district)
- District
- Citrus
- NCES district ID
- 1200270
- Math proficiency
- 49% ▼ -10.00%
- Reading proficiency
- 50% ▼ -6.00%
- Median HH income
- $38,618
- Composite
- 41.28/100
- National rank
- #3519
- State rank
- #44 of 73 in FL
Livability — Lecanto
- Score
- 64/100
- State rank
- #680
- US rank
- #14112
Category grades
Schools grade is shown separately in the Schools card above.
Census & demographics
- Census place
- Lecanto, FL
- County
- Citrus County · 111,314 people
- City population
- 13,377
- Metro
- Homosassa Springs, FL
- Population (ZIP)
- 13,377
- Household income
- $63,418
- Rent vs Own
- Severe rent burden
- 41.0
Population outlook (Citrus County) Hauer SSP2
- Today (2025)
- 138,622 people
- By 2030
- 136,886 · -1.3%
- By 2040
- 132,009 · -4.8%
- By 2050
- 125,196 · -9.7%
- By 2075
- 108,570 · -21.7%
- By 2100
- 84,454 · -39.1%
Race, ethnicity, and origin ACS 2023
- Neighborhood character
- Predominantly White (87%)
- Race & ethnicity
- White 87% Hispanic / Latino 8% Two or more races 7% Black 2%
- Hispanic origin (detail)
- Puerto Rican 3%
- Common ancestry
- Romanian 3% Lithuanian 3% Slovak 3%
- Foreign-born
- 8% · Canada, Jamaica
- Languages at home
- 95% English-only · Spanish 3%
Political lean MEDSL · Citrus
- 2024 margin
- Solid R (+45.9) · D 26.8% · R 72.6%
- 2008→2024 swing
- -29.8pp toward R · 2008: -16.1pp · 2024: -45.9pp
- All cycles
- 2024: R+45.9 2020: R+41.0 2016: R+39.7 2012: R+21.9 2008: R+16.1
Not yet ingested
- Civics
- —
Market trends
- HPI YoY
- ▼ -29.48%
- Current HPI
- 258.0866
- Rent YoY
- —
- Metro
- Homosassa Springs, FL
- State GDP YoY
- ▲ 3.28%
- F500 in state
- 36
Industry mix (Fortune 500 HQ in FL)
| Industry | F500 HQs | Revenue |
|---|---|---|
| Industrial Technology | 2 | $29B |
|
||
| Insurance | 2 | $17B |
|
||
| Retail | 1 | $60B |
|
||
| Technology Distribution | 1 | $58B |
|
||
| Homebuilding | 1 | $35B |
|
||
| Technology Manufacturing | 1 | $35B |
|
||
Price history
+125.0% since first listed15 events — show timeline
- 2026-03-31 Relisted — Stellar MLS as Distributed by MLS Grid
- 2026-03-08 Pending — Stellar MLS as Distributed by MLS Grid
- 2026-02-13 Listed $135,000 Stellar MLS as Distributed by MLS Grid
- 2026-01-05 Listing Removed — Stellar MLS as Distributed by MLS Grid
- 2026-01-05 Listed $135,000 Stellar MLS as Distributed by MLS Grid
- 2025-12-06 Rental Removed $1,500 STELLARMLS
- 2025-11-21 Price Changed $1,500 STELLARMLS
- 2025-07-27 Listed for Rent $1,700 STELLARMLS
- 2022-12-31 Listing Removed — Stellar MLS as Distributed by MLS Grid
- 2022-06-02 Listed $170,000 Stellar MLS as Distributed by MLS Grid
- 2021-11-15 Sold (Public Records) $60,000 Public Records
- 2021-11-15 Sold (MLS) $60,000 Stellar MLS as Distributed by MLS Grid
- 2021-11-01 Pending — Stellar MLS as Distributed by MLS Grid
- 2021-10-11 Listed $80,000 Stellar MLS as Distributed by MLS Grid
- 2005-08-16 Sold (Public Records) $60,000 Public Records
Property tax history
+9.3%/yrLatest (2025): $1,281 · +9.2% YoY. Source: county tax records.
Cash-flow waterfall
monthlySold comps — $/sqft
last 12 mo · ≤1 miLoading sold comps…