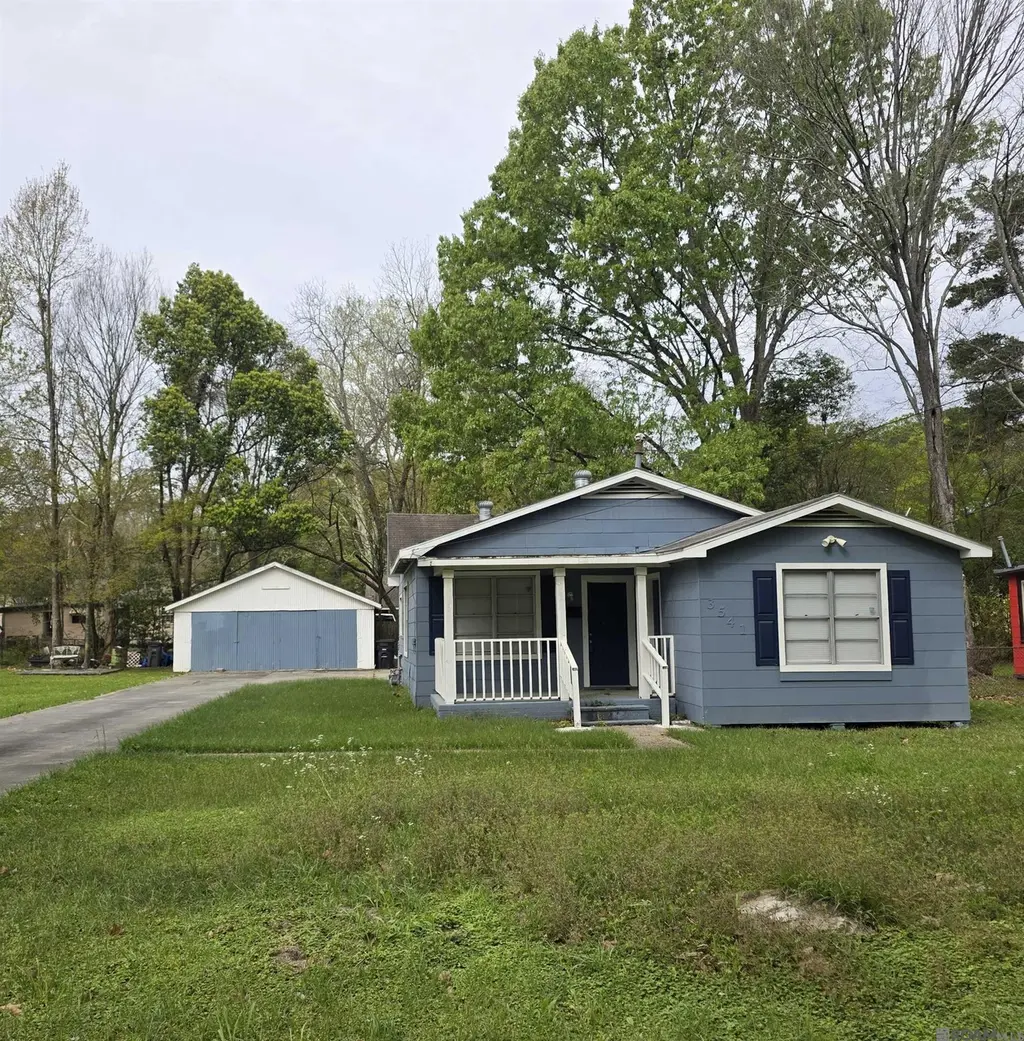
3541 Wayne Dr · Baton Rouge, LA
Flood risk 1/10 · Minimal
- FEMA flood zone
- X (unshaded)
- Chance of flooding over 30 yrs
- 0.0%
- Est. flood insurance / yr
- $507 – $1,088
Fire risk 1/10 · Minimal
- Est. fire insurance / yr
- $1,269 – $2,357
Heat risk 8/10 · Major
- Hot days now (above 108°F)
- 7 days/yr
- Hot days in 30 yrs
- 19 days/yr
Wind risk 9/10 · Severe
- Chance of severe wind over 30 yrs
- 99.0%
Air-quality risk 3/10 · Minor
- Unhealthy air days now
- 3 days/yr
- Unhealthy air days in 30 yrs
- 4 days/yr
Risk factors via First Street. Map © Google.
Why this score? — see what drove the D grade
The composite is a weighted blend of 9 inputs, each scored 0–100. Each bar is that input's sub-score; the figure is the points it added to the 100-point composite (weight × sub-score).
- Cash flow +19.8/30.0
- DSCR +6.3/10.0
- 1% rule +5.3/10.0
- Livability +3.7/5.0
- Condition / age +2.5/5.0
- ARV discount +2.4/15.0
- Schools +2.4/10.0
- Rent growth +2.2/5.0
- Appreciation +0.0/10.0
$98,900
🖨 Deal sheet 📄 Offer letter ✓ Due diligence
Listing remarks MLS
***Investor Opportunity*** This 3-bedroom, 1-bath foreclosure offers incredible potential for the savvy buyer or investor looking to add value. Situated on a large lot, this property provides plenty of space for expansion, outdoor living, or future improvements. Inside, you'll find a spacious kitchen with ample room for redesign and modernization to suit today's buyer preferences. The home also features a large shop/detached garage--perfect for storage, workshop use, or additional income possibilities. This property is ideal for a renovation project, rental investment, or flip. Conveniently located in Baton Rouge with access to local amenities, this is your chance to turn potential into profit. Don't miss out on this value-packed opportunity--schedule your showing today!
Key facts
- Spacious kitchen
- Large lot
- Large shop
Tags
Property features AI
Finance
- Other: Located in the Babin subdivision
Exterior
- Parking: 2 parking spaces
- Utilities: Public water; Public sewer
- Home design: Detached single-family residence; Residential property
- Construction: Wood siding exterior; Pillar/post/pier foundation; Built area approximately 1,232
- Exterior features: Composition roof
Interior
- Bathrooms: 1 full bathroom
- Heating & cooling: Central heating; Central air conditioning
- Interior features: Central heating; Central air conditioning
Neighborhood map
What this means for you Summary
Snapshot
- This is a 3-bed/1.0-bath single-family listed at $99k.
Deal economics
- At list price, monthly cash flow is $118 ($1k/yr) — positive.
- The deal already cash-flows at list — no discount required.
- Meets the 1% rule at list price ($1k rent vs $99k).
- Recommended offer: $96k (3.0% below list) — sets the bar for market timing.
- Cap rate 7.7% vs local median 4.3% in Baton Rouge — top-decile yield for the area; either an underpriced asset or a hidden risk that comps aren't pricing in. Stress-test before assuming the spread holds.
Location & tenants
- Location reads 74/100 on livability (#24 in LA, #4,535 nationally) — a middle-class / working-renter tenant base. Strengths: commute A+, cost of living A+, health & safety A+; Watch: amenities D, crime F, employment D-.
- East Baton Rouge Parish (urban): math 22% / reading 34% proficiency, ranked #47 of 98 in LA (top 48%) — low school quality limits family demand, transient renter base, plan for 1-2y turnover; 77% free/reduced lunch — lower-income household profile, screen leases tightly.
- Market conditions: Rents soft (-1.2%/yr); 155 active listings in the ZIP; 22 comparable units currently listed for rent nearby; rentals at typical pace (median 24d on market — plan ~3-4 weeks tenant-placement turnaround); lower-income renter base — watch delinquency; 2,252 units permitted in East Baton Rouge Parish in 2024 (440 in 5+ unit buildings).
- At $1,017/mo this rent would consume 48% of the median local household income ($25k/yr) (locally 1980% of renters already pay >50% of income on rent) — very limited rent-growth headroom before tenants either downsize or default.
Forward outlook
- Local home prices are declining (-3.0%/yr); year-one equity from $684 of loan paydown is wiped out by about $3k of value loss. Plan a longer hold.
- East Baton Rouge County population projected at +4% by 2050 — modest demand growth; plan on rents tracking national, not racing it.
Negotiation context
- It's been on market 46 days — a 3% lower offer ($96k) is reasonable based on typical stale-listing flexibility.
- 12 sale attempts since 20y ago with the ask held roughly flat each time — persistent listings suggest the price (not the market) is what's stuck; bring a comps-based counter.
Risks & watch-outs
- Climate carrying-cost: severe wind risk, 99% chance of damaging wind over 30y; extreme-heat days projected 7→19/yr by 2055 (HVAC capex compounding) — expect insurance premiums to compound above CPI over the hold.
Questions for the listing agent
- It's been on market 46 days. Have you received any prior offers? Is the seller open to a 3% concession, seller financing, or rate buy-down credit?
- Built in 1978 — when were the roof, HVAC, electrical panel, plumbing, and water heater last replaced?
- Is there a deadline driving the sale (1031 exchange, divorce, estate, relocation)? That informs how much negotiation room exists.
- Crime grade is F in this area — have there been break-ins, vandalism, or insurance claims at this property in the last 3 years? What carrier currently insures it and at what premium?
- The area grade is low — what's the realistic commute time and amenity access for the typical tenant pool here? Any planned neighborhood developments (good or bad) we should know about?
- What's the average days-on-market for RENTAL listings here right now (not sales)? A rising rental-DOM trend means longer vacancies and softer asking-rent achievability than the comps imply.
- What's the recent tenant-quality profile in this submarket — average credit score on applications, eviction rate, late-payment / NSF rate, and stable-employment percentage? A property-management company in the area should have these aggregated.
- How much new for-sale + rental construction is in the pipeline within 1–3 miles? Heavy new supply typically softens prices + rents 12–24 months out; constrained supply supports both.
Investment metrics
- 1% rule
- 1.03% ✓
- Cap rate
- 7.73%
- Cash-on-cash
- 5.12%
- DSCR
- 1.23
- GRM
- 8.1
CMA / ARV
- ARV (median comp)
- $88,769
- List price
- $98,900
- Delta
- 11.41%
- Verdict
- OVERPRICED
- Comps
- 20 within 1.0 mi
Show comp detail 12 sales within ~0.75 mi
| Address | Dist | Beds/Ba | Sqft | Sold | Price | $/sf | Match |
|---|---|---|---|---|---|---|---|
| 3815 Webb Dr | 0.20mi | 3/1.0 | 1,190 (-3%) | 4mo | $10,000 | $8 | 82 |
| 3765 Webb Dr | 0.19mi | 4/2.0 (+1) | 1,190 (-3%) | 1mo | $120,000 | $101 | 76 |
| 3536 Beechwood Dr | 0.33mi | 3/1.5 | 1,288 (+4%) | 2mo | $77,500 | $60 | 73 |
| 3335 N 38th St | 0.35mi | 3/1.0 | 1,275 (+4%) | 6mo | $55,000 | $43 | 73 |
| 3430 Oswego St | 0.44mi | 2/1.0 (-1) | 1,180 (-4%) | 0mo | $95,900 | $81 | 67 |
| 3691 Dalton St | 0.56mi | 4/1.0 (+1) | 1,225 (-1%) | 10mo | $52,500 | $43 | 60 |
| 4236 Delaware St | 0.53mi | 3/2.0 | 1,200 (-3%) | 9mo | $79,500 | $66 | 60 |
| 4126 Prescott Ct | 0.69mi | 3/1.0 | 1,300 (+6%) | 5mo | $135,000 | $104 | 54 |
| 3620 Clayton Dr | 0.74mi | 2/1.0 (-1) | 1,289 (+5%) | 0mo | $55,000 | $43 | 52 |
| 3017 Winbourne Ave | 0.72mi | 3/2.0 | 1,307 (+6%) | 9mo | $19,900 | $15 | 45 |
| 5124 Jean St | 0.58mi | 2/1.0 (-1) | 1,100 (-11%) | 12mo | $45,000 | $41 | 40 |
| 4710 Osborne Ave | 0.64mi | 4/1.0 (+1) | 1,391 (+13%) | 6mo | $49,900 | $36 | 38 |
Match score weights: distance 35% · size 25% · config 20% · recency 20%. Top-matched comps best support the ARV.
Projected returns pro-forma
-3.0% appreciation · 0.0% rent growth · sell at horizon
- IRR
- -11.8%
- Equity multiple
- 0.59×
- Total profit
- $-11,467
- Equity at exit
- $14,746
- IRR
- -7.8%
- Equity multiple
- 0.58×
- Total profit
- $-11,748
- Equity at exit
- $8,551
Cash invested: $27,692 (down + closing). Projections, not guarantees.
Landlord ↔ Tenant lean methodology
- Overall (STATE)
- 90 Strongly Landlord-Friendly
- State Louisiana
- 90 Strongly Landlord-Friendly · R+12
- County
- — inherits STATE
- City
- — inherits STATE
ZIP-level market 70805
- Rents YoY
- -1.2%
- Active inventory
- 155
- Price-to-rent
- 8.1×
Monthly cashflow live
- Estimated rent
- $1,017 high interval (Pro) →
- Mortgage (P&I)
- −$519
- Tax from tax record
- −$125 /mo · $1,503/yr
- Insurance
- −$41
- HOA
- −$0
- Vacancy / Maint / Mgmt
- −$214
- Net cashflow
- $118
Break-even live
UW: 25.0% down · 7.5% · 30yr · 1.5% tax · 5.0% vac · 8.0% maint · 8.0% mgmt
Financing live
Cash to close
- Down payment
- $24,725
- Closing costs
- $2,967
- Reserves months
- —
- Total cash needed
- —
Loan-product check · same deal, 3 products live
Conventional
25% down · 7.5% · 30yr
- Down + closing
- —
- Monthly P&I
- —
- Monthly cashflow
- —
- DSCR
- —
- Eligible?
- —
Personal DTI + credit; lowest rate.
DSCR
20% down · 8.5% · 30yr
- Down + closing
- —
- Monthly P&I
- —
- Monthly cashflow
- —
- DSCR
- —
- Eligible?
- —
No personal income docs; deal must DSCR.
Hard money
10% down · 12.0% · 12mo
- Down + closing
- —
- Monthly P&I
- —
- Monthly cashflow
- —
- DSCR
- —
- Eligible?
- —
Short-term bridge; refi at stabilization.
Rent comps 22 comps
| Address | Beds | Baths | Sqft | Rent | $/sqft | DOM | Units | Dist |
|---|---|---|---|---|---|---|---|---|
| 3577 Mission Dr Baton Rouge, LA | 2.0 | 1.0 | 755 | $950 | $1.26 | 19d | 1 | 0.15mi |
| 3647 Mission Dr Baton Rouge, LA | 3.0 | 1.0 | 900 | $895 | $0.99 | 23d | 1 | 0.17mi |
| 3567 Charles St Baton Rouge, LA | 3.0 | 1.0 | 1400 | $1,250 | $0.89 | 43d | 1 | 0.36mi |
| 4380 Mohican-Prescott Crossover Baton Rouge, LA | 2.0 | 2.0 | 910 | $1,055 | $1.16 | 43d | 1 | 0.39mi |
| 3540 N Foster Dr Baton Rouge, LA | 2.0 | 1.0 | 1000 | $1,000 | $1.00 | 23d | 1 | 0.45mi |
| 3859 Brady St Baton Rouge, LA | 2.0 | 1.0 | 800 | $775 | $0.97 | 43d | 1 | 0.46mi |
| 3936 Dalton St Baton Rouge, LA | 2.0 | 1.0 | 900 | $750 | $0.83 | 19d | 1 | 0.51mi |
| 3160 Wyandotte St Baton Rouge, LA | 2.0 | 1.0 | 1100 | $800 | $0.73 | 43d | 1 | 0.60mi |
| 2347 Rhodes Ave Baton Rouge, LA | 2.0 | 1.0 | 1250 | $950 | $0.76 | 19d | 1 | 0.81mi |
| 2852 Dayton St Baton Rouge, LA | 2.0 | 1.0 | 1020 | $850 | $0.83 | 23d | 1 | 0.92mi |
| 2606 Weller Ave Baton Rouge, LA | 2.0 | 1.0 | 1000 | $650 | $0.65 | 43d | 1 | 0.96mi |
| 5617 Prescott Rd Baton Rouge, LA | 1.0–2.0 | 1.0 | 687 | $900 | $1.31 | 23d | 26 | 0.98mi |
| 5350 Clayton Dr Baton Rouge, LA | 3.0 | 1.0 | 1050 | $850 | $0.81 | 43d | 1 | 0.98mi |
| 4189 W Brookstown Dr Baton Rouge, LA | 1.0–2.0 | 1.0 | 695 | $825 | $1.19 | 14d | 20 | 1.01mi |
| 5540 Clayton Ct Baton Rouge, LA | 4.0 | 2.0 | 1500 | $1,350 | $0.90 | 19d | 1 | 1.05mi |
| 5212 Jackson Ave Baton Rouge, LA | 4.0 | 2.0 | 1500 | $1,650 | $1.10 | 23d | 1 | 1.18mi |
| 5423 Banyan Trace Dr Baton Rouge, LA | 4.0 | 2.0 | 1469 | $1,300 | $0.88 | 23d | 1 | 1.34mi |
| 5315 McClelland Dr Baton Rouge, LA | 3.0 | 2.0 | 1369 | $1,000 | $0.73 | 23d | 1 | 1.39mi |
| 1348 N 37th St Baton Rouge, LA | 3.0 | 1.0 | 1100 | $1,200 | $1.09 | 43d | 1 | 1.41mi |
| 5553 Banyan Ct Baton Rouge, LA | 4.0 | 2.0 | 1459 | $1,350 | $0.93 | 23d | 1 | 1.42mi |
| 1409 N 35th St Baton Rouge, LA | 3.0 | 2.0 | 912 | $750 | $0.82 | 23d | 1 | 1.42mi |
| 1217 N 44th St Baton Rouge, LA | 3.0 | 2.0 | 1028 | $950 | $0.92 | 23d | 1 | 1.48mi |
Listing history 37 events
-
2026-06-18days on market $98,900 Active 46 DOM
-
2026-06-17days on market $98,900 Active 45 DOM
-
2026-06-16days on market $98,900 Active 44 DOM
-
2026-06-15days on market $98,900 Active 43 DOM
-
2026-06-14days on market $98,900 Active 41 DOM
-
2026-06-10days on market $98,900 Active 38 DOM
-
2026-06-09days on market $98,900 Active 37 DOM
-
2026-06-08days on market $98,900 Active 36 DOM
-
2026-06-07days on market $98,900 Active 35 DOM
-
2026-06-05days on market $98,900 Active 32 DOM
-
2026-06-03days on market $98,900 Active 31 DOM
-
2026-06-02days on market $98,900 Active 30 DOM
-
2026-06-01days on market $98,900 Active 29 DOM
-
2026-05-31days on market $98,900 Active 28 DOM
-
2026-05-31days on market $98,900 Active 27 DOM
-
2026-05-01$98,900 Active 820-char remark
Show marketing remark (781 chars)
***Investor Opportunity*** This 3-bedroom, 1-bath foreclosure offers incredible potential for the savvy buyer or investor looking to add value. Situated on a large lot, this property provides plenty of space for expansion, outdoor living, or future improvements. Inside, you'll find a spacious kitchen with ample room for redesign and modernization to suit today's buyer preferences. The home also features a large shop/detached garage--perfect for storage, workshop use, or additional income possibilities. This property is ideal for a renovation project, rental investment, or flip. Conveniently located in Baton Rouge with access to local amenities, this is your chance to turn potential into profit. Don't miss out on this value-packed opportunity--schedule your showing today!
-
2026-05-01$98,900 Active 781-char remark
Show marketing remark (781 chars)
***Investor Opportunity*** This 3-bedroom, 1-bath foreclosure offers incredible potential for the savvy buyer or investor looking to add value. Situated on a large lot, this property provides plenty of space for expansion, outdoor living, or future improvements. Inside, you'll find a spacious kitchen with ample room for redesign and modernization to suit today's buyer preferences. The home also features a large shop/detached garage--perfect for storage, workshop use, or additional income possibilities. This property is ideal for a renovation project, rental investment, or flip. Conveniently located in Baton Rouge with access to local amenities, this is your chance to turn potential into profit. Don't miss out on this value-packed opportunity--schedule your showing today!
-
2025-10-30$109,900 Active
-
2025-10-30$109,900 Active
-
2022-12-07soldstatus $129,000
-
2022-12-06soldstatus Sold
-
2022-09-17historical
-
2022-09-07price $129,000
-
2022-08-23price $145,000
-
2022-07-23$149,999 Active
-
2022-07-23$129,000
-
2011-12-01soldstatus $40,000
-
2011-04-15soldstatus
-
2010-12-24$29,900
-
2010-12-24$29,900
-
2008-11-04$51,500
-
2008-11-04$51,500
-
2008-10-09soldstatus $76,309
-
2007-03-05soldstatus $77,000
-
2007-02-27soldstatus
-
2006-10-23$74,000
-
2006-10-23$74,000
ⓘ Source: listings_history table (triggers on properties + properties_extension) + one-shot
backfill from property_details.listing_events for pre-trigger history.
Tax reassessment forecast LA · Resets to sale price
- Current annual tax
- $1,503 · $125/mo
- Projected year-2 tax
- $1,503 · $125/mo
- Expected delta
- $0/yr ($0/mo · 0.0%)
ⓘ Screening estimate from a state-policy table — verify with the county assessor before closing.
Climate risk First Street
- Flood 1/10 Low FEMA zone X (unshaded) · 0% chance over 30 yrs
- Wildfire 1/10 Low
- Heat 8/10 Severe 7 d/yr ≥108°F today · 19 d/yr by 30 yrs out
- Wind 9/10 Extreme 99% chance of damaging wind over 30 yrs
- Air quality 3/10 Moderate 3 unhealthy d/yr today · 4 by 30 yrs out
Nearby sold comps map
Loading sold comps map…
Walkable amenities ~0.75 mi
Loading nearby amenities…
Taxation est. · year 1
- Rental income
- $12,201
- − Mortgage interest
- −$5,540
- − Property taxes
- −$1,503
- − Insurance
- −$494
- − Repairs & maintenance
- −$976
- − Management
- −$976
- − Depreciation
- −$2,877
- Taxable loss
- −$166
- Est. tax savings @ 24.0%
- +$40
- After-tax cash flow
- $1,457/yr
For passive investors: Depreciation is non-cash, so a rental often shows a tax loss while cash-flowing — sheltering income. Rental losses are passive: they offset passive income freely, and up to $25,000/yr can offset ordinary (W-2) income if you actively participate and your MAGI is under $100k (phasing out to $0 by $150k); unused losses carry forward. On sale, claimed depreciation is recaptured at up to 25%, and gains may owe capital-gains tax (a 1031 exchange can defer both). Figures are a year-1 estimate at your 24.0% rate — not tax advice; consult a CPA.
Schools (NCES district)
- District
- East Baton Rouge Parish
- NCES district ID
- 2200540
- Math proficiency
- 22% ▼ -36.00%
- Reading proficiency
- 34% ▼ -31.00%
- Median HH income
- $46,263
- Composite
- 24.14/100
- National rank
- #7745
- State rank
- #47 of 98 in LA
Livability — Baton Rouge
- Score
- 74/100
- State rank
- #24
- US rank
- #4535
Category grades
Schools grade is shown separately in the Schools card above.
Census & demographics
- Census place
- Baton Rouge, LA
- County
- East Baton Rouge Parish · 399,686 people
- City population
- 351,868
- Metro
- Baton Rouge, LA
- Population (ZIP)
- 23,288
- Household income
- $25,397
- Rent vs Own
- Severe rent burden
- 1980.0
Population outlook (East Baton Rouge County) Hauer SSP2
- Today (2025)
- 464,810 people
- By 2030
- 472,137 · +1.6%
- By 2040
- 480,243 · +3.3%
- By 2050
- 484,422 · +4.2%
- By 2075
- 492,069 · +5.9%
- By 2100
- 476,347 · +2.5%
Race, ethnicity, and origin ACS 2023
- Neighborhood character
- Predominantly Black (95%)
- Race & ethnicity
- Black 95% Hispanic / Latino 2% White 2% Two or more races 1%
- Common ancestry
- Lithuanian 1%
- Foreign-born
- 1% · Canada
- Languages at home
- 98% English-only · Spanish 1%
Political lean MEDSL · East Baton Rouge
- 2024 margin
- D (+11.1) · D 54.5% · R 43.4% · Other 2.1%
- 2008→2024 swing
- +8.9pp toward D · 2008: 2.2pp · 2024: 11.1pp
- All cycles
- 2024: D+11.1 2020: D+13.1 2016: D+9.2 2012: D+5.2 2008: D+2.2
Not yet ingested
- Civics
- —
Market trends
- HPI YoY
- ▼ -110.79%
- Current HPI
- 75.7121
- Rent YoY
- ▼ -1.21%
- Metro
- Baton Rouge, LA
- State GDP YoY
- ▲ 3.29%
- F500 in state
- 10
Industry mix (Fortune 500 HQ in LA)
| Industry | F500 HQs | Revenue |
|---|---|---|
| Telecommunications | 2 | $23B |
|
||
| Utilities | 1 | $12B |
|
||
| Wholesale / Distribution | 1 | $5B |
|
||
| Advertising | 1 | $2B |
|
||
Price history
+33.6% since first listed22 events — show timeline
- 2026-05-01 Listed $98,900 AcadianaMLS
- 2026-05-01 Listed $98,900 GBRMLS
- 2025-10-30 Listed $109,900 GBRMLS
- 2025-10-30 Listed $109,900 AcadianaMLS
- 2022-12-07 Sold (Public Records) $129,000 Public Records
- 2022-12-06 Sold (MLS) — GBRMLS
- 2022-09-17 Delisted — GBRMLS
- 2022-09-07 Price Changed $129,000 GBRMLS
- 2022-08-23 Price Changed $145,000 GBRMLS
- 2022-07-23 Listed $129,000 AcadianaMLS
- 2022-07-23 Listed $149,999 GBRMLS
- 2011-12-01 Sold (Public Records) $40,000 Public Records
- 2011-04-15 Sold (MLS) — GBRMLS
- 2010-12-24 Listed $29,900 AcadianaMLS
- 2010-12-24 Listed $29,900 GBRMLS
- 2008-11-04 Listed $51,500 AcadianaMLS
- 2008-11-04 Listed $51,500 GBRMLS
- 2008-10-09 Sold (Public Records) $76,309 Public Records
- 2007-03-05 Sold (Public Records) $77,000 Public Records
- 2007-02-27 Sold (MLS) — GBRMLS
- 2006-10-23 Listed $74,000 GBRMLS
- 2006-10-23 Listed $74,000 AcadianaMLS
Property tax history
+39.7%/yrLatest (2025): $1,503 · +4.7% YoY. Source: county tax records.
Cash-flow waterfall
monthlySold comps — $/sqft
last 12 mo · ≤1 miLoading sold comps…