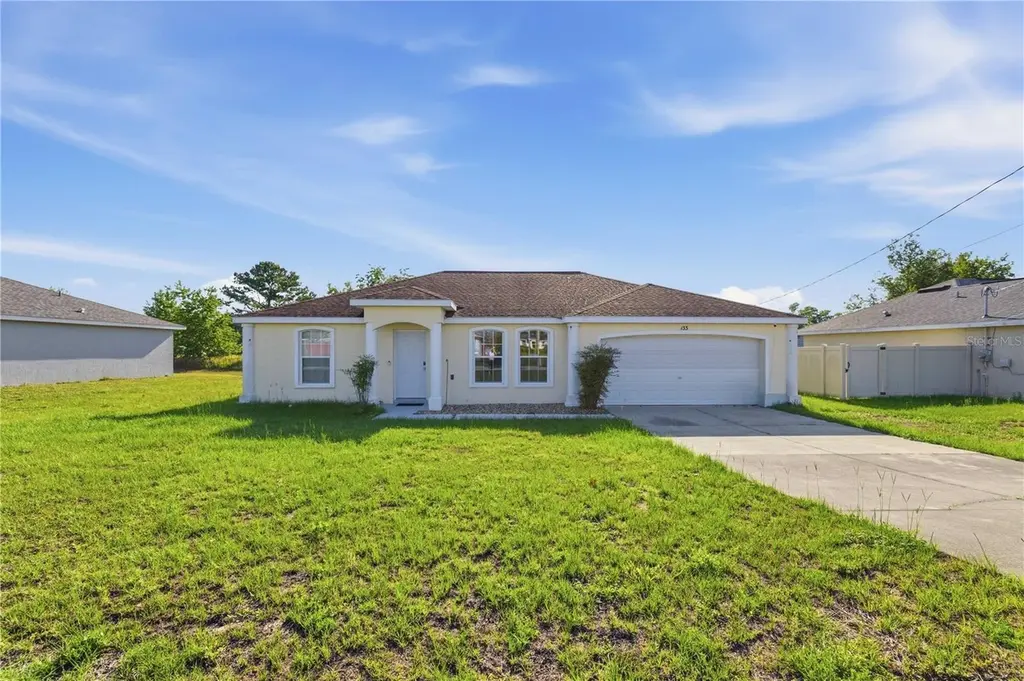
133 Juniper Loop Cir · Silver Springs Shores, FL
Flood risk 4/10 · Minor
- FEMA flood zone
- X (unshaded)
- Chance of flooding over 30 yrs
- 0.24%
- Est. flood insurance / yr
- $507 – $1,088
Fire risk 5/10 · Moderate
- Est. fire insurance / yr
- $947 – $1,759
Heat risk 9/10 · Severe
- Hot days now (above 108°F)
- 7 days/yr
- Hot days in 30 yrs
- 23 days/yr
Wind risk 9/10 · Severe
- Chance of severe wind over 30 yrs
- 99.0%
Air-quality risk 3/10 · Minor
- Unhealthy air days now
- 3 days/yr
- Unhealthy air days in 30 yrs
- 4 days/yr
Risk factors via First Street. Map © Google.
Why this score? — see what drove the D+ grade
The composite is a weighted blend of 9 inputs, each scored 0–100. Each bar is that input's sub-score; the figure is the points it added to the 100-point composite (weight × sub-score).
- ARV discount +15.0/15.0
- Cash flow +13.5/30.0
- DSCR +4.1/10.0
- Schools +3.6/10.0
- Livability +3.4/5.0
- 1% rule +3.3/10.0
- Rent growth +3.2/5.0
- Condition / age +2.5/5.0
- Appreciation +0.0/10.0
$195,000
🖨 Deal sheet (PDF) 📄 Offer letter ✓ Due diligence
Listing remarks MLS
Lovely 3/2/2 in Silver Springs Shores! House has been freshly painted inside and has new appliances. Home was built in 2007 and has 1,317 square feet. Kitchen and baths are tiled and rest of house has new carpet. Kitchen is wide open to the living room which has vaulted ceilings. Kitchen has new sink and faucet. All doors have been freshly painted and have new doorknobs. Garage has also been freshly painted. Great for first-time home buyers or rental opportunity! Broker/owner. Sold AS IS with right to inspect.
Key facts
- 0.23 acre lot
- 2 garage spots
- Built 2007
Property features AI
Finance
- Other: Zoning: R1; Property type: Residential - Single Family Residence; Total rooms: 4; Living area (public records): 1,317; Building area (owner): 1,826; Direction faces: South; Number of wells: 1; Number of septics: 1
- HOA & community: No association
Exterior
- Parking: Attached 2-car garage
- Utilities: Well water; Septic tank; Cable connected; Electricity connected; Water available
- Home design: Single family residence; One story; Faces south; Homesteaded
- Construction: Block construction; Shingle roof; Slab foundation; Built on a 0.23-acre lot (approx. 80 x 125)
- Exterior features: Exterior lighting; Asphalt road access
Interior
- Kitchen: Microwave; Range; Refrigerator
- Bedrooms: 3 bedrooms
- Flooring: Carpet
- Bathrooms: 2 full bathrooms
- Heating & cooling: Electric heating; Central air conditioning
- Interior features: Cathedral ceilings; Open floorplan; Living room/dining room combo
- Laundry & utility: Laundry area located in the garage
Neighborhood map
What this means for you Summary
Snapshot
- This is a 3-bed/2.0-bath single-family listed at $195k.
Deal economics
- At list price, monthly cash flow is $8 ($96/yr) — positive.
- The deal already cash-flows at list — no discount required.
- To meet the 1% rule (rent ≥ 1% of price), the offer needs to be $161k (17.3% below list).
- Recommended offer: $161k (17.3% below list) — sets the bar for 1% rule.
- Cap rate 6.3% vs local median 4.8% in Silver Springs Shores — top-decile yield for the area; either an underpriced asset or a hidden risk that comps aren't pricing in. Stress-test before assuming the spread holds.
Location & tenants
- Location reads 68/100 on livability (#527 in FL) — a middle-class / working-renter tenant base. Strengths: cost of living A+, housing A+, health & safety A-; Watch: crime C-, employment D, amenities F.
- Marion (rural): math 42% / reading 43% proficiency, ranked #61 of 73 in FL (top 84%) — families likely to look elsewhere, expect single-tenant / working-renter base with shorter leases; 61% free/reduced lunch — lower-income household profile, screen leases tightly.
- Zoned schools: Legacy Elementary School (math 35% / reading 35%, grade F, #1,697 of 2,144 statewide, top 80%, 716 students, 72% FRL); Belleview Middle School (math 49% / reading 50%, grade C, #259 of 571 statewide, top 46%, 1,573 students, 60% FRL); Forest High School (math 36% / reading 54%, grade D-, #228 of 667 statewide, top 35%, 2,325 students, 42% FRL) — zoned schools at 58% FRL track the district average.
- Market conditions: Rents rising (+2.8%/yr); 350 active listings in the ZIP; 28 comparable units currently listed for rent nearby; rentals at typical pace (median 23d on market — plan ~3-4 weeks tenant-placement turnaround); solid renter incomes; 7,071 units permitted in Marion County in 2024 (534 in 5+ unit buildings).
Forward outlook
- Local home prices are declining (-3.0%/yr); year-one equity from $1k of loan paydown is wiped out by about $6k of value loss. Plan a longer hold.
- Marion County population projected at +13% by 2050 — modest demand growth; plan on rents tracking national, not racing it.
Negotiation context
- Only 14 days on market — expect competitive offers; lowballing is unlikely to land.
- 5 sale attempts since 14y ago with the ask held roughly flat each time — persistent listings suggest the price (not the market) is what's stuck; bring a comps-based counter.
- Current owner paid $135k; 44% above their basis — modest negotiation headroom, anchor on the comps not their cost.
Risks & watch-outs
- Climate carrying-cost: severe wind risk, 99% chance of damaging wind over 30y; moderate wildfire risk; extreme-heat days projected 7→23/yr by 2055 (HVAC capex compounding) — expect insurance premiums to compound above CPI over the hold.
Questions for the listing agent
- Is there a deadline driving the sale (1031 exchange, divorce, estate, relocation)? That informs how much negotiation room exists.
- Schools are F-rated, which usually means shorter tenancies and higher turnover. Who's the typical renter profile here, and what's been the actual vacancy rate?
- The area grade is low — what's the realistic commute time and amenity access for the typical tenant pool here? Any planned neighborhood developments (good or bad) we should know about?
- What's the average days-on-market for RENTAL listings here right now (not sales)? A rising rental-DOM trend means longer vacancies and softer asking-rent achievability than the comps imply.
- What's the recent tenant-quality profile in this submarket — average credit score on applications, eviction rate, late-payment / NSF rate, and stable-employment percentage? A property-management company in the area should have these aggregated.
- How much new for-sale + rental construction is in the pipeline within 1–3 miles? Heavy new supply typically softens prices + rents 12–24 months out; constrained supply supports both.
Investment metrics
- 1% rule
- 0.83% ✗
- Cap rate
- 6.34%
- Cash-on-cash
- 0.18%
- DSCR
- 1.01
- GRM
- 10.1
CMA / ARV
- ARV (on-the-fly)
- $250,230
- Comps found
- 12
Show comp detail 12 sales within ~0.75 mi
| Address | Dist | Beds/Ba | Sqft | Sold | Price | $/sf | Match |
|---|---|---|---|---|---|---|---|
| 116 Juniper Way | 0.09mi | 3/2.0 | 1,398 (+6%) | 2mo | $235,000 | $168 | 84 |
| 115 Juniper Run | 0.18mi | 3/2.0 | 1,399 (+6%) | 13mo | $248,250 | $177 | 71 |
| 7 Larch Dr | 0.42mi | 3/2.0 | 1,296 (-2%) | 12mo | $285,000 | $220 | 68 |
| 21 Juniper Loop Cir | 0.09mi | 3/2.0 | 1,450 (+10%) | 14mo | $275,000 | $190 | 67 |
| 27 Juniper Dr | 0.52mi | 3/2.0 | 1,284 (-2%) | 12mo | $249,900 | $195 | 61 |
| 74 Walnut Pl | 0.21mi | 3/2.0 | 1,138 (-14%) | 8mo | $229,900 | $202 | 61 |
| 156 Juniper Cir | 0.47mi | 3/2.0 | 1,439 (+9%) | 2mo | $270,000 | $188 | 61 |
| 21 Walnut Crse | 0.20mi | 3/2.0 | 1,510 (+15%) | 10mo | $275,000 | $182 | 58 |
| 44 Walnut Dr | 0.52mi | 3/2.0 | 1,453 (+10%) | 4mo | $280,400 | $193 | 55 |
| 23 Juniper Drive Ct | 0.50mi | 3/2.0 | 1,413 (+7%) | 12mo | $240,000 | $170 | 55 |
| 7777 SE 41st Ct | 0.73mi | 3/2.0 | 1,248 (-5%) | 4mo | $307,000 | $246 | 54 |
| 55 Laurel Dr | 0.65mi | 3/2.0 | 1,500 (+14%) | 4mo | $285,000 | $190 | 43 |
Match score weights: distance 35% · size 25% · config 20% · recency 20%. Top-matched comps best support the ARV.
Projected returns pro-forma
-3.0% appreciation · 2.84% rent growth · sell at horizon
- IRR
- -16.2%
- Equity multiple
- 0.43×
- Total profit
- $-31,376
- Equity at exit
- $29,075
- IRR
- -8.2%
- Equity multiple
- 0.49×
- Total profit
- $-27,833
- Equity at exit
- $16,860
Cash invested: $54,600 (down + closing). Projections, not guarantees.
Landlord ↔ Tenant lean methodology
- Overall (STATE)
- 87 Strongly Landlord-Friendly
- State Florida
- 87 Strongly Landlord-Friendly · R+3
- County
- — inherits STATE
- City
- — inherits STATE
ZIP-level market 34480
- Home prices YoY
- -28.7%
- Rents YoY
- 2.8%
- Active inventory
- 350
- Price-to-rent
- 10.1×
Monthly cashflow live
- Estimated rent
- $1,612 high interval (Pro) →
- Mortgage (P&I)
- −$1,023
- Tax from tax record
- −$162 /mo · $1,939/yr
- Insurance
- −$81
- HOA
- −$0
- Vacancy / Maint / Mgmt
- −$339
- Net cashflow
- $8
Break-even live
Sensitivity live
| Price | -10% $118 | -5% $63 | +0% $8 | +5% $-47 | +10% $-102 |
|---|---|---|---|---|---|
| Rent | -10% $-119 | -5% $-56 | +0% $8 | +5% $72 | +10% $135 |
| Rate | -1.0pp $106 | -0.5pp $58 | base $8 | +0.5pp $-43 | +1.0pp $-94 |
UW: 25.0% down · 7.5% · 30yr · 1.5% tax · 5.0% vac · 8.0% maint · 8.0% mgmt
Financing live
Cash to close
- Down payment
- $48,750
- Closing costs
- $5,850
- Reserves months
- —
- Total cash needed
- —
Loan-product check · same deal, 3 products live
Conventional
25% down · 7.5% · 30yr
- Down + closing
- —
- Monthly P&I
- —
- Monthly cashflow
- —
- DSCR
- —
- Eligible?
- —
Personal DTI + credit; lowest rate.
DSCR
20% down · 8.5% · 30yr
- Down + closing
- —
- Monthly P&I
- —
- Monthly cashflow
- —
- DSCR
- —
- Eligible?
- —
No personal income docs; deal must DSCR.
Hard money
10% down · 12.0% · 12mo
- Down + closing
- —
- Monthly P&I
- —
- Monthly cashflow
- —
- DSCR
- —
- Eligible?
- —
Short-term bridge; refi at stabilization.
Rent comps 28 comps
| Address | Beds | Baths | Sqft | Rent | $/sqft | DOM | Units | Dist |
|---|---|---|---|---|---|---|---|---|
| 123 Juniper Loop Ocala, FL | 3.0 | 2.0 | 1445 | $1,695 | $1.17 | 23d | 1 | 0.28mi |
| 31 Walnut Run Ocala, FL | 2.0 | 2.0 | 974 | $1,200 | $1.23 | 15d | 1 | 0.39mi |
| 60 Walnut Rd Ocala, FL | 2.0 | 2.0 | 969 | $1,200 | $1.24 | 23d | 1 | 0.44mi |
| 52 Walnut Rd Ocala, FL | 2.0 | 2.0 | 969 | $1,175 | $1.21 | 15d | 1 | 0.47mi |
| 47 Walnut Run Ocala, FL | 2.0 | 2.0 | 974 | $1,235 | $1.27 | 15d | 1 | 0.50mi |
| 50 Walnut Run Ocala, FL | 3.0 | 2.0 | 1287 | $1,795 | $1.39 | 15d | 1 | 0.51mi |
| 11 Aspen Dr Ocala, FL | 3.0 | 2.0 | 1357 | $1,725 | $1.27 | 23d | 1 | 0.53mi |
| 28 Juniper Dr Ocala, FL | 3.0 | 2.0 | 1453 | $1,650 | $1.14 | 23d | 1 | 0.56mi |
| 28 Poplar Run Ocala, FL | 3.0 | 2.0 | 1473 | $1,650 | $1.12 | 15d | 1 | 0.58mi |
| 23 Aspen Dr Ocala, FL | 3.0 | 2.0 | 1399 | $1,650 | $1.18 | 23d | 1 | 0.60mi |
| 66 Laurel Pass Ocala, FL | 2.0 | 2.0 | 974 | $1,175 | $1.21 | 23d | 1 | 0.64mi |
| 58 Laurel Pass Ocala, FL | 2.0 | 2.0 | 1000 | $1,200 | $1.20 | 23d | 1 | 0.66mi |
| 57 Juniper Pass Ocala, FL | 2.0 | 2.0 | 974 | $1,200 | $1.23 | 15d | 1 | 0.67mi |
| 54 Laurel Pass Ocala, FL | 2.0 | 2.0 | 1000 | $1,200 | $1.20 | 23d | 1 | 0.67mi |
| 15 Juniper Pass Ln Ocala, FL | 4.0 | 2.0 | 1608 | $1,900 | $1.18 | 15d | 1 | 0.81mi |
| 10 Juniper Trl Ocala, FL | 4.0 | 2.0 | 1617 | $1,875 | $1.16 | 15d | 1 | 0.87mi |
| 7 Juniper Pass Way Ocala, FL | 3.0 | 2.0 | 1453 | $1,750 | $1.20 | 23d | 1 | 0.91mi |
| 18 Juniper Trl Ocala, FL | 3.0 | 2.0 | 1270 | $1,750 | $1.38 | 15d | 1 | 1.14mi |
| 4440 SE 62nd St Ocala, FL | 3.0 | 2.0 | 1325 | $1,850 | $1.40 | 23d | 1 | 1.16mi |
| 21 Dogwood Drive Pass Ocala, FL | 3.0 | 2.0 | 1390 | $1,595 | $1.15 | 23d | 1 | 1.17mi |
| 9 Pine Course Radl Ocala, FL | 3.0 | 2.0 | 1453 | $1,725 | $1.19 | 15d | 1 | 1.21mi |
| 338 Larch Rd Ocala, FL | 3.0 | 2.0 | 1394 | $1,595 | $1.14 | 23d | 1 | 1.22mi |
| 139 Pine Crse Ocala, FL | 3.0 | 2.0 | 1398 | $1,645 | $1.18 | 15d | 1 | 1.24mi |
| 3851 SE 66th Pl Ocala, FL | 3.0 | 2.0 | 1109 | $1,575 | $1.42 | 23d | 1 | 1.28mi |
| 88 Dogwood Drive Loop Ocala, FL | 3.0 | 2.0 | 1659 | $1,600 | $0.96 | 23d | 1 | 1.31mi |
| 3 Pine Circle Pass Ocala, FL | 3.0 | 2.0 | 1674 | $1,700 | $1.02 | 23d | 1 | 1.42mi |
| 2 Dogwood Drive Pl Ocala, FL | 4.0 | 2.0 | 1608 | $2,099 | $1.31 | 23d | 1 | 1.44mi |
| 9 Dogwood Trail Dr Ocala, FL | 3.0 | 2.0 | 1110 | $1,595 | $1.44 | 23d | 1 | 1.48mi |
Listing history 18 events
-
2026-06-07remarks 681-char remark
-
2026-06-07statusdays on market $195,000 Pending 14 DOM
-
2026-06-03days on market $195,000 Active 12 DOM
-
2026-06-02days on market $195,000 Active 11 DOM
-
2026-06-01days on market $195,000 Active 10 DOM
-
2026-05-31days on market $195,000 Active 9 DOM
-
2026-05-30days on market $195,000 Active 8 DOM
-
2026-05-22$195,000 Active
-
2019-02-26soldstatus $135,000 518-char remark
Show marketing remark (518 chars)
Lovely 3/2/2 in Silver Springs Shores! House has been freshly painted inside and has new appliances. Home was built in 2007 and has 1,317 square feet. Kitchen and baths are tiled and rest of house has new carpet. Kitchen is wide open to the living room which has vaulted ceilings. Kitchen has new sink and faucet. All doors have been freshly painted and have new doorknobs. Garage has also been freshly painted. Great for first-time home buyers or rental opportunity! Broker/owner. Sold AS IS with right to inspect.
-
2019-02-04soldstatus $135,000
-
2019-01-31soldstatus $135,000 518-char remark
Show marketing remark (518 chars)
Lovely 3/2/2 in Silver Springs Shores! House has been freshly painted inside and has new appliances. Home was built in 2007 and has 1,317 square feet. Kitchen and baths are tiled and rest of house has new carpet. Kitchen is wide open to the living room which has vaulted ceilings. Kitchen has new sink and faucet. All doors have been freshly painted and have new doorknobs. Garage has also been freshly painted. Great for first-time home buyers or rental opportunity! Broker/owner. Sold AS IS with right to inspect.
-
2018-10-21$136,500 518-char remark
Show marketing remark (518 chars)
Lovely 3/2/2 in Silver Springs Shores! House has been freshly painted inside and has new appliances. Home was built in 2007 and has 1,317 square feet. Kitchen and baths are tiled and rest of house has new carpet. Kitchen is wide open to the living room which has vaulted ceilings. Kitchen has new sink and faucet. All doors have been freshly painted and have new doorknobs. Garage has also been freshly painted. Great for first-time home buyers or rental opportunity! Broker/owner. Sold AS IS with right to inspect.
-
2013-02-27soldstatus $104,000
-
2013-02-21soldstatus $104,000
-
2012-11-06$105,900
-
2012-09-26soldstatus $78,777
-
2012-08-20$69,900
ⓘ Source: listings_history table (triggers on properties + properties_extension) + one-shot
backfill from property_details.listing_events for pre-trigger history.
Tax reassessment forecast FL · Resets to sale price
- Current annual tax
- $1,939 · $162/mo
- Projected year-2 tax
- $1,939 · $162/mo
- Expected delta
- $0/yr ($0/mo · 0.0%)
ⓘ Screening estimate from a state-policy table — verify with the county assessor before closing.
Climate risk First Street
- Flood 4/10 Moderate FEMA zone X (unshaded) · 24% chance over 30 yrs
- Wildfire 5/10 Major
- Heat 9/10 Extreme 7 d/yr ≥108°F today · 23 d/yr by 30 yrs out
- Wind 9/10 Extreme 99% chance of damaging wind over 30 yrs
- Air quality 3/10 Moderate 3 unhealthy d/yr today · 4 by 30 yrs out
Nearby sold comps map
Loading sold comps map…
Walkable amenities ~0.75 mi
Loading nearby amenities…
Taxation est. · year 1
- Rental income
- $19,343
- − Mortgage interest
- −$10,923
- − Property taxes
- −$1,939
- − Insurance
- −$975
- − Repairs & maintenance
- −$1,547
- − Management
- −$1,547
- − Depreciation
- −$5,673
- Taxable loss
- −$3,262
- Est. tax savings @ 24.0%
- +$783
- After-tax cash flow
- $879/yr
For passive investors: Depreciation is non-cash, so a rental often shows a tax loss while cash-flowing — sheltering income. Rental losses are passive: they offset passive income freely, and up to $25,000/yr can offset ordinary (W-2) income if you actively participate and your MAGI is under $100k (phasing out to $0 by $150k); unused losses carry forward. On sale, claimed depreciation is recaptured at up to 25%, and gains may owe capital-gains tax (a 1031 exchange can defer both). Figures are a year-1 estimate at your 24.0% rate — not tax advice; consult a CPA.
Schools (NCES district)
- District
- Marion
- NCES district ID
- 1201260
- Math proficiency
- 42% ▼ -7.00%
- Reading proficiency
- 43% ▼ -4.00%
- Median HH income
- $40,015
- Composite
- 35.61/100
- National rank
- #4890
- State rank
- #61 of 73 in FL
Livability — Silver Springs Shores
- Score
- 68/100
- State rank
- #527
- US rank
- #9854
Category grades
Schools grade is shown separately in the Schools card above.
Census & demographics
- County
- Marion County · 315,796 people
- City population
- 34,665
- Metro
- Ocala, FL
- Population (ZIP)
- 23,517
- Household income
- $77,557
- Rent vs Own
- Severe rent burden
- 169.0
Population outlook (Marion County) Hauer SSP2
- Today (2025)
- 365,905 people
- By 2030
- 376,768 · +3.0%
- By 2040
- 396,555 · +8.4%
- By 2050
- 412,723 · +12.8%
- By 2075
- 446,090 · +21.9%
- By 2100
- 436,193 · +19.2%
Race, ethnicity, and origin ACS 2023
- Neighborhood character
- Predominantly White (73%)
- Race & ethnicity
- White 73% Hispanic / Latino 15% Two or more races 11% Black 6% Asian 2%
- Hispanic origin (detail)
- Mexican 3% Puerto Rican 5% Cuban 2% Dominican 2%
- Common ancestry
- Italian 3% Slovak 3% Lithuanian 2%
- Foreign-born
- 6% · Canada
- Languages at home
- 89% English-only · Spanish 9% Other Asian/Pacific 1%
Political lean MEDSL · Marion
- 2024 margin
- Solid R (+31.6) · D 33.8% · R 65.5%
- 2008→2024 swing
- -20.0pp toward R · 2008: -11.6pp · 2024: -31.6pp
- All cycles
- 2024: R+31.6 2020: R+25.9 2016: R+26.2 2012: R+16.2 2008: R+11.6
Not yet ingested
- Civics
- —
Market trends
- HPI YoY
- ▼ -85.60%
- Current HPI
- 212.4262
- Rent YoY
- ▲ 2.84%
- Metro
- Ocala, FL
- State GDP YoY
- ▲ 3.28%
- F500 in state
- 36
Industry mix (Fortune 500 HQ in FL)
| Industry | F500 HQs | Revenue |
|---|---|---|
| Industrial Technology | 2 | $29B |
|
||
| Insurance | 2 | $17B |
|
||
| Retail | 1 | $60B |
|
||
| Technology Distribution | 1 | $58B |
|
||
| Homebuilding | 1 | $35B |
|
||
| Technology Manufacturing | 1 | $35B |
|
||
Price history
+179.0% since first listed12 events — show timeline
- 2026-06-06 Pending — Stellar MLS as Distributed by MLS Grid
- 2026-05-22 Listed $195,000 Stellar MLS as Distributed by MLS Grid
- 2019-02-26 Sold (MLS) $135,000 Stellar MLS as Distributed by MLS Grid
- 2019-02-04 Sold (Public Records) $135,000 Public Records
- 2019-01-31 Sold (MLS) $135,000 Stellar MLS as Distributed by MLS Grid
- 2018-10-21 Listed $136,500 Stellar MLS as Distributed by MLS Grid
- 2018-10-21 Listed $136,500 Stellar MLS as Distributed by MLS Grid
- 2013-02-27 Sold (Public Records) $104,000 Public Records
- 2013-02-21 Sold (MLS) $104,000 Stellar MLS as Distributed by MLS Grid
- 2012-11-06 Listed $105,900 Stellar MLS as Distributed by MLS Grid
- 2012-09-26 Sold (MLS) $78,777 Stellar MLS as Distributed by MLS Grid
- 2012-08-20 Listed $69,900 Stellar MLS as Distributed by MLS Grid
Property tax history
+2.2%/yrLatest (2025): $1,939 · +14.2% YoY. Source: county tax records.
Cash-flow waterfall
monthlySold comps — $/sqft
last 12 mo · ≤1 miLoading sold comps…