17 Downer Pl · Sag Harbor, NY
Flood risk 1/10 · Minimal
- FEMA flood zone
- X (unshaded)
- Chance of flooding over 30 yrs
- 0.0%
- Est. flood insurance / yr
- $473 – $860
Fire risk 2/10 · Minimal
- Est. fire insurance / yr
- $691 – $1,283
Heat risk 4/10 · Minor
- Hot days now (above 90°F)
- 7 days/yr
- Hot days in 30 yrs
- 19 days/yr
Wind risk 8/10 · Major
- Chance of severe wind over 30 yrs
- 80.0%
Air-quality risk 3/10 · Minor
- Unhealthy air days now
- 2 days/yr
- Unhealthy air days in 30 yrs
- 3 days/yr
Risk factors via First Street. Map © Google.
Why this score? — see what drove the B+ grade
The composite is a weighted blend of 9 inputs, each scored 0–100. Each bar is that input's sub-score; the figure is the points it added to the 100-point composite (weight × sub-score).
- Cash flow +30.0/30.0
- DSCR +10.0/10.0
- Appreciation +9.6/10.0
- 1% rule +8.2/10.0
- Schools +5.6/10.0
- ARV discount +5.4/15.0
- Rent growth +5.0/5.0
- Livability +3.5/5.0
- Condition / age +2.5/5.0
$1,795,000
🖨 Deal sheet 📄 Offer letter ✓ Due diligence
Listing remarks MLS
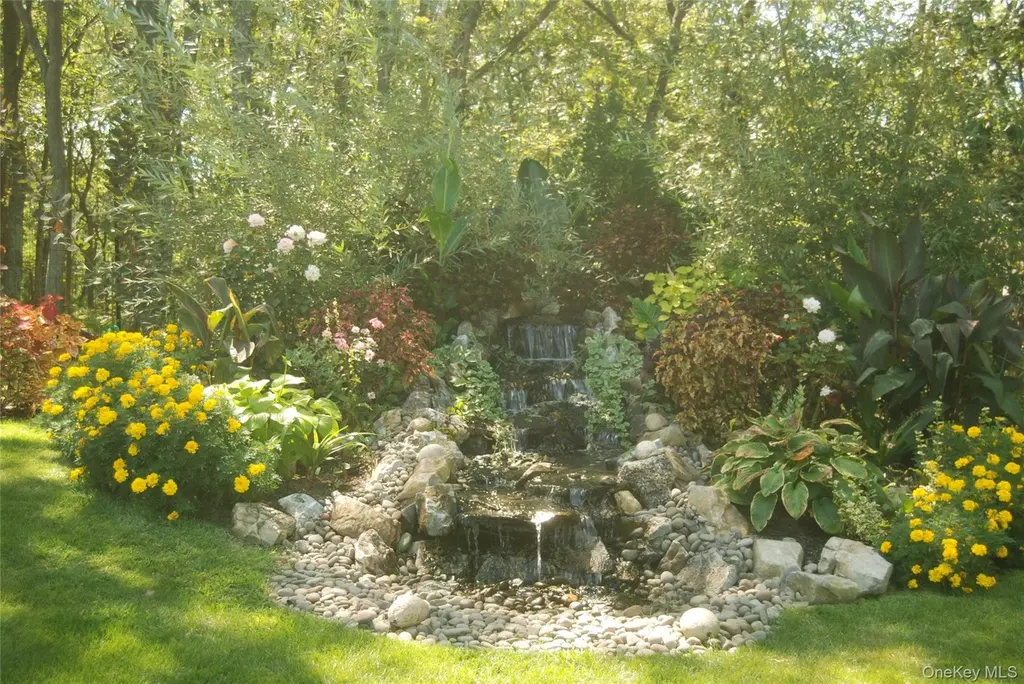
Welcome to 17 Downer Place, an exceptional opportunity in the village of Sag Harbor. This .52-acre parcel offers endless potential, with room for a pool, pool house, and expansive outdoor living. Surrounded by mature trees and tucked away on a quiet cul-de-sac, the setting is both serene and central - just moments from the village's celebrated dining, boutique shopping, marinas, and cultural attractions, .5 Miles to Haven's Beach and close to top-rated public and private schools. The property offers strong investment upside. The existing steel frame structure is in immaculate condition, move in ready, or can be renovated to your taste. Bring your vision to create a bespoke Hamptons retreat in one of the East End's most desirable villages.
Key facts
- Room for a pool
- Close to schools
- Quiet cul-de-sac
Tags
Neighborhood map
What this means for you Summary
Snapshot
- This is a 3-bed/2.5-bath single-family listed at $1.79M.
Deal economics
- At list price, monthly cash flow is $8k ($98k/yr) — positive.
- The deal already cash-flows at list — no discount required.
- Meets the 1% rule at list price ($24k rent vs $1.79M).
- Recommended offer: $1.58M (12.0% below list) — sets the bar for market timing.
Location & tenants
- Location reads 70/100 on livability (#427 in NY) — a middle-class / working-renter tenant base. Strengths: crime A+, employment A+, health & safety A; Watch: amenities F, commute F, cost of living F.
- Sag Harbor Union Free School District (suburban): math 54% / reading 70% proficiency, ranked #175 of 590 in NY (top 30%) — acceptable for families but not a draw, mixed tenant base, ~2y average lease; only 8% free/reduced lunch — higher-income household profile.
- Market conditions: Rents rising fast (+10.8%/yr); 65 active listings in the ZIP; 5 comparable units currently listed for rent nearby; rentals at typical pace (median 22d on market — plan ~3-4 weeks tenant-placement turnaround); high-income renter base; 1,366 units permitted in Suffolk County in 2024 (216 in 5+ unit buildings).
- At $23,675/mo this rent would consume 222% of the median local household income ($128k/yr) (locally 95% of renters already pay >50% of income on rent) — very limited rent-growth headroom before tenants either downsize or default.
Forward outlook
- In year one you build about $177k of equity ($12k loan paydown + $165k appreciation (9.2% local appreciation)).
- Suffolk County population projected to shrink 5% by 2050 — rents likely to lag national; underwrite the cash flow, not the appreciation.
- At projected returns (9.2% appreciation + 8.0% rent growth), your $503k cash investment doubles in ~2 years — after that, you're playing with house money.
- By year 2, paydown + projected appreciation supports a ~$284k cash-out refi (75% LTV) — recoverable capital for the next deal without selling this one.
Negotiation context
- It's been on market 168 days — a 12% lower offer ($1.58M) is reasonable based on typical stale-listing flexibility.
Risks & watch-outs
- Climate carrying-cost: severe wind risk, 80% chance of damaging wind over 30y — expect insurance premiums to compound above CPI over the hold.
Questions for the listing agent
- It's been on market 168 days. Have you received any prior offers? Is the seller open to a 12% concession, seller financing, or rate buy-down credit?
- Why hasn't it sold? Are there any deal-killer items the seller is aware of (foundation, flood, title, zoning, code violations)?
- Is there a deadline driving the sale (1031 exchange, divorce, estate, relocation)? That informs how much negotiation room exists.
- Schools are A-rated — typically a magnet for longer-tenancy family renters. What's the average tenant stay here, and is there a school-zone premium baked into asking?
- What's the average days-on-market for RENTAL listings here right now (not sales)? A rising rental-DOM trend means longer vacancies and softer asking-rent achievability than the comps imply.
- What's the recent tenant-quality profile in this submarket — average credit score on applications, eviction rate, late-payment / NSF rate, and stable-employment percentage? A property-management company in the area should have these aggregated.
- How much new for-sale + rental construction is in the pipeline within 1–3 miles? Heavy new supply typically softens prices + rents 12–24 months out; constrained supply supports both.
Investment metrics
- 1% rule
- 1.32% ✓
- Cap rate
- 11.73%
- Cash-on-cash
- 19.42%
- DSCR
- 1.86
- GRM
- 6.3
CMA / ARV
- ARV (median comp)
- $1,713,450
- List price
- $1,795,000
- Delta
- 4.76%
- Verdict
- FAIR
- Comps
- 10 within 1.0 mi
Show comp detail 4 sales within ~0.75 mi
| Address | Dist | Beds/Ba | Sqft | Sold | Price | $/sf | Match |
|---|---|---|---|---|---|---|---|
| 36 Denison Rd | 0.48mi | 3/2.0 | 1,456 (+0%) | 5mo | $1,750,000 | $1,202 | 71 |
| 57 Palmer Ter | 0.58mi | 3/2.0 | 1,500 (+3%) | 1mo | $2,000,000 | $1,333 | 65 |
| 1215 Middle Line Hwy | 0.48mi | 4/2.0 (+1) | 1,500 (+3%) | 11mo | $1,500,000 | $1,000 | 56 |
| 300 Madison St | 0.44mi | 3/2.0 | 1,628 (+12%) | 5mo | $1,855,000 | $1,139 | 54 |
Match score weights: distance 35% · size 25% · config 20% · recency 20%. Top-matched comps best support the ARV.
Projected returns pro-forma
9.19% appreciation · 8.0% rent growth · sell at horizon
- IRR
- 39.9%
- Equity multiple
- 4.03×
- Total profit
- $1,520,905
- Equity at exit
- $1,511,713
- IRR
- 36.7%
- Equity multiple
- 9.67×
- Total profit
- $4,358,362
- Equity at exit
- $3,154,092
Cash invested: $502,600 (down + closing). Projections, not guarantees.
Landlord ↔ Tenant lean methodology
- Overall (STATE)
- 15 Strongly Tenant-Friendly
- State New York
- 15 Strongly Tenant-Friendly · D+10
- County
- — inherits STATE
- City
- — inherits STATE
ZIP-level market 11963
- Home prices YoY
- 1.9%
- Rents YoY
- 10.8%
- Active inventory
- 65
- Price-to-rent
- 6.3×
Monthly cashflow live
- Estimated rent
- $23,675 medium interval (Pro) →
- Mortgage (P&I)
- −$9,413
- Tax from tax record
- −$409 /mo · $4,914/yr
- Insurance
- −$748
- HOA
- −$0
- Vacancy / Maint / Mgmt
- −$4,972
- Net cashflow
- $8,133
Break-even live
UW: 25.0% down · 7.5% · 30yr · 1.5% tax · 5.0% vac · 8.0% maint · 8.0% mgmt
Financing live
Cash to close
- Down payment
- $448,750
- Closing costs
- $53,850
- Reserves months
- —
- Total cash needed
- —
Loan-product check · same deal, 3 products live
Conventional
25% down · 7.5% · 30yr
- Down + closing
- —
- Monthly P&I
- —
- Monthly cashflow
- —
- DSCR
- —
- Eligible?
- —
Personal DTI + credit; lowest rate.
DSCR
20% down · 8.5% · 30yr
- Down + closing
- —
- Monthly P&I
- —
- Monthly cashflow
- —
- DSCR
- —
- Eligible?
- —
No personal income docs; deal must DSCR.
Hard money
10% down · 12.0% · 12mo
- Down + closing
- —
- Monthly P&I
- —
- Monthly cashflow
- —
- DSCR
- —
- Eligible?
- —
Short-term bridge; refi at stabilization.
Rent comps 5 comps
| Address | Beds | Baths | Sqft | Rent | $/sqft | DOM | Units | Dist |
|---|---|---|---|---|---|---|---|---|
| 95 Main St Unit 2 Sag Harbor, NY | 2.0 | 1.0 | 1000 | $62,400 | $62.40 | 22d | 1 | 0.71mi |
| 15 Mount Misery Dr Sag Harbor, NY | 3.0 | 3.0 | 1848 | $25,000 | $13.53 | 1d | 1 | 0.79mi |
| 15 Mount Misery Dr Sag Harbor, NY | 3.0 | 3.0 | 1848 | $75,000 | $40.58 | 22d | 1 | 0.79mi |
| 364 Main St Unit B Sag Harbor, NY | 3.0 | 1.0 | 1200 | $35,000 | $29.17 | 22d | 1 | 0.90mi |
| 68 W Water St Sag Harbor, NY | 3.0 | 2.0 | 1740 | $40,000 | $22.99 | 43d | 1 | 1.20mi |
Listing history 2 events
-
2026-02-06price $1,795,000 748-char remark
Show marketing remark (748 chars)
Welcome to 17 Downer Place, an exceptional opportunity in the village of Sag Harbor. This .52-acre parcel offers endless potential, with room for a pool, pool house, and expansive outdoor living. Surrounded by mature trees and tucked away on a quiet cul-de-sac, the setting is both serene and central - just moments from the village's celebrated dining, boutique shopping, marinas, and cultural attractions, .5 Miles to Haven's Beach and close to top-rated public and private schools. The property offers strong investment upside. The existing steel frame structure is in immaculate condition, move in ready, or can be renovated to your taste. Bring your vision to create a bespoke Hamptons retreat in one of the East End's most desirable villages.
-
2025-12-05$1,995,000 Active 748-char remark
Show marketing remark (748 chars)
Welcome to 17 Downer Place, an exceptional opportunity in the village of Sag Harbor. This .52-acre parcel offers endless potential, with room for a pool, pool house, and expansive outdoor living. Surrounded by mature trees and tucked away on a quiet cul-de-sac, the setting is both serene and central - just moments from the village's celebrated dining, boutique shopping, marinas, and cultural attractions, .5 Miles to Haven's Beach and close to top-rated public and private schools. The property offers strong investment upside. The existing steel frame structure is in immaculate condition, move in ready, or can be renovated to your taste. Bring your vision to create a bespoke Hamptons retreat in one of the East End's most desirable villages.
ⓘ Source: listings_history table (triggers on properties + properties_extension) + one-shot
backfill from property_details.listing_events for pre-trigger history.
Tax reassessment forecast NY · Partial reset (capped growth)
- Current annual tax
- $4,914 · $409/mo
- Projected year-2 tax
- $17,625 · $1,469/mo
- Expected delta
- +$12,711/yr (+$1,059/mo · 258.7%)
ⓘ Screening estimate from a state-policy table — verify with the county assessor before closing.
Climate risk First Street
- Flood 1/10 Low FEMA zone X (unshaded) · 0% chance over 30 yrs
- Wildfire 2/10 Low
- Heat 4/10 Moderate 7 d/yr ≥90°F today · 19 d/yr by 30 yrs out
- Wind 8/10 Severe 80% chance of damaging wind over 30 yrs
- Air quality 3/10 Moderate 2 unhealthy d/yr today · 3 by 30 yrs out
Nearby sold comps map
Loading sold comps map…
Walkable amenities ~0.75 mi
Loading nearby amenities…
Taxation est. · year 1
- Rental income
- $284,105
- − Mortgage interest
- −$100,548
- − Property taxes
- −$4,914
- − Insurance
- −$8,975
- − Repairs & maintenance
- −$22,728
- − Management
- −$22,728
- − Depreciation
- −$52,218
- Taxable income
- $71,993
- Est. tax owed @ 24.0%
- −$17,278
- After-tax cash flow
- $80,318/yr
For passive investors: Depreciation is non-cash, so a rental often shows a tax loss while cash-flowing — sheltering income. Rental losses are passive: they offset passive income freely, and up to $25,000/yr can offset ordinary (W-2) income if you actively participate and your MAGI is under $100k (phasing out to $0 by $150k); unused losses carry forward. On sale, claimed depreciation is recaptured at up to 25%, and gains may owe capital-gains tax (a 1031 exchange can defer both). Figures are a year-1 estimate at your 24.0% rate — not tax advice; consult a CPA.
Schools (NCES district)
- District
- Sag Harbor Union Free School District
- NCES district ID
- 3625380
- Math proficiency
- 54% ▼ -13.00%
- Reading proficiency
- 70% ▲ 7.00%
- Median HH income
- $81,547
- Composite
- 55.69/100
- National rank
- #1222
- State rank
- #175 of 590 in NY
Livability — Sag Harbor
- Score
- 70/100
- State rank
- #427
- US rank
- #7428
Category grades
Schools grade is shown separately in the Schools card above.
Census & demographics
- Census place
- Sag Harbor, NY
- County
- Suffolk County · 679,920 people
- City population
- 8,390
- Metro
- New York-Newark-Jersey City, NY-NJ-PA
- Population (ZIP)
- 8,390
- Household income
- $127,746
- Rent vs Own
- Severe rent burden
- 95.0
Population outlook (Suffolk County) Hauer SSP2
- Today (2025)
- 1,505,262 people
- By 2030
- 1,498,318 · -0.5%
- By 2040
- 1,471,101 · -2.3%
- By 2050
- 1,424,848 · -5.3%
- By 2075
- 1,337,157 · -11.2%
- By 2100
- 1,217,720 · -19.1%
Race, ethnicity, and origin ACS 2023
- Neighborhood character
- Predominantly White (78%)
- Race & ethnicity
- White 78% Hispanic / Latino 13% Two or more races 11% Asian 4% Black 2%
- Hispanic origin (detail)
- Mexican 8%
- Common ancestry
- Scotch-Irish 4% Romanian 3% Italian 2%
- Foreign-born
- 13% · Canada, China, Jamaica
- Languages at home
- 81% English-only · Spanish 9% Other Indo-European 5% French/Haitian/Cajun 2%
Political lean MEDSL · Suffolk
- 2024 margin
- Lean R (+10.0) · D 45.0% · R 55.0%
- 2008→2024 swing
- -16.0pp toward R · 2008: 6.0pp · 2024: -10.0pp
- All cycles
- 2024: R+10.0 2020: R+0.0 2016: R+8.2 2012: D+2.9 2008: D+6.0
Not yet ingested
- Civics
- —
Market trends
- HPI YoY
- ▲ 9.19%
- Current HPI
- 499.3304
- Rent YoY
- ▲ 10.76%
- Metro
- New York-Newark-Jersey City, NY-NJ-PA
- State GDP YoY
- ▲ 2.60%
- F500 in state
- 92
Industry mix (Fortune 500 HQ in NY)
| Industry | F500 HQs | Revenue |
|---|---|---|
| Financial Services | 10 | $950B |
|
||
| Consumer Goods | 9 | $162B |
|
||
| Insurance | 4 | $225B |
|
||
| Telecommunications | 2 | $144B |
|
||
| Pharmaceuticals | 2 | $112B |
|
||
| Media / Entertainment | 2 | $69B |
|
||
Price history
-10.0% since first listed2 events — show timeline
- 2026-02-06 Price Changed $1,795,000 OneKey® MLS as Distributed by MLS Grid
- 2025-12-05 Listed $1,995,000 OneKey® MLS as Distributed by MLS Grid
Property tax history
+0.1%/yrLatest (2025): $4,914 · +0.0% YoY. Source: county tax records.
Cash-flow waterfall
monthlySold comps — $/sqft
last 12 mo · ≤1 miLoading sold comps…