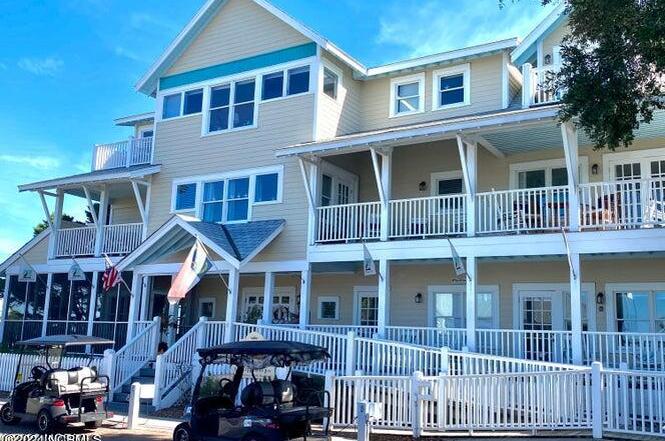
21 Keelson Row Unit Yachtmaster 8m · Bald Head Island, NC
Flood risk No data
- FEMA flood zone
- —
- Chance of flooding over 30 yrs
- —
- Est. flood insurance / yr
- —
Fire risk No data
- Est. fire insurance / yr
- —
Heat risk No data
- Hot days now (above threshold)
- —
- Hot days in 30 yrs
- —
Wind risk No data
- Chance of severe wind over 30 yrs
- —
Air-quality risk No data
- Unhealthy air days now
- —
- Unhealthy air days in 30 yrs
- —
Risk factors via First Street. Map © Google.
Why this score? — see what drove the C+ grade
The composite is a weighted blend of 9 inputs, each scored 0–100. Each bar is that input's sub-score; the figure is the points it added to the 100-point composite (weight × sub-score).
- Cash flow +30.0/30.0
- 1% rule +10.0/10.0
- DSCR +10.0/10.0
- Schools +3.9/10.0
- Livability +2.9/5.0
- Rent growth +2.7/5.0
- Condition / age +2.5/5.0
- ARV discount +0.0/15.0
- Appreciation +0.0/10.0
$72,500
🖨 Deal sheet 📄 Offer letter ✓ Due diligence
Listing remarks
FRACTIONAL - 4 WEEKS ownership per year - 2 Bedroom (Bunkroom) plus 2 Full Baths plus a Queen Sleeper Sofa in Great Room - enjoy a dining set for 4, a full refrigerator, built-in microwave, stove top, sink, & stocked cabinets for your cooking enjoyment. Great views - outside porch/deck. furnished with cart, bicycles, housekeeping, 50 lb. pet allowed by OWNERS - you can also rent your ownership for revenue - great way to own on beautiful Bald Head Island. Shoals Club Access if available. An Additional kitchen and dining downstairs and lovely sitting areas thru-out 6/4-6/11; 9/3-9/10; 12/3-12/10; 3/11-3/18; 6/17-6/24; 9/16-9/23; 3/16-3/23/28
Key facts
- Additional kitchen
- Lovely kitchen
- Outside porch
Tags
Property features AI
Finance
- Other: Road frontage on city street and state road; Bay/harbor frontage; Lot is irregular, approximately 0.26 acres; Zoning: Bh-Pd-3; Directions: Around the Harbour onto 21 Keelson - Marsh Harbour is on right - on the Marsh
- HOA & community: Homeowners association with laundry amenity; Annual association fee of $4,376 (approximately $364.67/month); Subdivision: BHI Harbour Village
Exterior
- Parking: 6 parking spaces total; 6-car garage; Shared driveway
- Security: Smoke detector(s)
- Utilities: Public water; Sewer available; Water available; Underground utilities
- Home design: Residential timeshare (fractional); Three or more levels; 3 stories total
- Construction: Frame construction; Pillar/post/pier foundation; Tile and wood roof
- Exterior features: Balcony; Porch; On waterfront; Has view; Smoke detector(s); Pets allowed; Sidewalks
Interior
- Kitchen: Electric cooktop; Refrigerator
- Bedrooms: 3 total rooms (includes bedrooms and living spaces)
- Flooring: Tile; Wood
- Bathrooms: 2 full bathrooms
- Heating & cooling: Heat pump heating; Electric heating; Zoned heating; Central air conditioning; Heat pump cooling
- Interior features: High ceilings; Window coverings; Furnished
- Laundry & utility: Electric water heater; Laundry available through association
Neighborhood map
What this means for you Summary
Snapshot
- This is a 2-bed/2.0-bath single-family listed at $72k.
Deal economics
- At list price, monthly cash flow is $288 ($3k/yr) — positive.
- The deal already cash-flows at list — no discount required.
- Meets the 1% rule at list price ($1k rent vs $72k).
- Recommended offer: $64k (12.0% below list) — sets the bar for market timing.
Location & tenants
- Location reads 57/100 on livability (#597 in NC) — a working-class tenant base; expect higher turnover. Strengths: employment A+, crime A; Watch: health & safety D, amenities F, commute F.
- Brunswick County Schools (rural): math 45% / reading 47% proficiency, ranked #82 of 178 in NC (top 46%) — families likely to look elsewhere, expect single-tenant / working-renter base with shorter leases.
- Market conditions: Rents flat; 877 active listings in the ZIP; solid renter incomes; 6,112 units permitted in Brunswick County in 2024 (990 in 5+ unit buildings).
Forward outlook
- Local home prices are declining (-3.0%/yr); year-one equity from $501 of loan paydown is wiped out by about $2k of value loss. Plan a longer hold.
- Brunswick County population projected at +36% by 2050 — long-run rental-demand tailwind backs the buy-and-hold thesis.
- At projected returns (-3.0% appreciation + 0.7% rent growth), your $20k cash investment doubles in ~10 years — after that, you're playing with house money.
Negotiation context
- It's been on market 188 days — a 12% lower offer ($64k) is reasonable based on typical stale-listing flexibility.
- 4 sale attempts since 2y ago with the ask held roughly flat each time — persistent listings suggest the price (not the market) is what's stuck; bring a comps-based counter.
Risks & watch-outs
- Watch-outs: HOA is 25% of rent.
Questions for the listing agent
- It's been on market 188 days. Have you received any prior offers? Is the seller open to a 12% concession, seller financing, or rate buy-down credit?
- What does the HOA fee cover, when was the last increase, and are there any pending special assessments or reserve-fund shortfalls?
- Why hasn't it sold? Are there any deal-killer items the seller is aware of (foundation, flood, title, zoning, code violations)?
- Is there a deadline driving the sale (1031 exchange, divorce, estate, relocation)? That informs how much negotiation room exists.
- What's the average days-on-market for RENTAL listings here right now (not sales)? A rising rental-DOM trend means longer vacancies and softer asking-rent achievability than the comps imply.
- What's the recent tenant-quality profile in this submarket — average credit score on applications, eviction rate, late-payment / NSF rate, and stable-employment percentage? A property-management company in the area should have these aggregated.
- How much new for-sale + rental construction is in the pipeline within 1–3 miles? Heavy new supply typically softens prices + rents 12–24 months out; constrained supply supports both.
Investment metrics
- 1% rule
- 2.01% ✓
- Cap rate
- 11.06%
- Cash-on-cash
- 17.02%
- DSCR
- 1.76
- GRM
- 4.1
CMA / ARV
- ARV (on-the-fly)
- $57,000
- Comps found
- 2
Show comp detail 2 sales within ~0.75 mi
| Address | Dist | Beds/Ba | Sqft | Sold | Price | $/sf | Match |
|---|---|---|---|---|---|---|---|
| 21 Keelson Row Unit Pinnacle-F | 0.00mi | 2/2.0 | 750 (0%) | 3mo | $55,000 | $73 | 98 |
| 21 Keelson Row Unit 3c | 0.00mi | 2/2.0 | 800 (+7%) | 6mo | $61,000 | $76 | 84 |
Match score weights: distance 35% · size 25% · config 20% · recency 20%. Top-matched comps best support the ARV.
Projected returns pro-forma
-3.0% appreciation · 0.74% rent growth · sell at horizon
- IRR
- 4.7%
- Equity multiple
- 1.18×
- Total profit
- $3,593
- Equity at exit
- $10,810
- IRR
- 11.0%
- Equity multiple
- 1.74×
- Total profit
- $15,009
- Equity at exit
- $6,268
Cash invested: $20,300 (down + closing). Projections, not guarantees.
Landlord ↔ Tenant lean methodology
- Overall (STATE)
- 85 Strongly Landlord-Friendly
- State North Carolina
- 85 Strongly Landlord-Friendly · R+3
- County
- — inherits STATE
- City
- — inherits STATE
ZIP-level market 28461
- Rents YoY
- 0.7%
- Active inventory
- 877
- Price-to-rent
- 4.1×
Monthly cashflow live
- Estimated rent
- $1,461 medium interval (Pro) →
- Mortgage (P&I)
- −$380
- Tax est. 1.5%
- −$91 /mo · $1,088/yr
- Insurance
- −$30
- HOA
- −$365
- Vacancy / Maint / Mgmt
- −$307
- Net cashflow
- $288
Break-even live
UW: 25.0% down · 7.5% · 30yr · 1.5% tax · 5.0% vac · 8.0% maint · 8.0% mgmt
Financing live
Cash to close
- Down payment
- $18,125
- Closing costs
- $2,175
- Reserves months
- —
- Total cash needed
- —
Loan-product check · same deal, 3 products live
Conventional
25% down · 7.5% · 30yr
- Down + closing
- —
- Monthly P&I
- —
- Monthly cashflow
- —
- DSCR
- —
- Eligible?
- —
Personal DTI + credit; lowest rate.
DSCR
20% down · 8.5% · 30yr
- Down + closing
- —
- Monthly P&I
- —
- Monthly cashflow
- —
- DSCR
- —
- Eligible?
- —
No personal income docs; deal must DSCR.
Hard money
10% down · 12.0% · 12mo
- Down + closing
- —
- Monthly P&I
- —
- Monthly cashflow
- —
- DSCR
- —
- Eligible?
- —
Short-term bridge; refi at stabilization.
HOA detail
- Monthly dues
- $365 · $4,380/yr
Listing history 23 events
-
2026-06-18days on market $72,500 Active 188 DOM
-
2026-06-17days on market $72,500 Active 187 DOM
-
2026-06-16days on market $72,500 Active 186 DOM
-
2026-06-15days on market $72,500 Active 185 DOM
-
2026-06-14days on market $72,500 Active 183 DOM
-
2026-06-13days on market $72,500 Active 182 DOM
-
2026-06-10days on market $72,500 Active 180 DOM
-
2026-06-09days on market $72,500 Active 179 DOM
-
2026-06-08days on market $72,500 Active 178 DOM
-
2026-06-07days on market $72,500 Active 177 DOM
-
2026-06-05days on market $72,500 Active 174 DOM
-
2026-06-03days on market $72,500 Active 173 DOM
-
2026-06-02days on market $72,500 Active 172 DOM
-
2026-06-01days on market $72,500 Active 171 DOM
-
2026-05-31days on market $72,500 Active 170 DOM
-
2026-05-30days on market $72,500 Active 169 DOM
-
2026-03-26status Active
-
2026-03-26historical
-
2026-03-13status Active
-
2026-03-12historical
-
2025-03-17$72,500 Active
-
2025-03-11historical
-
2024-09-11$61,900
ⓘ Source: listings_history table (triggers on properties + properties_extension) + one-shot
backfill from property_details.listing_events for pre-trigger history.
Nearby sold comps map
Loading sold comps map…
Walkable amenities ~0.75 mi
Loading nearby amenities…
Taxation est. · year 1
- Rental income
- $17,530
- − Mortgage interest
- −$4,061
- − Property taxes
- −$1,088
- − Insurance
- −$362
- − Repairs & maintenance
- −$1,402
- − Management
- −$1,402
- − HOA
- −$4,380
- − Depreciation
- −$2,109
- Taxable income
- $2,725
- Est. tax owed @ 24.0%
- −$654
- After-tax cash flow
- $2,802/yr
For passive investors: Depreciation is non-cash, so a rental often shows a tax loss while cash-flowing — sheltering income. Rental losses are passive: they offset passive income freely, and up to $25,000/yr can offset ordinary (W-2) income if you actively participate and your MAGI is under $100k (phasing out to $0 by $150k); unused losses carry forward. On sale, claimed depreciation is recaptured at up to 25%, and gains may owe capital-gains tax (a 1031 exchange can defer both). Figures are a year-1 estimate at your 24.0% rate — not tax advice; consult a CPA.
Schools (NCES district)
- District
- Brunswick County Schools
- NCES district ID
- 3700420
- Math proficiency
- 45% ▲ 4.00%
- Reading proficiency
- 47% ▲ 4.00%
- Median HH income
- $47,494
- Composite
- 39.23/100
- National rank
- #4011
- State rank
- #82 of 178 in NC
Livability — Bald Head Island
- Score
- 57/100
- State rank
- #597
- US rank
- #21745
Category grades
Schools grade is shown separately in the Schools card above.
Census & demographics
- Census place
- Bald Head Island, NC
- County
- Brunswick County · 131,536 people
- Metro
- Myrtle Beach-Conway-North Myrtle Beach, SC-NC
- Population (ZIP)
- 23,762
- Household income
- $82,692
- Rent vs Own
- Severe rent burden
- 161.0
Population outlook (Brunswick County) Hauer SSP2
- Today (2025)
- 152,111 people
- By 2030
- 165,705 · +8.9%
- By 2040
- 188,494 · +23.9%
- By 2050
- 206,228 · +35.6%
- By 2075
- 237,876 · +56.4%
- By 2100
- 251,451 · +65.3%
Race, ethnicity, and origin ACS 2023
- Neighborhood character
- Predominantly White (89%)
- Race & ethnicity
- White 89% Two or more races 6% Black 4% Hispanic / Latino 3%
- Common ancestry
- Romanian 4% Slovak 3% Serbian 3%
- Foreign-born
- 3% · Canada
- Languages at home
- 96% English-only · Spanish 2%
Political lean MEDSL · Brunswick
- 2024 margin
- Strong R (+24.9) · D 37.2% · R 62.0%
- 2008→2024 swing
- -6.9pp toward R · 2008: -17.9pp · 2024: -24.9pp
- All cycles
- 2024: R+24.9 2020: R+25.0 2016: R+28.7 2012: R+22.2 2008: R+17.9
Not yet ingested
- Civics
- —
Market trends
- HPI YoY
- ▼ -195.19%
- Current HPI
- 142.5667
- Rent YoY
- ▲ 0.74%
- Metro
- Myrtle Beach-Conway-North Myrtle Beach, SC-NC
- State GDP YoY
- ▲ 3.28%
- F500 in state
- 26
Industry mix (Fortune 500 HQ in NC)
| Industry | F500 HQs | Revenue |
|---|---|---|
| Financial Services | 2 | $213B |
|
||
| Retail | 2 | $95B |
|
||
| Industrial Conglomerate | 1 | $38B |
|
||
| Metals / Steel | 1 | $35B |
|
||
| Utilities | 1 | $30B |
|
||
| Industrial Machinery | 1 | $19B |
|
||
Price history
+17.1% since first listed7 events — show timeline
- 2026-03-26 Relisted — Hive MLS
- 2026-03-26 Listing Removed — Hive MLS
- 2026-03-13 Relisted — Hive MLS
- 2026-03-12 Listing Removed — Hive MLS
- 2025-03-17 Listed $72,500 Hive MLS
- 2025-03-11 Listing Removed — Hive MLS
- 2024-09-11 Listed $61,900 Hive MLS
Cash-flow waterfall
monthlySold comps — $/sqft
last 12 mo · ≤1 miLoading sold comps…