 🏗️ New Construction
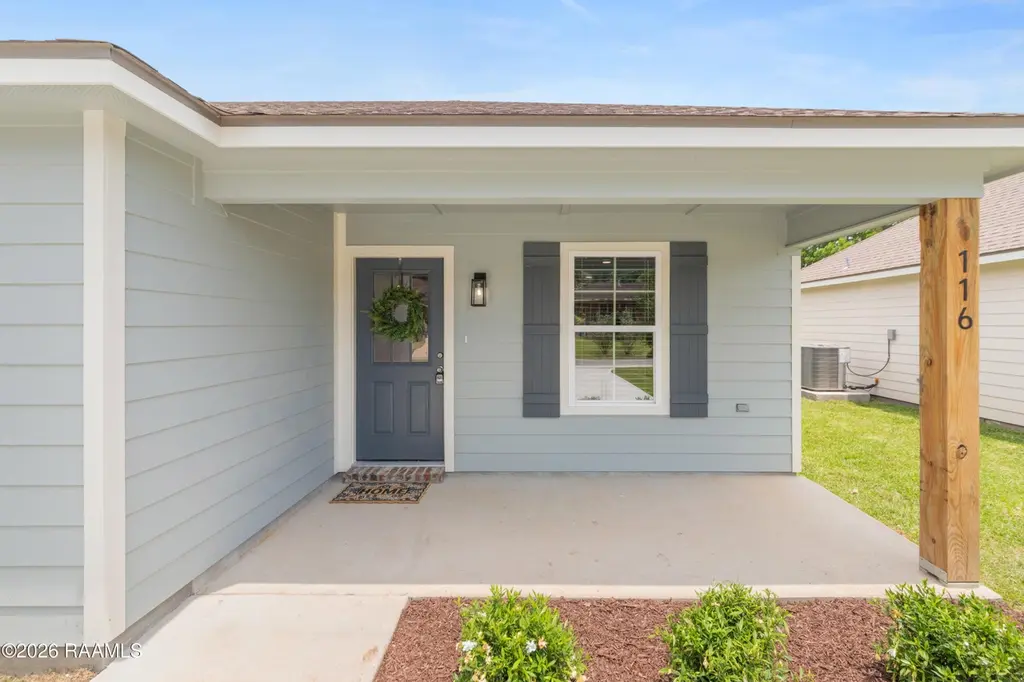
116 Bell North Dr · Lafayette, LA
Flood risk 6/10 · Moderate
- FEMA flood zone
- AE
- Chance of flooding over 30 yrs
- 0.73%
- Est. flood insurance / yr
- $1,737 – $8,500
Fire risk 3/10 · Minor
- Est. fire insurance / yr
- $1,269 – $2,357
Heat risk 8/10 · Major
- Hot days now (above 109°F)
- 7 days/yr
- Hot days in 30 yrs
- 21 days/yr
Wind risk 9/10 · Severe
- Chance of severe wind over 30 yrs
- 99.0%
Air-quality risk 2/10 · Minimal
- Unhealthy air days now
- 1 days/yr
- Unhealthy air days in 30 yrs
- 1 days/yr
Risk factors via First Street. Map © Google.
Why this score? — see what drove the D+ grade
The composite is a weighted blend of 9 inputs, each scored 0–100. Each bar is that input's sub-score; the figure is the points it added to the 100-point composite (weight × sub-score).
- Cash flow +19.1/30.0
- ARV discount +7.5/15.0
- DSCR +6.0/10.0
- 1% rule +5.1/10.0
- Schools +3.6/10.0
- Livability +3.5/5.0
- Rent growth +2.5/5.0
- Condition / age +2.5/5.0
- Appreciation +0.0/10.0
$165,000
🖨 Deal sheet 📄 Offer letter ✓ Due diligence
Listing remarks MLS
Nice lot in established Bell North Subdivision near I-49 off Pont de Mouton. Numerous adjacent lots available. Priced to sell quickly. Build to suit available
Key facts
- 6,534 sq ft lot
- Parking
- Built 2026
Property features AI
Exterior
- Parking: Open parking
- Utilities: Public sewer; City electric
- Home design: Single-family residence; New construction
- Construction: HardiPlank-type siding; Frame construction; Composition roof
- Exterior features: City street frontage
Interior
- Kitchen: Electric stove
- Bathrooms: 2 full bathrooms
- Heating & cooling: Central heating (electric); Central air conditioning
- Interior features: Double pane windows; Electric stove (electric range/connection)
- Laundry & utility: Washer hookup; Electric dryer hookup
Neighborhood map
What this means for you Summary
Snapshot
- This is a 3-bed/2.0-bath land listed at $165k.
Deal economics
- At list price, monthly cash flow is $-293 ($-4k/yr) — negative.
- To cash-flow at today's rent, offer at most $83k (49.5% below list).
- To meet the 1% rule (rent ≥ 1% of price), the offer needs to be $127k (23.1% below list).
- Recommended offer: $83k (49.5% below list) — sets the bar for cash-flow.
- Cap rate 7.6% vs local median 4.7% in Lafayette — top-decile yield for the area; either an underpriced asset or a hidden risk that comps aren't pricing in. Stress-test before assuming the spread holds.
Location & tenants
- Location reads 70/100 on livability (#63 in LA) — a middle-class / working-renter tenant base. Strengths: cost of living A+, housing A+, health & safety A+; Watch: amenities C-, employment C-, crime F.
- Lafayette Parish (urban): math 38% / reading 46% proficiency, ranked #19 of 98 in LA (top 19%) — families likely to look elsewhere, expect single-tenant / working-renter base with shorter leases.
- Zoned schools: Live Oak Elementary School (math 21% / reading 27%, grade F, #402 of 646 statewide, top 63%, 602 students, 82% FRL); Acadian Middle School (math 13% / reading 27%, grade F, #166 of 218 statewide, top 76%, 372 students, 74% FRL); Carencro High School (math 30% / reading 29%, grade F, #127 of 265 statewide, top 49%, 1,096 students, 69% FRL) — zoned schools average 75% FRL vs 56% district-wide (18 pts higher); higher-poverty schools than district average — tighter screening recommended.
- Zoned-school proficiency averages 24% at this address vs 42% district-wide (-18 pts) — the specific schools serving this property underperform the Lafayette Parish average; the district grade overstates school quality for this exact location.
- Market conditions: 324 active listings in the ZIP; 14 comparable units currently listed for rent nearby; rentals at typical pace (median 21d on market — plan ~3-4 weeks tenant-placement turnaround); 1,585 units permitted in Lafayette Parish in 2024 (10 in 5+ unit buildings).
Forward outlook
- Local home prices are declining (-3.0%/yr); year-one equity from $869 of loan paydown is wiped out by about $4k of value loss. Plan a longer hold.
- Lafayette County population projected at +34% by 2050 — long-run rental-demand tailwind backs the buy-and-hold thesis.
Negotiation context
- Only 11 days on market — expect competitive offers; lowballing is unlikely to land.
- 6 sale attempts since 20y ago with the ask held roughly flat each time — persistent listings suggest the price (not the market) is what's stuck; bring a comps-based counter.
- Current owner paid $16k; list at $165k implies a 900% gain — meaningful room to come down on a strong offer.
Risks & watch-outs
- Watch-outs: flood insurance adds $427/mo.
- Climate carrying-cost: in FEMA flood zone AE (mandatory federal flood insurance); severe wind risk, 99% chance of damaging wind over 30y; extreme-heat days projected 7→21/yr by 2055 (HVAC capex compounding) — expect insurance premiums to compound above CPI over the hold.
Questions for the listing agent
- What do current leases actually rent for vs. the listed asking? Can we see a recent rent roll and the last 12 months of T-12 income?
- What's the actual annual flood-insurance premium (NFIP or private), and is the property in a SFHA with mandatory coverage?
- Is there a deadline driving the sale (1031 exchange, divorce, estate, relocation)? That informs how much negotiation room exists.
- Schools are B-rated — typically a magnet for longer-tenancy family renters. What's the average tenant stay here, and is there a school-zone premium baked into asking?
- Crime grade is F in this area — have there been break-ins, vandalism, or insurance claims at this property in the last 3 years? What carrier currently insures it and at what premium?
- The area grade is low — what's the realistic commute time and amenity access for the typical tenant pool here? Any planned neighborhood developments (good or bad) we should know about?
- What's the average days-on-market for RENTAL listings here right now (not sales)? A rising rental-DOM trend means longer vacancies and softer asking-rent achievability than the comps imply.
- What's the recent tenant-quality profile in this submarket — average credit score on applications, eviction rate, late-payment / NSF rate, and stable-employment percentage? A property-management company in the area should have these aggregated.
- How much new for-sale + rental construction is in the pipeline within 1–3 miles? Heavy new supply typically softens prices + rents 12–24 months out; constrained supply supports both.
Investment metrics
- 1% rule
- 1.01% ✓
- Cap rate
- 7.56%
- Cash-on-cash
- 4.54%
- DSCR
- 1.20
- GRM
- 8.3
CMA / ARV
- ARV (median comp)
- $125,727
- List price
- $165,000
- Delta
- 31.24%
- Verdict
- OVERPRICED
- Comps
- 20 within 1.0 mi
Projected returns pro-forma
-3.0% appreciation · 3.0% rent growth · sell at horizon
- IRR
- -33.9%
- Equity multiple
- -0.10×
- Total profit
- $-38,784
- Equity at exit
- $18,746
- IRR
- -40.2%
- Equity multiple
- -0.61×
- Total profit
- $-56,700
- Equity at exit
- $10,871
Cash invested: $35,204 (down + closing). Projections, not guarantees.
Landlord ↔ Tenant lean methodology
- Overall (STATE)
- 90 Strongly Landlord-Friendly
- State Louisiana
- 90 Strongly Landlord-Friendly · R+12
- County
- — inherits STATE
- City
- — inherits STATE
ZIP-level market 70507
- Home prices YoY
- -20.6%
- Active inventory
- 324
- Price-to-rent
- 10.8×
Monthly cashflow live
- Estimated rent
- $1,268 high interval (Pro) →
- Mortgage (P&I)
- −$659
- Tax est. 1.5%
- −$157 /mo · $1,886/yr
- Insurance
- −$52
- Flood insurance flood zone
- −$427 /mo · $5,118/yr
- HOA
- −$0
- Vacancy / Maint / Mgmt
- −$266
- Net cashflow
- $-293
Break-even live
UW: 25.0% down · 7.5% · 30yr · 1.5% tax · 5.0% vac · 8.0% maint · 8.0% mgmt
Financing live
Cash to close
- Down payment
- $31,432
- Closing costs
- $3,772
- Reserves months
- —
- Total cash needed
- —
Loan-product check · same deal, 3 products live
Conventional
25% down · 7.5% · 30yr
- Down + closing
- —
- Monthly P&I
- —
- Monthly cashflow
- —
- DSCR
- —
- Eligible?
- —
Personal DTI + credit; lowest rate.
DSCR
20% down · 8.5% · 30yr
- Down + closing
- —
- Monthly P&I
- —
- Monthly cashflow
- —
- DSCR
- —
- Eligible?
- —
No personal income docs; deal must DSCR.
Hard money
10% down · 12.0% · 12mo
- Down + closing
- —
- Monthly P&I
- —
- Monthly cashflow
- —
- DSCR
- —
- Eligible?
- —
Short-term bridge; refi at stabilization.
Rent comps 14 comps
| Address | Beds | Baths | Sqft | Rent | $/sqft | DOM | Units | Dist |
|---|---|---|---|---|---|---|---|---|
| 200 High Meadows Blvd #121 Lafayette, LA | 2.0 | 1.0 | 800 | $900 | $1.12 | 13d | 1 | 0.45mi |
| 315 Sidney Martin Rd Unit 1 Lafayette, LA | 3.0 | 1.5 | 1218 | $1,400 | $1.15 | 21d | 1 | 0.46mi |
| 201 High Meadows Blvd Unit 208 Lafayette, LA | 2.0 | 1.5 | 900 | $1,100 | $1.22 | 21d | 1 | 0.55mi |
| 106 Rue Royale Apt B Lafayette, LA | 2.0 | 1.5 | 912 | $775 | $0.85 | 13d | 1 | 0.55mi |
| 13 Larkspur Ln Unit 13 Lafayette, LA | 3.0 | 1.5 | 1380 | $1,200 | $0.87 | 43d | 1 | 0.59mi |
| 600 Rim Rd Apt 10 Lafayette, LA | 2.0 | 1.0 | 750 | $750 | $1.00 | 13d | 1 | 0.71mi |
| 111 Banister Ct Lafayette, LA | 1.0–2.0 | 1.0–2.0 | 916 | $1,827 | $1.99 | 13d | 10 | 1.06mi |
| 2830 Louisiana Ave #6 Lafayette, LA | 2.0 | 1.5 | 1100 | $950 | $0.86 | 13d | 1 | 1.19mi |
| 215 Peggy St Lafayette, LA | 3.0 | 2.0 | 1100 | $1,100 | $1.00 | 13d | 1 | 1.27mi |
| 215 Peggy St Lafayette, LA | 3.0 | 2.0 | 1100 | $1,100 | $1.00 | 21d | 1 | 1.27mi |
| 2826 Louisiana Ave #907 Lafayette, LA | 2.0 | 2.5 | 1100 | $950 | $0.86 | 21d | 1 | 1.28mi |
| 2826 Louisiana Ave #1111 Lafayette, LA | 2.0 | 2.0 | 1140 | $1,200 | $1.05 | 44d | 1 | 1.28mi |
| 2820 Louisiana Ave Lafayette, LA | 1.0–2.0 | 1.0–2.0 | 821 | $1,145 | $1.39 | 13d | 20 | 1.31mi |
| 810 Fairmont Ln Lafayette, LA | 3.0 | 1.0 | 1000 | $992 | $0.99 | 43d | 1 | 1.43mi |
Listing history 15 events
-
2026-06-03status $165,000 Pending 11 DOM
-
2026-06-02days on market $165,000 Active 11 DOM
-
2026-06-01days on market $165,000 Active 10 DOM
-
2026-05-31days on market $165,000 Active 9 DOM
-
2026-05-30days on market $165,000 Active 8 DOM
-
2026-05-16$165,000 Active 454-char remark
-
2026-05-14historical $165,000 454-char remark
-
2025-06-24soldstatus $16,500
-
2024-06-21soldstatus $8,000
-
2024-06-20soldstatus $4,000 Sold 160-char remark
Show marketing remark (160 chars)
Nice lot in established Bell North Subdivision near I-49 off Pont de Mouton. Numerous adjacent lots available. Priced to sell quickly. Build to suit available
-
2024-06-08status Pending 160-char remark
Show marketing remark (160 chars)
Nice lot in established Bell North Subdivision near I-49 off Pont de Mouton. Numerous adjacent lots available. Priced to sell quickly. Build to suit available
-
2024-04-02status Active 160-char remark
Show marketing remark (160 chars)
Nice lot in established Bell North Subdivision near I-49 off Pont de Mouton. Numerous adjacent lots available. Priced to sell quickly. Build to suit available
-
2019-08-05$7,000 160-char remark
Show marketing remark (160 chars)
Nice lot in established Bell North Subdivision near I-49 off Pont de Mouton. Numerous adjacent lots available. Priced to sell quickly. Build to suit available
-
2009-04-14$21,000
-
2006-09-29$21,000
ⓘ Source: listings_history table (triggers on properties + properties_extension) + one-shot
backfill from property_details.listing_events for pre-trigger history.
Climate risk First Street
- Flood 6/10 Major FEMA zone AE · 73% chance over 30 yrs
- Wildfire 3/10 Moderate
- Heat 8/10 Severe 7 d/yr ≥109°F today · 21 d/yr by 30 yrs out
- Wind 9/10 Extreme 99% chance of damaging wind over 30 yrs
- Air quality 2/10 Low 1 unhealthy d/yr today · 1 by 30 yrs out
Nearby sold comps map
Loading sold comps map…
Walkable amenities ~0.75 mi
Loading nearby amenities…
Taxation est. · year 1
- Rental income
- $15,219
- − Mortgage interest
- −$7,043
- − Property taxes
- −$1,886
- − Insurance
- −$5,747
- − Repairs & maintenance
- −$1,218
- − Management
- −$1,218
- − Depreciation
- −$3,658
- Taxable loss
- −$5,549
- Est. tax savings @ 24.0%
- +$1,332
- After-tax cash flow
- $-2,190/yr
For passive investors: Depreciation is non-cash, so a rental often shows a tax loss while cash-flowing — sheltering income. Rental losses are passive: they offset passive income freely, and up to $25,000/yr can offset ordinary (W-2) income if you actively participate and your MAGI is under $100k (phasing out to $0 by $150k); unused losses carry forward. On sale, claimed depreciation is recaptured at up to 25%, and gains may owe capital-gains tax (a 1031 exchange can defer both). Figures are a year-1 estimate at your 24.0% rate — not tax advice; consult a CPA.
Schools (NCES district)
- District
- Lafayette Parish
- NCES district ID
- 2200870
- Math proficiency
- 38% ▼ -32.00%
- Reading proficiency
- 46% ▼ -24.00%
- Median HH income
- $50,238
- Composite
- 36.15/100
- National rank
- #4741
- State rank
- #19 of 98 in LA
Livability — Lafayette
- Score
- 70/100
- State rank
- #63
- US rank
- #8133
Category grades
Schools grade is shown separately in the Schools card above.
Census & demographics
- Census place
- Lafayette, LA
- County
- Lafayette Parish · 207,544 people
- City population
- 158,114
- Metro
- Lafayette, LA
- Population (ZIP)
- 20,096
- Household income
- $64,049
- Rent vs Own
- Severe rent burden
- 503.0
Population outlook (Lafayette County) Hauer SSP2
- Today (2025)
- 280,930 people
- By 2030
- 301,092 · +7.2%
- By 2040
- 339,456 · +20.8%
- By 2050
- 375,156 · +33.5%
- By 2075
- 451,672 · +60.8%
- By 2100
- 497,203 · +77.0%
Race, ethnicity, and origin ACS 2023
- Neighborhood character
- Diverse neighborhood (Simpson 0.57)
- Race & ethnicity
- Black 47% White 45% Two or more races 6% Hispanic / Latino 3%
- Common ancestry
- Lithuanian 15%
- Foreign-born
- 2% · Canada
- Languages at home
- 94% English-only · French/Haitian/Cajun 4% Spanish 2%
Political lean MEDSL · Lafayette
- 2024 margin
- Solid R (+31.4) · D 33.5% · R 64.8% · Other 1.7%
- 2008→2024 swing
- -0.1pp no change · 2008: -31.3pp · 2024: -31.4pp
- All cycles
- 2024: R+31.4 2020: R+28.7 2016: R+33.6 2012: R+33.7 2008: R+31.3
Not yet ingested
- Civics
- —
Market trends
- HPI YoY
- ▼ -40.84%
- Current HPI
- 156.889
- Rent YoY
- —
- Metro
- Lafayette, LA
- State GDP YoY
- ▲ 3.29%
- F500 in state
- 10
Industry mix (Fortune 500 HQ in LA)
| Industry | F500 HQs | Revenue |
|---|---|---|
| Telecommunications | 2 | $23B |
|
||
| Utilities | 1 | $12B |
|
||
| Wholesale / Distribution | 1 | $5B |
|
||
| Advertising | 1 | $2B |
|
||
Price history
+685.7% since first listed13 events — show timeline
- 2026-06-02 Pending — AcadianaMLS
- 2026-05-25 Relisted — AcadianaMLS
- 2026-05-19 Pending — AcadianaMLS
- 2026-05-16 Listed $165,000 AcadianaMLS
- 2026-05-14 Coming Soon $165,000 AcadianaMLS
- 2025-06-24 Sold (Public Records) $16,500 Public Records
- 2024-06-21 Sold (Public Records) $8,000 Public Records
- 2024-06-20 Sold (MLS) $4,000 AcadianaMLS
- 2024-06-08 Pending — AcadianaMLS
- 2024-04-02 Relisted — AcadianaMLS
- 2019-08-05 Listed $7,000 AcadianaMLS
- 2009-04-14 Listed $21,000 AcadianaMLS
- 2006-09-29 Listed $21,000 AcadianaMLS
Property tax history
+0.3%/yrLatest (2025): $97 · -1.1% YoY. Source: county tax records.
Cash-flow waterfall
monthlySold comps — $/sqft
last 12 mo · ≤1 miLoading sold comps…