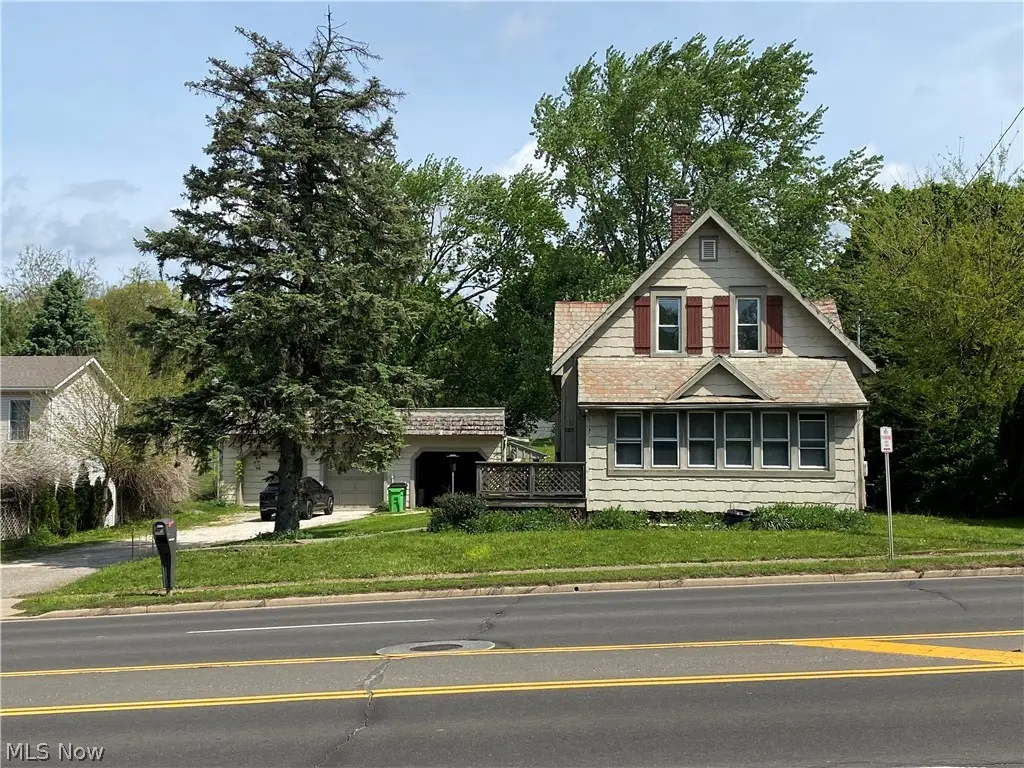
1023 Applegrove St NW · North Canton, OH
Flood risk 1/10 · Minimal
- FEMA flood zone
- X (unshaded)
- Chance of flooding over 30 yrs
- 0.0%
- Est. flood insurance / yr
- $473 – $860
Fire risk 1/10 · Minimal
- Est. fire insurance / yr
- $713 – $1,323
Heat risk 3/10 · Minor
- Hot days now (above 96°F)
- 7 days/yr
- Hot days in 30 yrs
- 17 days/yr
Wind risk 1/10 · Minimal
- Chance of severe wind over 30 yrs
- —
Air-quality risk 2/10 · Minimal
- Unhealthy air days now
- 1 days/yr
- Unhealthy air days in 30 yrs
- 2 days/yr
Risk factors via First Street. Map © Google.
Why this score? — see what drove the B- grade
The composite is a weighted blend of 9 inputs, each scored 0–100. Each bar is that input's sub-score; the figure is the points it added to the 100-point composite (weight × sub-score).
- Cash flow +22.5/30.0
- ARV discount +15.0/15.0
- DSCR +7.2/10.0
- Schools +6.7/10.0
- 1% rule +6.0/10.0
- Livability +4.2/5.0
- Rent growth +2.7/5.0
- Condition / age +2.5/5.0
- Appreciation +0.0/10.0
$130,000
🖨 Deal sheet 📄 Offer letter ✓ Due diligence
Listing remarks
Opportunity awaits in a prime North Canton location! This 4-bedroom, 2-bath home offers endless potential and is ready for your personal touch. The 45x39 garage provides ample space for vehicles, equipment, or a dream workshop. Located in North Canton schools, this property is perfect for homeowners or investors. Bring your contrator and take a look!
Key facts
- North canton schools
- 45x39 garage
- 0.59 acre lot
Tags
Property features AI
Exterior
- Parking: Attached garage with 3 spaces
- Utilities: Public water; Public sewer
- Home design: Fixer condition; Slate roof
- Construction: Wood siding construction; Slate roof
- Exterior features: Wood siding; Lot approximately 0.59 acres
Interior
- Bedrooms: One main-level bedroom
- Bathrooms: One full bathroom; One half bathroom; One main-level bathroom
- Heating & cooling: Central air conditioning; Forced-air gas heating
- Interior features: Unfinished basement; Fireplace (1)
Neighborhood map
What this means for you Summary
Snapshot
- This is a 3-bed/2.0-bath single-family listed at $130k.
Deal economics
- At list price, monthly cash flow is $218 ($3k/yr) — positive.
- The deal already cash-flows at list — no discount required.
- Meets the 1% rule at list price ($1k rent vs $130k).
- Cap rate 8.3% vs local median 4.1% in North Canton — top-decile yield for the area; either an underpriced asset or a hidden risk that comps aren't pricing in. Stress-test before assuming the spread holds.
Location & tenants
- Location reads 85/100 on livability (#44 in OH, #598 nationally) — a professional / high-income tenant draw. Strengths: schools A+, crime A+, cost of living A+; Watch: amenities D-, commute F.
- North Canton City (suburban): math 77% / reading 79% proficiency, ranked #64 of 656 in OH (top 10%) — strong family-tenant draw, lease renewals of 3-5y typical; only 16% free/reduced lunch — higher-income household profile.
- Market conditions: Rents flat; 226 active listings in the ZIP; 14 comparable units currently listed for rent nearby; rentals lingering (median 44d on market — plan ~5-8 weeks vacancy on turnover, expect pricing pressure); 57% of comp listings sitting > 30 days — soft ceiling on asking rent; solid renter incomes; 528 units permitted in Stark County in 2024 (84 in 5+ unit buildings).
Forward outlook
- Local home prices are declining (-3.0%/yr); year-one equity from $899 of loan paydown is wiped out by about $4k of value loss. Plan a longer hold.
- Stark County population projected to shrink 8% by 2050 — rents likely to lag national; underwrite the cash flow, not the appreciation.
Negotiation context
- Only 9 days on market — expect competitive offers; lowballing is unlikely to land.
- 2 sale attempts since 13y ago with the ask held roughly flat each time — persistent listings suggest the price (not the market) is what's stuck; bring a comps-based counter.
- Current owner paid $68k; list at $130k implies a 90% gain — meaningful room to come down on a strong offer.
Risks & watch-outs
- Watch-outs: built in 1907 — expect roof / HVAC / electrical / plumbing capex.
Questions for the listing agent
- Built in 1907 — when were the roof, HVAC, electrical panel, plumbing, and water heater last replaced?
- Is there a deadline driving the sale (1031 exchange, divorce, estate, relocation)? That informs how much negotiation room exists.
- Schools are A-rated — typically a magnet for longer-tenancy family renters. What's the average tenant stay here, and is there a school-zone premium baked into asking?
- What's the average days-on-market for RENTAL listings here right now (not sales)? A rising rental-DOM trend means longer vacancies and softer asking-rent achievability than the comps imply.
- What's the recent tenant-quality profile in this submarket — average credit score on applications, eviction rate, late-payment / NSF rate, and stable-employment percentage? A property-management company in the area should have these aggregated.
- How much new for-sale + rental construction is in the pipeline within 1–3 miles? Heavy new supply typically softens prices + rents 12–24 months out; constrained supply supports both.
Investment metrics
- 1% rule
- 1.10% ✓
- Cap rate
- 8.31%
- Cash-on-cash
- 7.19%
- DSCR
- 1.32
- GRM
- 7.5
CMA / ARV
- ARV (median comp)
- $213,308
- List price
- $130,000
- Delta
- -39.06%
- Verdict
- UNDERPRICED
- Comps
- 20 within 1.0 mi
Show comp detail 9 sales within ~0.75 mi
| Address | Dist | Beds/Ba | Sqft | Sold | Price | $/sf | Match |
|---|---|---|---|---|---|---|---|
| 1275 Janet Ave NW | 0.12mi | 2/1.5 (-1) | 1,354 (+12%) | 8mo | $233,500 | $172 | 61 |
| 401 9th St NW | 0.65mi | 3/2.0 | 1,200 (-1%) | 12mo | $233,000 | $194 | 58 |
| 1120 Janet Ave NW | 0.22mi | 3/2.0 | 1,324 (+9%) | 23mo | $185,000 | $140 | 55 |
| 608 Werstler Ave NW | 0.62mi | 3/1.0 | 1,260 (+4%) | 6mo | $197,500 | $157 | 55 |
| 1232 Valley Dr NW | 0.72mi | 3/2.0 | 1,239 (+2%) | 10mo | $219,900 | $177 | 54 |
| 804 Werstler Ave NW | 0.55mi | 3/1.0 | 1,260 (+4%) | 24mo | $200,000 | $159 | 44 |
| 519 Emerson Ave NW | 0.59mi | 3/2.0 | 1,305 (+8%) | 20mo | $220,000 | $169 | 43 |
| 950 Werstler Ave NW | 0.51mi | 3/2.5 | 1,326 (+9%) | 23mo | $250,000 | $189 | 39 |
| 1314 Valley Dr NW | 0.68mi | 3/1.0 | 1,080 (-11%) | 17mo | $200,000 | $185 | 32 |
Match score weights: distance 35% · size 25% · config 20% · recency 20%. Top-matched comps best support the ARV.
Projected returns pro-forma
-3.0% appreciation · 0.82% rent growth · sell at horizon
- IRR
- -7.8%
- Equity multiple
- 0.72×
- Total profit
- $-10,227
- Equity at exit
- $19,383
- IRR
- -1.3%
- Equity multiple
- 0.92×
- Total profit
- $-2,993
- Equity at exit
- $11,240
Cash invested: $36,400 (down + closing). Projections, not guarantees.
Landlord ↔ Tenant lean methodology
- Overall (STATE)
- 73 Landlord-Friendly
- State Ohio
- 73 Landlord-Friendly · R+6
- County
- — inherits STATE
- City
- — inherits STATE
ZIP-level market 44720
- Rents YoY
- 0.8%
- Active inventory
- 226
- Price-to-rent
- 7.5×
Monthly cashflow live
- Estimated rent
- $1,435 high interval (Pro) →
- Mortgage (P&I)
- −$682
- Tax from tax record
- −$180 /mo · $2,156/yr
- Insurance
- −$54
- HOA
- −$0
- Vacancy / Maint / Mgmt
- −$301
- Net cashflow
- $218
Break-even live
UW: 25.0% down · 7.5% · 30yr · 1.5% tax · 5.0% vac · 8.0% maint · 8.0% mgmt
Financing live
Cash to close
- Down payment
- $32,500
- Closing costs
- $3,900
- Reserves months
- —
- Total cash needed
- —
Loan-product check · same deal, 3 products live
Conventional
25% down · 7.5% · 30yr
- Down + closing
- —
- Monthly P&I
- —
- Monthly cashflow
- —
- DSCR
- —
- Eligible?
- —
Personal DTI + credit; lowest rate.
DSCR
20% down · 8.5% · 30yr
- Down + closing
- —
- Monthly P&I
- —
- Monthly cashflow
- —
- DSCR
- —
- Eligible?
- —
No personal income docs; deal must DSCR.
Hard money
10% down · 12.0% · 12mo
- Down + closing
- —
- Monthly P&I
- —
- Monthly cashflow
- —
- DSCR
- —
- Eligible?
- —
Short-term bridge; refi at stabilization.
Rent comps 14 comps
| Address | Beds | Baths | Sqft | Rent | $/sqft | DOM | Units | Dist |
|---|---|---|---|---|---|---|---|---|
| 1303 N Main St North Canton, OH | 2.0 | 2.0 | 1000 | $1,415 | $1.42 | 43d | 1 | 0.54mi |
| 1113 N Main St North Canton, OH | 2.0 | 1.0 | 565 | $1,090 | $1.93 | 43d | 1 | 0.56mi |
| 415 Sheraton Dr NW Unit 415 North Canton, OH | 2.0 | 1.5 | 1200 | $1,269 | $1.06 | 13d | 1 | 0.70mi |
| 407 Sheraton Dr NW Unit 407 North Canton, OH | 2.0 | 1.5 | 1200 | $1,269 | $1.06 | 13d | 1 | 0.72mi |
| 171 Applegrove St NE North Canton, OH | 1.0–2.0 | 1.0–2.0 | 1100 | $1,590 | $1.45 | 43d | 1 | 0.75mi |
| 285 Wilbur Dr NE North Canton, OH | 1.0–2.0 | 1.0 | 908 | $1,230 | $1.35 | 43d | 1 | 0.80mi |
| 4640 Applegrove St NW North Canton, OH | 2.0 | 1.5 | 1000 | $1,199 | $1.20 | 43d | 1 | 0.88mi |
| 1101 W Maple St Unit 4 Canton, OH | 2.0 | 1.0 | 800 | $1,099 | $1.37 | 13d | 1 | 0.98mi |
| 1105 W Maple St Unit 1105-5 North Canton, OH | 2.0 | 1.0 | 800 | $1,099 | $1.37 | 20d | 1 | 0.99mi |
| 3617 Mount Pleasant St NW Unit 3617 North Canton, OH | 3.0 | 1.5 | 1310 | $1,350 | $1.03 | 43d | 1 | 1.08mi |
| 8523 Pleasantwood Ave NW North Canton, OH | 2.0 | 1.5 | 1200 | $1,300 | $1.08 | 43d | 1 | 1.19mi |
| 999999 Applegrove St North Canton, OH | 2.0 | 2.0 | 1100 | $1,682 | $1.53 | 43d | 1 | 1.24mi |
| 343 Pershing Ave NE North Canton, OH | 2.0 | 1.0 | 1000 | $1,099 | $1.10 | 20d | 1 | 1.38mi |
| 327 Pershing Ave NE Unit 327 North Canton, OH | 2.0 | 1.0 | 800 | $1,099 | $1.37 | 13d | 1 | 1.41mi |
Listing history 5 events
-
2026-05-11$130,000 Active 352-char remark
-
2014-02-12historical
-
2013-10-11$169,900
-
1993-02-05soldstatus $68,400
-
1992-07-24soldstatus $55,000
ⓘ Source: listings_history table (triggers on properties + properties_extension) + one-shot
backfill from property_details.listing_events for pre-trigger history.
Tax reassessment forecast OH · Partial reset (capped growth)
- Current annual tax
- $2,156 · $180/mo
- Projected year-2 tax
- $2,156 · $180/mo
- Expected delta
- $0/yr ($0/mo · 0.0%)
ⓘ Screening estimate from a state-policy table — verify with the county assessor before closing.
Climate risk First Street
- Flood 1/10 Low FEMA zone X (unshaded) · 0% chance over 30 yrs
- Wildfire 1/10 Low
- Heat 3/10 Moderate 7 d/yr ≥96°F today · 17 d/yr by 30 yrs out
- Wind 1/10 Low
- Air quality 2/10 Low 1 unhealthy d/yr today · 2 by 30 yrs out
Nearby sold comps map
Loading sold comps map…
Walkable amenities ~0.75 mi
Loading nearby amenities…
Taxation est. · year 1
- Rental income
- $17,220
- − Mortgage interest
- −$7,282
- − Property taxes
- −$2,156
- − Insurance
- −$650
- − Repairs & maintenance
- −$1,378
- − Management
- −$1,378
- − Depreciation
- −$3,782
- Taxable income
- $594
- Est. tax owed @ 24.0%
- −$143
- After-tax cash flow
- $2,474/yr
For passive investors: Depreciation is non-cash, so a rental often shows a tax loss while cash-flowing — sheltering income. Rental losses are passive: they offset passive income freely, and up to $25,000/yr can offset ordinary (W-2) income if you actively participate and your MAGI is under $100k (phasing out to $0 by $150k); unused losses carry forward. On sale, claimed depreciation is recaptured at up to 25%, and gains may owe capital-gains tax (a 1031 exchange can defer both). Figures are a year-1 estimate at your 24.0% rate — not tax advice; consult a CPA.
Schools (NCES district)
- District
- North Canton City
- NCES district ID
- 3904450
- Math proficiency
- 77% ▼ -6.00%
- Reading proficiency
- 79% ▼ -4.00%
- Median HH income
- $59,644
- Composite
- 66.92/100
- National rank
- #400
- State rank
- #64 of 656 in OH
Livability — North Canton
- Score
- 85/100
- State rank
- #44
- US rank
- #598
Category grades
Schools grade is shown separately in the Schools card above.
Census & demographics
- Census place
- North Canton, OH
- County
- Stark County · 272,865 people
- City population
- 39,851
- Metro
- Canton-Massillon, OH
- Population (ZIP)
- 39,851
- Household income
- $82,594
- Rent vs Own
- Severe rent burden
- 1068.0
Population outlook (Stark County) Hauer SSP2
- Today (2025)
- 373,708 people
- By 2030
- 371,245 · -0.7%
- By 2040
- 361,331 · -3.3%
- By 2050
- 345,290 · -7.6%
- By 2075
- 302,669 · -19.0%
- By 2100
- 238,870 · -36.1%
Race, ethnicity, and origin ACS 2023
- Neighborhood character
- Predominantly White (92%)
- Race & ethnicity
- White 92% Two or more races 3% Hispanic / Latino 2% Black 2% Asian 2%
- Common ancestry
- Romanian 5% Italian 4% Lithuanian 3%
- Foreign-born
- 3% · Canada, China
- Languages at home
- 97% English-only · Spanish 1% Other Indo-European 1%
Political lean MEDSL · Stark
- 2024 margin
- Strong R (+21.9) · D 38.6% · R 60.5%
- 2008→2024 swing
- -27.4pp toward R · 2008: 5.5pp · 2024: -21.9pp
- All cycles
- 2024: R+21.9 2020: R+18.5 2016: R+17.4 2012: R+0.4 2008: D+5.5
Not yet ingested
- Civics
- —
Market trends
- HPI YoY
- ▼ -218.69%
- Current HPI
- 215.4995
- Rent YoY
- ▲ 0.82%
- Metro
- Canton-Massillon, OH
- State GDP YoY
- ▲ 1.98%
- F500 in state
- 48
Industry mix (Fortune 500 HQ in OH)
| Industry | F500 HQs | Revenue |
|---|---|---|
| Insurance | 3 | $145B |
|
||
| Industrial Machinery | 3 | $49B |
|
||
| Financial Services | 3 | $24B |
|
||
| Consumer Goods | 2 | $93B |
|
||
| Aerospace / Defense | 2 | $47B |
|
||
| Utilities | 2 | $33B |
|
||
Price history
+136.4% since first listed6 events — show timeline
- 2026-05-20 Pending — MLSNOW
- 2026-05-11 Listed $130,000 MLSNOW
- 2014-02-12 Listing Removed — MLSNOW
- 2013-10-11 Listed $169,900 MLSNOW
- 1993-02-05 Sold (Public Records) $68,400 Public Records
- 1992-07-24 Sold (Public Records) $55,000 Public Records
Property tax history
+3.5%/yrLatest (2024): $2,156 · +23.0% YoY. Source: county tax records.
Cash-flow waterfall
monthlySold comps — $/sqft
last 12 mo · ≤1 miLoading sold comps…