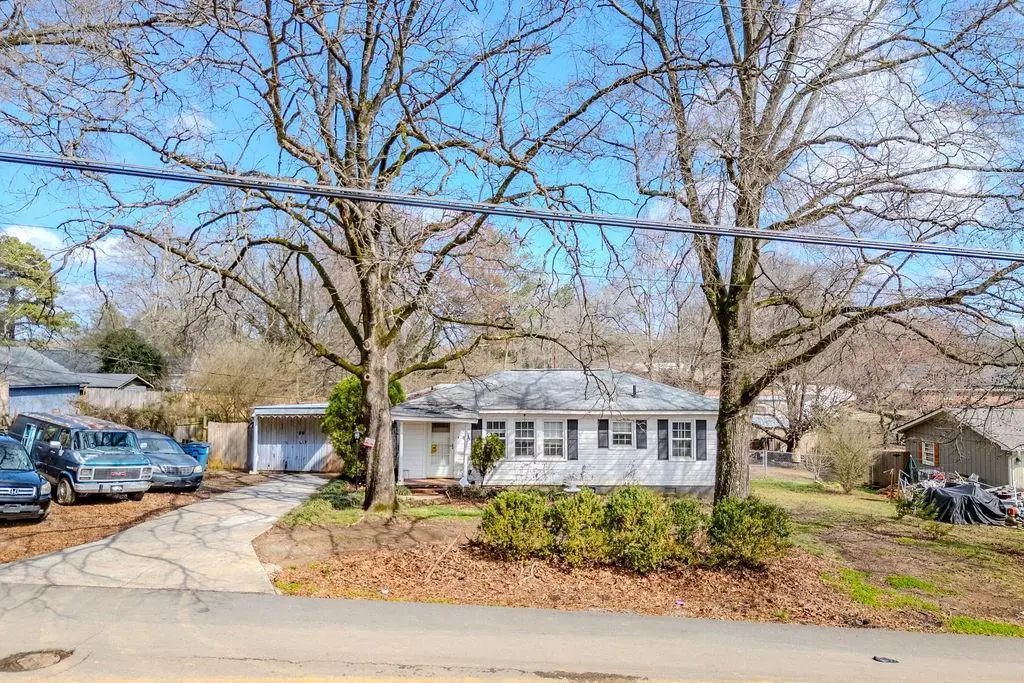
8 Pinecrest Dr NW · Rome, GA
Flood risk 1/10 · Minimal
- FEMA flood zone
- X (unshaded)
- Chance of flooding over 30 yrs
- 0.0%
- Est. flood insurance / yr
- $507 – $1,088
Fire risk 4/10 · Minor
- Est. fire insurance / yr
- $963 – $1,789
Heat risk 6/10 · Moderate
- Hot days now (above 104°F)
- 7 days/yr
- Hot days in 30 yrs
- 19 days/yr
Wind risk 4/10 · Minor
- Chance of severe wind over 30 yrs
- 16.0%
Air-quality risk 3/10 · Minor
- Unhealthy air days now
- 2 days/yr
- Unhealthy air days in 30 yrs
- 3 days/yr
Risk factors via First Street. Map © Google.
Why this score? — see what drove the C grade
The composite is a weighted blend of 9 inputs, each scored 0–100. Each bar is that input's sub-score; the figure is the points it added to the 100-point composite (weight × sub-score).
- Cash flow +20.0/30.0
- ARV discount +15.0/15.0
- DSCR +6.3/10.0
- 1% rule +4.8/10.0
- Schools +3.5/10.0
- Livability +3.2/5.0
- Rent growth +2.9/5.0
- Condition / age +2.5/5.0
- Appreciation +0.0/10.0
$149,900
🖨 Deal sheet 📄 Offer letter ✓ Due diligence
Listing remarks MLS
3 bedroom, 2 bath home with hardwood floors and strong investment potential. Property will require repairs and updates and is being sold as-is. Ideal opportunity for investors or buyers looking to renovate and add value. Features include a fenced yard and multiple outbuildings for storage. Functional layout with solid bones. Bring your contractor and vision—great potential for rental portfolio or resale project.
Key facts
- Fenced yard
- Hardwood floors
- 0.33 acre lot
Tags
Neighborhood map
What this means for you Summary
Snapshot
- This is a 3-bed/1.0-bath single-family listed at $150k.
Deal economics
- At list price, monthly cash flow is $183 ($2k/yr) — positive.
- The deal already cash-flows at list — no discount required.
- To meet the 1% rule (rent ≥ 1% of price), the offer needs to be $147k (1.7% below list).
- Recommended offer: $136k (9.0% below list) — sets the bar for market timing.
- Cap rate 7.8% vs local median 3.3% in Rome — top-decile yield for the area; either an underpriced asset or a hidden risk that comps aren't pricing in. Stress-test before assuming the spread holds.
Location & tenants
- Location reads 64/100 on livability (#266 in GA) — a middle-class / working-renter tenant base. Strengths: cost of living A+, housing A+, health & safety A+; Watch: schools F, crime F, amenities F.
- Floyd County (rural): math 41% / reading 40% proficiency, ranked #45 of 174 in GA (top 26%) — families likely to look elsewhere, expect single-tenant / working-renter base with shorter leases.
- Market conditions: Rents rising (+1.7%/yr); 369 active listings in the ZIP; 355 units permitted in Floyd County in 2024 (0 in 5+ unit buildings).
Forward outlook
- Local home prices are declining (-3.0%/yr); year-one equity from $1k of loan paydown is wiped out by about $4k of value loss. Plan a longer hold.
- Floyd County population projected to shrink 6% by 2050 — rents likely to lag national; underwrite the cash flow, not the appreciation.
Negotiation context
- It's been on market 97 days — a 9% lower offer ($136k) is reasonable based on typical stale-listing flexibility.
- 4 sale attempts since 11y ago with the ask held roughly flat each time — persistent listings suggest the price (not the market) is what's stuck; bring a comps-based counter.
- Current owner paid $68k; list at $150k implies a 119% gain — meaningful room to come down on a strong offer.
Risks & watch-outs
- Watch-outs: built in 1958 — expect roof / HVAC / electrical / plumbing capex.
- Climate carrying-cost: extreme-heat days projected 7→19/yr by 2055 (HVAC capex compounding) — expect insurance premiums to compound above CPI over the hold.
Questions for the listing agent
- It's been on market 97 days. Have you received any prior offers? Is the seller open to a 9% concession, seller financing, or rate buy-down credit?
- Built in 1958 — when were the roof, HVAC, electrical panel, plumbing, and water heater last replaced?
- Why hasn't it sold? Are there any deal-killer items the seller is aware of (foundation, flood, title, zoning, code violations)?
- Is there a deadline driving the sale (1031 exchange, divorce, estate, relocation)? That informs how much negotiation room exists.
- Schools are F-rated, which usually means shorter tenancies and higher turnover. Who's the typical renter profile here, and what's been the actual vacancy rate?
- Crime grade is F in this area — have there been break-ins, vandalism, or insurance claims at this property in the last 3 years? What carrier currently insures it and at what premium?
- What's the average days-on-market for RENTAL listings here right now (not sales)? A rising rental-DOM trend means longer vacancies and softer asking-rent achievability than the comps imply.
- What's the recent tenant-quality profile in this submarket — average credit score on applications, eviction rate, late-payment / NSF rate, and stable-employment percentage? A property-management company in the area should have these aggregated.
- How much new for-sale + rental construction is in the pipeline within 1–3 miles? Heavy new supply typically softens prices + rents 12–24 months out; constrained supply supports both.
Investment metrics
- 1% rule
- 0.98% ✗
- Cap rate
- 7.76%
- Cash-on-cash
- 5.24%
- DSCR
- 1.23
- GRM
- 8.5
CMA / ARV
- ARV (median comp)
- $191,831
- List price
- $149,900
- Delta
- -21.86%
- Verdict
- UNDERPRICED
- Comps
- 20 within 1.0 mi
Show comp detail 6 sales within ~0.75 mi
| Address | Dist | Beds/Ba | Sqft | Sold | Price | $/sf | Match |
|---|---|---|---|---|---|---|---|
| 8 Lake Park Dr NW | 0.56mi | 3/1.0 | 1,188 (-1%) | 17mo | $195,000 | $164 | 58 |
| 30 Atwood Dr NW | 0.73mi | 3/2.0 | 1,224 (+2%) | 3mo | $232,000 | $190 | 57 |
| 100 S Avery Rd SW | 0.63mi | 3/2.0 | 1,320 (+10%) | 3mo | $335,000 | $254 | 48 |
| 39 Leisure Dr NW | 0.64mi | 3/2.0 | 1,293 (+7%) | 12mo | $245,000 | $189 | 44 |
| 42 Leisure Dr NW | 0.64mi | 3/2.0 | 1,302 (+8%) | 17mo | $221,500 | $170 | 38 |
| 26 Fairhaven Dr | 0.53mi | 3/1.5 | 1,060 (-12%) | 23mo | $225,000 | $212 | 34 |
Match score weights: distance 35% · size 25% · config 20% · recency 20%. Top-matched comps best support the ARV.
Projected returns pro-forma
-3.0% appreciation · 1.71% rent growth · sell at horizon
- IRR
- -9.6%
- Equity multiple
- 0.65×
- Total profit
- $-14,508
- Equity at exit
- $22,351
- IRR
- -1.9%
- Equity multiple
- 0.88×
- Total profit
- $-5,189
- Equity at exit
- $12,961
Cash invested: $41,972 (down + closing). Projections, not guarantees.
Landlord ↔ Tenant lean methodology
- Overall (STATE)
- 90 Strongly Landlord-Friendly
- State Georgia
- 90 Strongly Landlord-Friendly · R+3
- County
- — inherits STATE
- City
- — inherits STATE
ZIP-level market 30165
- Home prices YoY
- -24.6%
- Rents YoY
- 1.7%
- Active inventory
- 369
- Price-to-rent
- 8.5×
Monthly cashflow live
- Estimated rent
- $1,473 medium interval (Pro) →
- Mortgage (P&I)
- −$786
- Tax from tax record
- −$132 /mo · $1,584/yr
- Insurance
- −$62
- HOA
- −$0
- Vacancy / Maint / Mgmt
- −$309
- Net cashflow
- $183
Break-even live
UW: 25.0% down · 7.5% · 30yr · 1.5% tax · 5.0% vac · 8.0% maint · 8.0% mgmt
Financing live
Cash to close
- Down payment
- $37,475
- Closing costs
- $4,497
- Reserves months
- —
- Total cash needed
- —
Loan-product check · same deal, 3 products live
Conventional
25% down · 7.5% · 30yr
- Down + closing
- —
- Monthly P&I
- —
- Monthly cashflow
- —
- DSCR
- —
- Eligible?
- —
Personal DTI + credit; lowest rate.
DSCR
20% down · 8.5% · 30yr
- Down + closing
- —
- Monthly P&I
- —
- Monthly cashflow
- —
- DSCR
- —
- Eligible?
- —
No personal income docs; deal must DSCR.
Hard money
10% down · 12.0% · 12mo
- Down + closing
- —
- Monthly P&I
- —
- Monthly cashflow
- —
- DSCR
- —
- Eligible?
- —
Short-term bridge; refi at stabilization.
Listing history 28 events
-
2026-06-10status $149,900 Pending 97 DOM
-
2026-06-09days on market $149,900 Active 97 DOM
-
2026-06-08days on market $149,900 Active 96 DOM
-
2026-06-07days on market $149,900 Active 95 DOM
-
2026-06-03days on market $149,900 Active 91 DOM
-
2026-06-02days on market $149,900 Active 90 DOM
-
2026-06-01days on market $149,900 Active 89 DOM
-
2026-05-31days on market $149,900 Active 88 DOM
-
2026-05-30days on market $149,900 Active 87 DOM
-
2026-04-21price $149,900 421-char remark
Show marketing remark (415 chars)
3 bedroom, 2 bath home with hardwood floors and strong investment potential. Property will require repairs and updates and is being sold as-is. Ideal opportunity for investors or buyers looking to renovate and add value. Features include a fenced yard and multiple outbuildings for storage. Functional layout with solid bones. Bring your contractor and vision-great potential for rental portfolio or resale project.
-
2026-04-21price $149,900 415-char remark
Show marketing remark (415 chars)
3 bedroom, 2 bath home with hardwood floors and strong investment potential. Property will require repairs and updates and is being sold as-is. Ideal opportunity for investors or buyers looking to renovate and add value. Features include a fenced yard and multiple outbuildings for storage. Functional layout with solid bones. Bring your contractor and vision-great potential for rental portfolio or resale project.
-
2026-03-04$154,713 Active 421-char remark
Show marketing remark (421 chars)
3 bedroom, 2 bath home with hardwood floors and strong investment potential. Property will require repairs and updates and is being sold as-is. Ideal opportunity for investors or buyers looking to renovate and add value. Features include a fenced yard and multiple outbuildings for storage. Functional layout with solid bones. Bring your contractor and vision—great potential for rental portfolio or resale project.
-
2026-03-03$154,713 New 415-char remark
Show marketing remark (415 chars)
3 bedroom, 2 bath home with hardwood floors and strong investment potential. Property will require repairs and updates and is being sold as-is. Ideal opportunity for investors or buyers looking to renovate and add value. Features include a fenced yard and multiple outbuildings for storage. Functional layout with solid bones. Bring your contractor and vision-great potential for rental portfolio or resale project.
-
2016-03-17price $64,900
-
2016-03-05price $64,900
-
2016-02-29soldstatus $68,500
-
2016-02-26soldstatus $68,500 Sold
-
2016-02-26soldstatus $68,500 Sold
-
2015-08-20historical Pending
-
2015-08-19status Under Contract
-
2015-08-19price $68,500
-
2015-07-17price $64,900
-
2015-07-17price $64,900
-
2015-07-17price $68,500
-
2015-04-27price $69,900
-
2015-04-27price $69,900
-
2015-01-30$75,000 Active
-
2015-01-28$75,000 New
ⓘ Source: listings_history table (triggers on properties + properties_extension) + one-shot
backfill from property_details.listing_events for pre-trigger history.
Tax reassessment forecast GA · Resets to sale price
- Current annual tax
- $1,584 · $132/mo
- Projected year-2 tax
- $1,584 · $132/mo
- Expected delta
- $0/yr ($0/mo · 0.0%)
ⓘ Screening estimate from a state-policy table — verify with the county assessor before closing.
Climate risk First Street
- Flood 1/10 Low FEMA zone X (unshaded) · 0% chance over 30 yrs
- Wildfire 4/10 Moderate
- Heat 6/10 Major 7 d/yr ≥104°F today · 19 d/yr by 30 yrs out
- Wind 4/10 Moderate 16% chance of damaging wind over 30 yrs
- Air quality 3/10 Moderate 2 unhealthy d/yr today · 3 by 30 yrs out
Nearby sold comps map
Loading sold comps map…
Walkable amenities ~0.75 mi
Loading nearby amenities…
Taxation est. · year 1
- Rental income
- $17,681
- − Mortgage interest
- −$8,397
- − Property taxes
- −$1,584
- − Insurance
- −$750
- − Repairs & maintenance
- −$1,414
- − Management
- −$1,414
- − Depreciation
- −$4,361
- Taxable loss
- −$239
- Est. tax savings @ 24.0%
- +$57
- After-tax cash flow
- $2,258/yr
For passive investors: Depreciation is non-cash, so a rental often shows a tax loss while cash-flowing — sheltering income. Rental losses are passive: they offset passive income freely, and up to $25,000/yr can offset ordinary (W-2) income if you actively participate and your MAGI is under $100k (phasing out to $0 by $150k); unused losses carry forward. On sale, claimed depreciation is recaptured at up to 25%, and gains may owe capital-gains tax (a 1031 exchange can defer both). Figures are a year-1 estimate at your 24.0% rate — not tax advice; consult a CPA.
Schools (NCES district)
- District
- Floyd County
- NCES district ID
- 1302190
- Math proficiency
- 41% ▼ -5.00%
- Reading proficiency
- 40% ▼ -4.00%
- Median HH income
- $47,083
- Composite
- 34.64/100
- National rank
- #5143
- State rank
- #45 of 174 in GA
Livability — Rome
- Score
- 64/100
- State rank
- #266
- US rank
- #14459
Category grades
Schools grade is shown separately in the Schools card above.
Census & demographics
- County
- Floyd County · 77,706 people
- City population
- 77,706
- Metro
- Rome, GA
- Population (ZIP)
- 43,001
- Household income
- $68,089
- Rent vs Own
- Severe rent burden
- 1311.0
Population outlook (Floyd County) Hauer SSP2
- Today (2025)
- 96,321 people
- By 2030
- 95,532 · -0.8%
- By 2040
- 93,332 · -3.1%
- By 2050
- 90,850 · -5.7%
- By 2075
- 84,989 · -11.8%
- By 2100
- 76,097 · -21.0%
Race, ethnicity, and origin ACS 2023
- Neighborhood character
- Diverse neighborhood (Simpson 0.57)
- Race & ethnicity
- White 61% Hispanic / Latino 21% Black 12% Two or more races 11% Asian 2%
- Hispanic origin (detail)
- Mexican 13%
- Common ancestry
- Slovak 2% Serbian 1% Italian 1%
- Foreign-born
- 11% · Canada, Vietnam, South Korea
- Languages at home
- 82% English-only · Spanish 16% Other Indo-European 1% Vietnamese 1%
Political lean MEDSL · Floyd
- 2024 margin
- Solid R (+42.0) · D 28.8% · R 70.7%
- 2008→2024 swing
- -5.6pp toward R · 2008: -36.4pp · 2024: -42.0pp
- All cycles
- 2024: R+42.0 2020: R+41.1 2016: R+43.5 2012: R+39.9 2008: R+36.4
Not yet ingested
- Civics
- —
Market trends
- HPI YoY
- ▼ -82.79%
- Current HPI
- 254.3732
- Rent YoY
- ▲ 1.71%
- Metro
- Rome, GA
- State GDP YoY
- ▲ 2.66%
- F500 in state
- 28
Industry mix (Fortune 500 HQ in GA)
| Industry | F500 HQs | Revenue |
|---|---|---|
| Paper / Packaging | 2 | $29B |
|
||
| Retail | 1 | $160B |
|
||
| Transportation / Logistics | 1 | $91B |
|
||
| Airlines | 1 | $62B |
|
||
| Consumer Goods | 1 | $47B |
|
||
| Utilities | 1 | $25B |
|
||
Price history
+99.9% since first listed19 events — show timeline
- 2026-04-21 Price Changed $149,900 FMLS
- 2026-04-21 Price Changed $149,900 GAMLS
- 2026-03-04 Listed $154,713 FMLS
- 2026-03-03 Listed $154,713 GAMLS
- 2016-03-17 Price Changed $64,900 GAMLS
- 2016-03-05 Price Changed $64,900 FMLS
- 2016-02-29 Sold (Public Records) $68,500 Public Records
- 2016-02-26 Sold (MLS) $68,500 GAMLS
- 2016-02-26 Sold (MLS) $68,500 FMLS
- 2015-08-20 Contingent — FMLS
- 2015-08-19 Pending — GAMLS
- 2015-08-19 Price Changed $68,500 GAMLS
- 2015-07-17 Price Changed $64,900 GAMLS
- 2015-07-17 Price Changed $68,500 FMLS
- 2015-07-17 Price Changed $64,900 FMLS
- 2015-04-27 Price Changed $69,900 GAMLS
- 2015-04-27 Price Changed $69,900 FMLS
- 2015-01-30 Listed $75,000 FMLS
- 2015-01-28 Listed $75,000 GAMLS
Property tax history
+17.9%/yrLatest (2025): $1,584 · +8.6% YoY. Source: county tax records.
Cash-flow waterfall
monthlySold comps — $/sqft
last 12 mo · ≤1 miLoading sold comps…