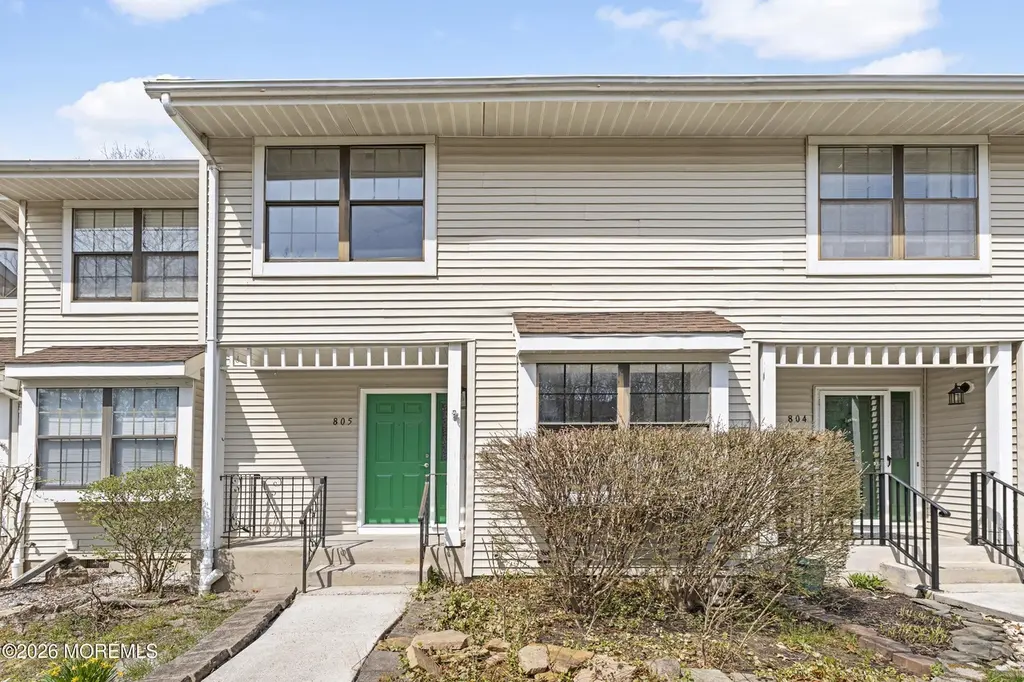
805 Arlington Dr · Toms River, NJ
Flood risk No data
- FEMA flood zone
- —
- Chance of flooding over 30 yrs
- —
- Est. flood insurance / yr
- —
Fire risk No data
- Est. fire insurance / yr
- —
Heat risk No data
- Hot days now (above threshold)
- —
- Hot days in 30 yrs
- —
Wind risk No data
- Chance of severe wind over 30 yrs
- —
Air-quality risk No data
- Unhealthy air days now
- —
- Unhealthy air days in 30 yrs
- —
Risk factors via First Street. Map © Google.
Why this score? — see what drove the C grade
The composite is a weighted blend of 9 inputs, each scored 0–100. Each bar is that input's sub-score; the figure is the points it added to the 100-point composite (weight × sub-score).
- Cash flow +22.5/30.0
- ARV discount +7.5/15.0
- DSCR +7.2/10.0
- 1% rule +6.7/10.0
- Livability +4.0/5.0
- Schools +2.9/10.0
- Rent growth +2.5/5.0
- Condition / age +2.5/5.0
- Appreciation +0.0/10.0
$369,999
🖨 Deal sheet 📄 Offer letter ✓ Due diligence
Listing remarks
Welcome to this beautifully refreshed 3-bedroom, 2.5-bath home offering modern style and everyday comfort. Recently renovated throughout, it features brand-new flooring, fresh paint, and recessed lighting that enhances the bright, open layout. The updated kitchen boasts sleek stainless steel appliances, including a convenient 2-in-1 washer and dryer, along with stylish finishes perfect for cooking and entertaining. Bathrooms have been tastefully redesigned with a clean, contemporary feel. Move-in ready and affordably priced, this home is ideal for first-time buyers or investors. Enjoy low-maintenance living with an HOA that covers exterior upkeep, snow removal, and amenities like a clubhous
Key facts
- $390 HOA
- 2 parking spots
- Pool
Property features AI
Finance
- HOA & community: Monthly association fee of 390 (Saratoga association)
Exterior
- Parking: No garage spaces
- Utilities: Public sewer
- Home design: Condominium ownership; Living area approximately 1216
- Exterior features: Shingle roof; Property is attached (condominium)
Interior
- Bedrooms: 3 bedrooms
- Flooring: Vinyl
- Bathrooms: 2 full bathrooms and 1 half bathroom (2.5 total)
- Heating & cooling: Heating included; Central air conditioning
- Interior features: Vinyl flooring; No fireplaces; Crawl space basement
Neighborhood map
What this means for you Summary
Snapshot
- This is a 3-bed/3.0-bath condo listed at $370k.
Deal economics
- At list price, monthly cash flow is $622 ($7k/yr) — positive.
- The deal already cash-flows at list — no discount required.
- Meets the 1% rule at list price ($4k rent vs $370k).
- Cap rate 8.3% vs local median 3.8% in Toms River — top-decile yield for the area; either an underpriced asset or a hidden risk that comps aren't pricing in. Stress-test before assuming the spread holds.
Location & tenants
- Location reads 81/100 on livability (#61 in NJ, #1,538 nationally) — a professional / high-income tenant draw. Strengths: employment A+, housing A+, health & safety A+; Watch: commute D, cost of living F.
- Toms River Regional School District (suburban): math 18% / reading 44% proficiency, ranked #316 of 472 in NJ (top 67%) — families likely to look elsewhere, expect single-tenant / working-renter base with shorter leases.
- Market conditions: 262 active listings in the ZIP; 2 comparable units currently listed for rent nearby; solid renter incomes; 4,434 units permitted in Ocean County in 2024 (868 in 5+ unit buildings).
- At $4,322/mo this rent would consume 59% of the median local household income ($88k/yr) (locally 529% of renters already pay >50% of income on rent) — very limited rent-growth headroom before tenants either downsize or default.
Forward outlook
- Local home prices are declining (-3.0%/yr); year-one equity from $3k of loan paydown is wiped out by about $11k of value loss. Plan a longer hold.
- Ocean County population projected to shrink 8% by 2050 — rents likely to lag national; underwrite the cash flow, not the appreciation.
Negotiation context
- Only 12 days on market — expect competitive offers; lowballing is unlikely to land.
- 2 sale attempts since 3y ago with the ask held roughly flat each time — persistent listings suggest the price (not the market) is what's stuck; bring a comps-based counter.
- Current owner paid $270k; 37% above their basis — modest negotiation headroom, anchor on the comps not their cost.
Questions for the listing agent
- What does the HOA fee cover, when was the last increase, and are there any pending special assessments or reserve-fund shortfalls?
- Any open or pending special assessments — roof, HVAC, plumbing, elevator, façade? What's the per-unit balance and payoff schedule, and is the seller paying it off at close or rolling it to the buyer?
- Is there a deadline driving the sale (1031 exchange, divorce, estate, relocation)? That informs how much negotiation room exists.
- What's the average days-on-market for RENTAL listings here right now (not sales)? A rising rental-DOM trend means longer vacancies and softer asking-rent achievability than the comps imply.
- What's the recent tenant-quality profile in this submarket — average credit score on applications, eviction rate, late-payment / NSF rate, and stable-employment percentage? A property-management company in the area should have these aggregated.
- How much new apartment / multifamily construction is in the pipeline within 1–3 miles? Heavy new supply (>2% of stock underway) typically softens rents 12–24 months out; light construction supports rent growth.
Investment metrics
- 1% rule
- 1.17% ✓
- Cap rate
- 8.31%
- Cash-on-cash
- 7.21%
- DSCR
- 1.32
- GRM
- 7.1
CMA / ARV
No comps found within radius.
Projected returns pro-forma
-3.0% appreciation · 3.0% rent growth · sell at horizon
- IRR
- -5.2%
- Equity multiple
- 0.81×
- Total profit
- $-20,126
- Equity at exit
- $55,168
- IRR
- 4.5%
- Equity multiple
- 1.33×
- Total profit
- $34,344
- Equity at exit
- $31,991
Cash invested: $103,600 (down + closing). Projections, not guarantees.
Landlord ↔ Tenant lean methodology
- Overall (STATE)
- 21 Tenant-Leaning
- State New Jersey
- 21 Tenant-Leaning · D+6
- County
- — inherits STATE
- City
- — inherits STATE
ZIP-level market 08755
- Active inventory
- 262
- Price-to-rent
- 7.1×
Monthly cashflow live
- Estimated rent
- $4,322 medium interval (Pro) →
- Mortgage (P&I)
- −$1,940
- Tax from tax record
- −$308 /mo · $3,697/yr
- Insurance
- −$154
- HOA
- −$390
- Vacancy / Maint / Mgmt
- −$908
- Net cashflow
- $622
Break-even live
UW: 25.0% down · 7.5% · 30yr · 1.5% tax · 5.0% vac · 8.0% maint · 8.0% mgmt
Financing live
Cash to close
- Down payment
- $92,500
- Closing costs
- $11,100
- Reserves months
- —
- Total cash needed
- —
Loan-product check · same deal, 3 products live
Conventional
25% down · 7.5% · 30yr
- Down + closing
- —
- Monthly P&I
- —
- Monthly cashflow
- —
- DSCR
- —
- Eligible?
- —
Personal DTI + credit; lowest rate.
DSCR
20% down · 8.5% · 30yr
- Down + closing
- —
- Monthly P&I
- —
- Monthly cashflow
- —
- DSCR
- —
- Eligible?
- —
No personal income docs; deal must DSCR.
Hard money
10% down · 12.0% · 12mo
- Down + closing
- —
- Monthly P&I
- —
- Monthly cashflow
- —
- DSCR
- —
- Eligible?
- —
Short-term bridge; refi at stabilization.
Rent comps 2 comps
| Address | Beds | Baths | Sqft | Rent | $/sqft | DOM | Units | Dist |
|---|---|---|---|---|---|---|---|---|
| 2556 Woodland Rd Manchester, NJ | 3.0 | 2.0 | 1409 | $3,500 | $2.48 | 13d | 1 | 0.95mi |
| 100 Jumper Dr Toms River, NJ | 2.0–3.0 | 2.0–2.5 | 1502 | $5,391 | $3.59 | 1d | 25 | 1.13mi |
HOA detail condo
- Monthly dues
- $390 · $4,680/yr
- Likely covers
- snow removal
- Assessments
- None detected in remarks — confirm with the listing agent.
Listing history 9 events
-
2026-04-22status Pending
-
2026-04-10$369,999 Active
-
2026-04-05historical $369,999
-
2025-10-01soldstatus $270,000
-
2023-11-30status Pending
-
2023-08-31$269,999 Active
-
2003-09-30soldstatus $169,500
-
1995-09-20soldstatus $70,250
-
1988-02-05soldstatus $106,900
ⓘ Source: listings_history table (triggers on properties + properties_extension) + one-shot
backfill from property_details.listing_events for pre-trigger history.
Tax reassessment forecast NJ · Partial reset (capped growth)
- Current annual tax
- $3,697 · $308/mo
- Projected year-2 tax
- $6,455 · $538/mo
- Expected delta
- +$2,758/yr (+$230/mo · 74.6%)
ⓘ Screening estimate from a state-policy table — verify with the county assessor before closing.
Nearby sold comps map
Loading sold comps map…
Walkable amenities ~0.75 mi
Loading nearby amenities…
Taxation est. · year 1
- Rental income
- $51,868
- − Mortgage interest
- −$20,726
- − Property taxes
- −$3,697
- − Insurance
- −$1,850
- − Repairs & maintenance
- −$4,149
- − Management
- −$4,149
- − HOA
- −$4,680
- − Depreciation
- −$10,764
- Taxable income
- $1,853
- Est. tax owed @ 24.0%
- −$445
- After-tax cash flow
- $7,020/yr
For passive investors: Depreciation is non-cash, so a rental often shows a tax loss while cash-flowing — sheltering income. Rental losses are passive: they offset passive income freely, and up to $25,000/yr can offset ordinary (W-2) income if you actively participate and your MAGI is under $100k (phasing out to $0 by $150k); unused losses carry forward. On sale, claimed depreciation is recaptured at up to 25%, and gains may owe capital-gains tax (a 1031 exchange can defer both). Figures are a year-1 estimate at your 24.0% rate — not tax advice; consult a CPA.
Schools (NCES district)
- District
- Toms River Regional School District
- NCES district ID
- 3416230
- Math proficiency
- 18% ▼ -19.00%
- Reading proficiency
- 44% ▼ -10.00%
- Median HH income
- $72,370
- Composite
- 29.07/100
- National rank
- #6602
- State rank
- #316 of 472 in NJ
Livability — Toms River
- Score
- 81/100
- State rank
- #61
- US rank
- #1538
Category grades
Schools grade is shown separately in the Schools card above.
Census & demographics
- Census place
- Toms River, NJ
- County
- Ocean County · 439,426 people
- City population
- 131,205
- Metro
- New York-Newark-Jersey City, NY-NJ-PA
- Population (ZIP)
- 29,670
- Household income
- $87,575
- Rent vs Own
- Severe rent burden
- 529.0
Population outlook (Ocean County) Hauer SSP2
- Today (2025)
- 586,991 people
- By 2030
- 581,403 · -1.0%
- By 2040
- 564,913 · -3.8%
- By 2050
- 538,149 · -8.3%
- By 2075
- 468,845 · -20.1%
- By 2100
- 350,297 · -40.3%
Race, ethnicity, and origin ACS 2023
- Neighborhood character
- Predominantly White (73%)
- Race & ethnicity
- White 73% Hispanic / Latino 11% Black 9% Two or more races 8% Asian 4%
- Hispanic origin (detail)
- Puerto Rican 6%
- Common ancestry
- Romanian 5% Italian 2% Scotch-Irish 2%
- Foreign-born
- 10% · Canada, Jamaica, South Korea
- Languages at home
- 84% English-only · Spanish 7% Other Indo-European 2% Tagalog/Filipino 2%
Political lean MEDSL · Ocean
- 2024 margin
- Solid R (+36.0) · D 31.4% · R 67.4% · Other 1.2%
- 2008→2024 swing
- -17.6pp toward R · 2008: -18.4pp · 2024: -36.0pp
- All cycles
- 2024: R+36.0 2020: R+28.7 2016: R+34.0 2012: R+17.7 2008: R+18.4
Not yet ingested
- Civics
- —
Market trends
- HPI YoY
- ▼ -223.51%
- Current HPI
- 303.2721
- Rent YoY
- —
- Metro
- New York-Newark-Jersey City, NY-NJ-PA
- State GDP YoY
- ▲ 2.05%
- F500 in state
- 34
Industry mix (Fortune 500 HQ in NJ)
| Industry | F500 HQs | Revenue |
|---|---|---|
| Consumer Goods | 3 | $31B |
|
||
| Pharmaceuticals | 2 | $153B |
|
||
| Technology | 2 | $21B |
|
||
| Insurance | 2 | $20B |
|
||
| Healthcare | 2 | $19B |
|
||
| Financial Services | 1 | $70B |
|
||
Price history
+246.1% since first listed9 events — show timeline
- 2026-04-22 Pending — MOMLS
- 2026-04-10 Listed $369,999 MOMLS
- 2026-04-05 Coming Soon $369,999 MOMLS
- 2025-10-01 Sold (Public Records) $270,000 Public Records
- 2023-11-30 Pending — MOMLS
- 2023-08-31 Listed $269,999 MOMLS
- 2003-09-30 Sold (Public Records) $169,500 Public Records
- 1995-09-20 Sold (Public Records) $70,250 Public Records
- 1988-02-05 Sold (Public Records) $106,900 Public Records
Property tax history
+2.4%/yrLatest (2025): $3,697 · +7.3% YoY. Source: county tax records.
Cash-flow waterfall
monthlySold comps — $/sqft
last 12 mo · ≤1 miLoading sold comps…