1720 Ala Moana Blvd Unit 304A · Urban Honolulu, HI
Flood risk 7/10 · Major
- FEMA flood zone
- AE
- Chance of flooding over 30 yrs
- 0.82%
- Est. flood insurance / yr
- $1,737 – $8,500
Fire risk No data
- Est. fire insurance / yr
- —
Heat risk No data
- Hot days now (above threshold)
- —
- Hot days in 30 yrs
- —
Wind risk No data
- Chance of severe wind over 30 yrs
- —
Air-quality risk 1/10 · Minimal
- Unhealthy air days now
- —
- Unhealthy air days in 30 yrs
- —
Risk factors via First Street. Map © Google.
Why this score? — see what drove the B+ grade
The composite is a weighted blend of 9 inputs, each scored 0–100. Each bar is that input's sub-score; the figure is the points it added to the 100-point composite (weight × sub-score).
- Cash flow +30.0/30.0
- 1% rule +10.0/10.0
- DSCR +10.0/10.0
- ARV discount +7.5/15.0
- Appreciation +6.4/10.0
- Rent growth +4.0/5.0
- Schools +3.7/10.0
- Livability +2.5/5.0
- Condition / age +2.5/5.0
$98,000
🖨 Deal sheet 📄 Offer letter ✓ Due diligence
Listing remarks MLS
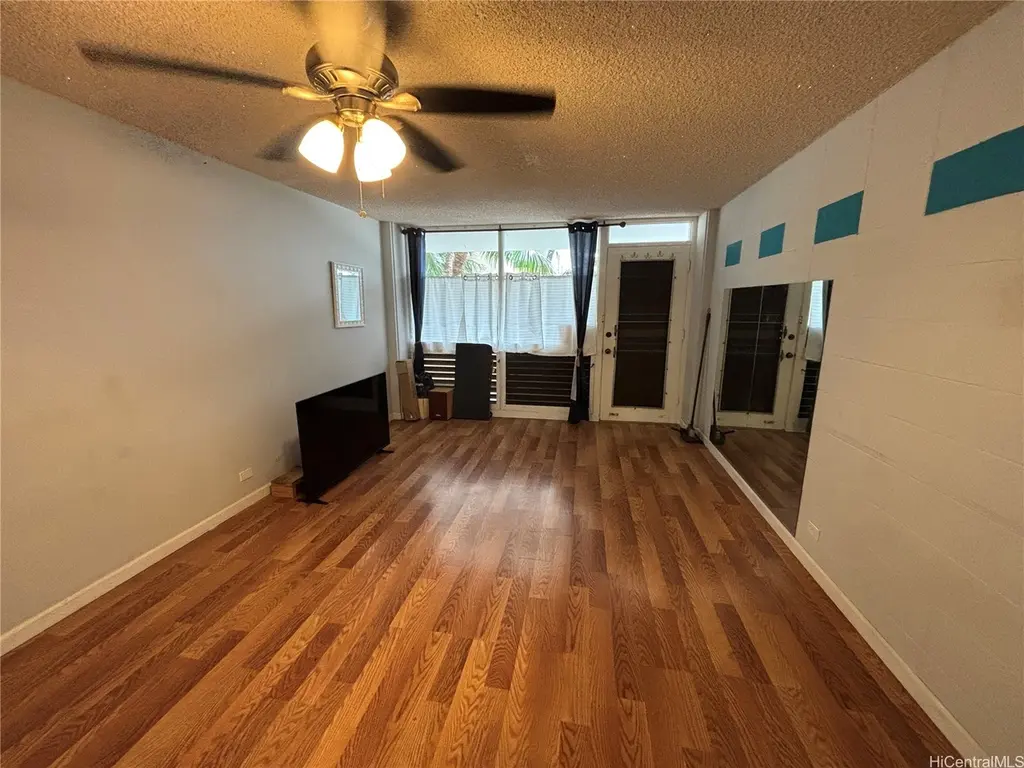
Quiet and well-maintained cooperative 1-bedroom unit on the 3rd floor of the Tradewinds Hotel. Close to shopping, dining, and commercial conveniences. Maintenance fee includes electricity. Suitable for investors or owner-occupants.
Key facts
- $792 HOA
- Community pool
- Built 1961
Neighborhood map
What this means for you Summary
Snapshot
- This is a 1-bed/1.0-bath other listed at $98k.
Deal economics
- At list price, monthly cash flow is $551 ($7k/yr) — positive.
- The deal already cash-flows at list — no discount required.
- Meets the 1% rule at list price ($3k rent vs $98k).
- Recommended offer: $86k (12.0% below list) — sets the bar for market timing.
- Cap rate 18.3% vs local median 1.5% in Urban Honolulu — top-decile yield for the area; either an underpriced asset or a hidden risk that comps aren't pricing in. Stress-test before assuming the spread holds.
Location & tenants
- Location reads: area grade B — affects rentability + tenant quality, not the cash-flow math above.
- Hawaii Department Of Education (suburban): math 32% / reading 50% proficiency, ranked #1 of 1 in HI (top 100%) — families likely to look elsewhere, expect single-tenant / working-renter base with shorter leases.
- Market conditions: Rents rising fast (+6.0%/yr); 814 active listings in the ZIP; 40 comparable units currently listed for rent nearby; rentals at typical pace (median 17d on market — plan ~3-4 weeks tenant-placement turnaround); solid renter incomes; 1,638 units permitted in Honolulu County in 2024 (793 in 5+ unit buildings).
Forward outlook
- In year one you build about $3k of equity ($678 loan paydown + $3k appreciation (2.7% local appreciation)).
- Honolulu County population projected at +17% by 2050 — long-run rental-demand tailwind backs the buy-and-hold thesis.
- At projected returns (2.7% appreciation + 6.0% rent growth), your $27k cash investment doubles in ~3 years — after that, you're playing with house money.
- By year 10, paydown + projected appreciation supports a ~$33k cash-out refi (75% LTV) — recoverable capital for the next deal without selling this one.
Negotiation context
- It's been on market 128 days — a 12% lower offer ($86k) is reasonable based on typical stale-listing flexibility.
- 7 sale attempts since 9y ago with the ask held roughly flat each time — persistent listings suggest the price (not the market) is what's stuck; bring a comps-based counter.
- Current owner paid $85k; 15% above their basis — modest negotiation headroom, anchor on the comps not their cost.
Risks & watch-outs
- Watch-outs: flood insurance adds $427/mo; HOA is 26% of rent.
- Climate carrying-cost: in FEMA flood zone AE (mandatory federal flood insurance) — expect insurance premiums to compound above CPI over the hold.
Questions for the listing agent
- It's been on market 128 days. Have you received any prior offers? Is the seller open to a 12% concession, seller financing, or rate buy-down credit?
- Built in 1961 — when were the roof, HVAC, electrical panel, plumbing, and water heater last replaced?
- What's the actual annual flood-insurance premium (NFIP or private), and is the property in a SFHA with mandatory coverage?
- What does the HOA fee cover, when was the last increase, and are there any pending special assessments or reserve-fund shortfalls?
- Why hasn't it sold? Are there any deal-killer items the seller is aware of (foundation, flood, title, zoning, code violations)?
- Is there a deadline driving the sale (1031 exchange, divorce, estate, relocation)? That informs how much negotiation room exists.
- What's the average days-on-market for RENTAL listings here right now (not sales)? A rising rental-DOM trend means longer vacancies and softer asking-rent achievability than the comps imply.
- What's the recent tenant-quality profile in this submarket — average credit score on applications, eviction rate, late-payment / NSF rate, and stable-employment percentage? A property-management company in the area should have these aggregated.
- How much new for-sale + rental construction is in the pipeline within 1–3 miles? Heavy new supply typically softens prices + rents 12–24 months out; constrained supply supports both.
Investment metrics
- 1% rule
- 3.16% ✓
- Cap rate
- 18.27%
- Cash-on-cash
- 42.76%
- DSCR
- 2.90
- GRM
- 2.6
CMA / ARV
No comps found within radius.
Projected returns pro-forma
2.74% appreciation · 6.0% rent growth · sell at horizon
- IRR
- 34.7%
- Equity multiple
- 3.04×
- Total profit
- $56,014
- Equity at exit
- $42,653
- IRR
- 38.1%
- Equity multiple
- 7.16×
- Total profit
- $169,107
- Equity at exit
- $64,656
Cash invested: $27,440 (down + closing). Projections, not guarantees.
Landlord ↔ Tenant lean methodology
- Overall (STATE)
- 37 Tenant-Leaning
- State Hawaii
- 37 Tenant-Leaning · D+13
- County
- — inherits STATE
- City
- — inherits STATE
ZIP-level market 96815
- Home prices YoY
- 0.9%
- Rents YoY
- 6.0%
- Active inventory
- 814
- Price-to-rent
- 2.6×
Monthly cashflow live
- Estimated rent
- $3,098 high interval (Pro) →
- Mortgage (P&I)
- −$514
- Tax est. 1.5%
- −$122 /mo · $1,470/yr
- Insurance
- −$41
- Flood insurance flood zone
- −$427 /mo · $5,118/yr
- HOA
- −$792
- Vacancy / Maint / Mgmt
- −$650
- Net cashflow
- $551
Break-even live
UW: 25.0% down · 7.5% · 30yr · 1.5% tax · 5.0% vac · 8.0% maint · 8.0% mgmt
Financing live
Cash to close
- Down payment
- $24,500
- Closing costs
- $2,940
- Reserves months
- —
- Total cash needed
- —
Loan-product check · same deal, 3 products live
Conventional
25% down · 7.5% · 30yr
- Down + closing
- —
- Monthly P&I
- —
- Monthly cashflow
- —
- DSCR
- —
- Eligible?
- —
Personal DTI + credit; lowest rate.
DSCR
20% down · 8.5% · 30yr
- Down + closing
- —
- Monthly P&I
- —
- Monthly cashflow
- —
- DSCR
- —
- Eligible?
- —
No personal income docs; deal must DSCR.
Hard money
10% down · 12.0% · 12mo
- Down + closing
- —
- Monthly P&I
- —
- Monthly cashflow
- —
- DSCR
- —
- Eligible?
- —
Short-term bridge; refi at stabilization.
Rent comps 40 comps
| Address | Beds | Baths | Sqft | Rent | $/sqft | DOM | Units | Dist |
|---|---|---|---|---|---|---|---|---|
| 1778 Ala Moana Blvd Unit 1541754P Honolulu, HI | 1.0 | 1.0 | 721 | $4,387 | $6.08 | 14d | 1 | 0.04mi |
| 1765 Ala Moana Blvd #1183 Honolulu, HI | 1.0 | 1.0 | 440 | $3,100 | $7.05 | 3d | 1 | 0.05mi |
| 1778 Ala Moana Blvd #2606 Honolulu, HI | 1.0 | 1.0 | 724 | $2,895 | $4.00 | 3d | 1 | 0.07mi |
| 1778 Ala Moana Blvd #1219 Honolulu, HI | 1.0 | 1.0 | 724 | $4,600 | $6.35 | 23d | 1 | 0.07mi |
| 1778 Ala Moana Blvd #801 Honolulu, HI | 1.0 | 1.0 | 724 | $3,400 | $4.70 | 23d | 1 | 0.07mi |
| 1778 Ala Moana Blvd #3318 Honolulu, HI | 1.0 | 1.0 | 683 | $3,400 | $4.98 | 3d | 1 | 0.07mi |
| 1778 Ala Moana Blvd #1307 Honolulu, HI | 1.0 | 1.0 | 683 | $2,900 | $4.25 | 23d | 1 | 0.07mi |
| 1778 Ala Moana Blvd #1317 Honolulu, HI | 1.0 | 1.0 | 683 | $2,775 | $4.06 | 21d | 1 | 0.07mi |
| 1777 Ala Moana Blvd Unit 1327715P Honolulu, HI | 1.0 | 1.0 | 495 | $5,590 | $11.29 | 43d | 1 | 0.12mi |
| 411 Hobron Ln Honolulu, HI | 1.0 | 1.0 | 566 | $3,575 | $6.31 | 43d | 2 | 0.16mi |
| 411 Hobron Ln Honolulu, HI | 1.0 | 1.0 | 575 | $3,322 | $5.78 | 3d | 4 | 0.16mi |
| 411 Hobron Ln Honolulu, HI | 1.0 | 1.0 | 575 | $3,475 | $6.04 | 44d | 3 | 0.16mi |
| 411 Hobron Ln Unit 1327718P Honolulu, HI | 1.0 | 1.0 | 538 | $3,558 | $6.61 | 11d | 1 | 0.17mi |
| 419A Atkinson Dr Honolulu, HI | 2.0 | 1.0 | 664 | $2,698 | $4.06 | 17d | 2 | 0.19mi |
| 419A Atkinson Dr #1103 Honolulu, HI | 2.0 | 1.0 | 664 | $2,700 | $4.07 | 16d | 1 | 0.19mi |
| 400 Hobron Ln #2712 Honolulu, HI | 1.0 | 1.0 | 582 | $2,700 | $4.64 | 11d | 1 | 0.21mi |
| 425 Ena Rd Unit 204C Honolulu, HI | 1.0 | 1.0 | 600 | $2,700 | $4.50 | 23d | 1 | 0.23mi |
| 475 Atkinson Dr Honolulu, HI | 1.0–2.0 | 1.0 | 798 | $2,600 | $3.26 | 21d | 3 | 0.27mi |
| 475 Atkinson Dr Honolulu, HI | 1.0–2.0 | 1.0 | 855 | $2,700 | $3.16 | 23d | 2 | 0.27mi |
| 1861 Kapiolani Blvd Unit C Honolulu, HI | 1.0 | 1.0 | 525 | $2,700 | $5.14 | 21d | 1 | 0.40mi |
| 1655 Makaloa St #1510 Honolulu, HI | 1.0 | 1.0 | 500 | $2,600 | $5.20 | 21d | 1 | 0.44mi |
| 2045 Kalakaua Ave Honolulu, HI | 1.0 | 1.0 | 657 | $4,200 | $6.39 | 43d | 1 | 0.47mi |
| 440 Olohana St Unit 1327703P Honolulu, HI | 1.0 | 1.0 | 355 | $4,055 | $11.42 | 11d | 1 | 0.58mi |
| 440 Olohana St Unit 1327711P Honolulu, HI | 1.0 | 1.0 | 355 | $3,741 | $10.54 | 2d | 1 | 0.58mi |
| 629 Keeaumoku St Honolulu, HI | 1.0–2.0 | 1.0–2.0 | 923 | $3,400 | $3.68 | 17d | 2 | 0.59mi |
| 629 Keeaumoku St Honolulu, HI | 1.0 | 1.0 | 618 | $3,350 | $5.42 | 2d | 2 | 0.59mi |
| 629 Keeaumoku St Honolulu, HI | 1.0–2.0 | 1.0–2.0 | 919 | $3,500 | $3.81 | 43d | 2 | 0.59mi |
| 1391 Kapiolani Blvd Honolulu, HI | 1.0–3.0 | 1.0–2.0 | 971 | $3,500 | $3.60 | 3d | 2 | 0.61mi |
| 1388 Kapiolani Blvd Unit 3910 Honolulu, HI | 1.0 | 1.0 | 619 | $4,000 | $6.46 | 3d | 1 | 0.63mi |
| 1388 Kapiolani Blvd #2703 Honolulu, HI | 1.0 | 1.0 | 574 | $3,500 | $6.10 | 23d | 1 | 0.64mi |
| 1388 Kapiolani Blvd #2903 Honolulu, HI | 1.0 | 1.0 | 574 | $3,500 | $6.10 | 10d | 1 | 0.64mi |
| 1388 Kapiolani Blvd #4205 Honolulu, HI | 1.0 | 1.0 | 567 | $4,500 | $7.94 | 43d | 1 | 0.64mi |
| 223 Saratoga Rd #1012 Honolulu, HI | — | 1.0 | 559 | $2,700 | $4.83 | 17d | 1 | 0.64mi |
| 2140 Khi AVE Unit 2306 Honolulu, HI | 1.0 | 1.0 | 553 | $2,700 | $4.88 | 17d | 1 | 0.67mi |
| 2140 Khi AVE Unit 2006 Honolulu, HI | 1.0 | 1.0 | 553 | $3,400 | $6.15 | 3d | 1 | 0.67mi |
| 2140 Khi AVE Unit 803 Honolulu, HI | — | 1.0 | 460 | $4,990 | $10.85 | 43d | 1 | 0.67mi |
| 2140 Khi Ave Honolulu, HI | 1.0 | 1.0 | 577 | $4,500 | $7.80 | 23d | 1 | 0.68mi |
| 2140 Khi Ave. unit Ph 2506 Honolulu, HI | 1.0 | 1.0 | 678 | $3,200 | $4.72 | 14d | 1 | 0.68mi |
| 2333 Kapiolani Blvd Unit 1008B Honolulu, HI | 2.0 | 1.0 | 600 | $2,700 | $4.50 | 23d | 1 | 0.69mi |
| 2121 Ala Wai Blvd Honolulu, HI | 2.0 | 1.0–3.0 | 1006 | $4,400 | $4.37 | 10d | 1 | 0.71mi |
HOA detail
- Monthly dues
- $792 · $9,504/yr
- Likely covers
- electric
Listing history 27 events
-
2026-06-10days on market $98,000 Active 128 DOM
-
2026-06-09days on market $98,000 Active 127 DOM
-
2026-06-08days on market $98,000 Active 126 DOM
-
2026-06-07days on market $98,000 Active 125 DOM
-
2026-06-05days on market $98,000 Active 122 DOM
-
2026-06-03days on market $98,000 Active 121 DOM
-
2026-06-02days on market $98,000 Active 120 DOM
-
2026-06-01days on market $98,000 Active 119 DOM
-
2026-05-31days on market $98,000 Active 118 DOM
-
2026-04-09status Active 231-char remark
Show marketing remark (231 chars)
Quiet and well-maintained cooperative 1-bedroom unit on the 3rd floor of the Tradewinds Hotel. Close to shopping, dining, and commercial conveniences. Maintenance fee includes electricity. Suitable for investors or owner-occupants.
-
2026-04-08historical Active Under Contract 231-char remark
Show marketing remark (231 chars)
Quiet and well-maintained cooperative 1-bedroom unit on the 3rd floor of the Tradewinds Hotel. Close to shopping, dining, and commercial conveniences. Maintenance fee includes electricity. Suitable for investors or owner-occupants.
-
2026-03-22status Active 231-char remark
Show marketing remark (231 chars)
Quiet and well-maintained cooperative 1-bedroom unit on the 3rd floor of the Tradewinds Hotel. Close to shopping, dining, and commercial conveniences. Maintenance fee includes electricity. Suitable for investors or owner-occupants.
-
2026-02-10historical Active Under Contract 231-char remark
Show marketing remark (231 chars)
Quiet and well-maintained cooperative 1-bedroom unit on the 3rd floor of the Tradewinds Hotel. Close to shopping, dining, and commercial conveniences. Maintenance fee includes electricity. Suitable for investors or owner-occupants.
-
2026-02-01$98,000 Active 231-char remark
Show marketing remark (231 chars)
Quiet and well-maintained cooperative 1-bedroom unit on the 3rd floor of the Tradewinds Hotel. Close to shopping, dining, and commercial conveniences. Maintenance fee includes electricity. Suitable for investors or owner-occupants.
-
2021-09-28soldstatus $85,000 Sold 194-char remark
Show marketing remark (194 chars)
Super LOCATION! Walk to beach. Ala Moana Shopping Center, and Restaurants. Amenities include Security, BBQ Area and Swimming Pool and Community Laundry. ! Sold in "AS-IS" condition
-
2021-08-13status Pending 194-char remark
Show marketing remark (194 chars)
Super LOCATION! Walk to beach. Ala Moana Shopping Center, and Restaurants. Amenities include Security, BBQ Area and Swimming Pool and Community Laundry. ! Sold in "AS-IS" condition
-
2021-07-27price $85,000 194-char remark
Show marketing remark (194 chars)
Super LOCATION! Walk to beach. Ala Moana Shopping Center, and Restaurants. Amenities include Security, BBQ Area and Swimming Pool and Community Laundry. ! Sold in "AS-IS" condition
-
2020-10-27$99,000 Active 194-char remark
Show marketing remark (194 chars)
Super LOCATION! Walk to beach. Ala Moana Shopping Center, and Restaurants. Amenities include Security, BBQ Area and Swimming Pool and Community Laundry. ! Sold in "AS-IS" condition
-
2019-08-07historical
-
2019-02-07$115,000 Active
-
2019-01-28historical
-
2018-10-30$115,000 Active
-
2017-07-31soldstatus $67,000
-
2017-07-15historical
-
2017-06-16status Pending
-
2017-05-16price $75,000
-
2017-03-13$80,000 Active
ⓘ Source: listings_history table (triggers on properties + properties_extension) + one-shot
backfill from property_details.listing_events for pre-trigger history.
Climate risk First Street
- Flood 7/10 Severe FEMA zone AE · 82% chance over 30 yrs
- Air quality 1/10 Low
Nearby sold comps map
Loading sold comps map…
Walkable amenities ~0.75 mi
Loading nearby amenities…
Taxation est. · year 1
- Rental income
- $37,170
- − Mortgage interest
- −$5,490
- − Property taxes
- −$1,470
- − Insurance
- −$5,608
- − Repairs & maintenance
- −$2,974
- − Management
- −$2,974
- − HOA
- −$9,504
- − Depreciation
- −$2,851
- Taxable income
- $6,300
- Est. tax owed @ 24.0%
- −$1,512
- After-tax cash flow
- $5,103/yr
For passive investors: Depreciation is non-cash, so a rental often shows a tax loss while cash-flowing — sheltering income. Rental losses are passive: they offset passive income freely, and up to $25,000/yr can offset ordinary (W-2) income if you actively participate and your MAGI is under $100k (phasing out to $0 by $150k); unused losses carry forward. On sale, claimed depreciation is recaptured at up to 25%, and gains may owe capital-gains tax (a 1031 exchange can defer both). Figures are a year-1 estimate at your 24.0% rate — not tax advice; consult a CPA.
Schools (NCES district)
- District
- Hawaii Department Of Education
- NCES district ID
- 1500030
- Math proficiency
- 32% ▼ -10.00%
- Reading proficiency
- 50% ▼ -3.00%
- Median HH income
- $69,005
- Composite
- 37.07/100
- National rank
- #4504
- State rank
- #1 of 1 in HI
Livability — Urban Honolulu
No livability data for this city. (Only ~50 U.S. cities are tracked.)
Census & demographics
- Census place
- Urban Honolulu, HI
- County
- Honolulu County · 963,448 people
- City population
- 309,956
- Metro
- Urban Honolulu, HI
- Population (ZIP)
- 27,530
- Household income
- $77,096
- Rent vs Own
- Severe rent burden
- 2422.0
Population outlook (Honolulu County) Hauer SSP2
- Today (2025)
- 1,072,641 people
- By 2030
- 1,110,460 · +3.5%
- By 2040
- 1,181,593 · +10.2%
- By 2050
- 1,257,584 · +17.2%
- By 2075
- 1,501,120 · +39.9%
- By 2100
- 1,764,430 · +64.5%
Race, ethnicity, and origin ACS 2023
- Neighborhood character
- Highly diverse neighborhood (Simpson 0.71)
- Race & ethnicity
- Asian 41% White 35% Two or more races 16% Hispanic / Latino 6% Pacific Islander 4% Black 2%
- Hispanic origin (detail)
- Mexican 3% Puerto Rican 1%
- Common ancestry
- Romanian 2% Lithuanian 2% Slovak 2%
- Foreign-born
- 30% · China, South Korea, Canada
- Languages at home
- 66% English-only · Other Asian/Pacific 15% Chinese 5% Korean 3%
Political lean MEDSL · Honolulu
- 2024 margin
- Strong D (+21.6) · D 59.9% · R 38.3% · Other 1.8%
- 2008→2024 swing
- -19.4pp toward R · 2008: 41.1pp · 2024: 21.6pp
- All cycles
- 2024: D+21.6 2020: D+26.9 2016: D+29.9 2012: D+39.1 2008: D+41.1
Not yet ingested
- Civics
- —
Market trends
- HPI YoY
- ▲ 2.74%
- Current HPI
- 291.9404
- Rent YoY
- ▲ 6.00%
- Metro
- Urban Honolulu, HI
- State GDP YoY
- —
- F500 in state
- 0
Price history
+22.5% since first listed18 events — show timeline
- 2026-04-09 Relisted — HiCentral MLS
- 2026-04-08 Contingent — HiCentral MLS
- 2026-03-22 Relisted — HiCentral MLS
- 2026-02-10 Contingent — HiCentral MLS
- 2026-02-01 Listed $98,000 HiCentral MLS
- 2021-09-28 Sold (MLS) $85,000 HiCentral MLS
- 2021-08-13 Pending — HiCentral MLS
- 2021-07-27 Price Changed $85,000 HiCentral MLS
- 2020-10-27 Listed $99,000 HiCentral MLS
- 2019-08-07 Listing Removed — HiCentral MLS
- 2019-02-07 Listed $115,000 HiCentral MLS
- 2019-01-28 Listing Removed — HiCentral MLS
- 2018-10-30 Listed $115,000 HiCentral MLS
- 2017-07-31 Sold (Public Records) $67,000 Public Records
- 2017-07-15 Listing Removed — HiCentral MLS
- 2017-06-16 Pending — HiCentral MLS
- 2017-05-16 Price Changed $75,000 HiCentral MLS
- 2017-03-13 Listed $80,000 HiCentral MLS
Cash-flow waterfall
monthlySold comps — $/sqft
last 12 mo · ≤1 miLoading sold comps…