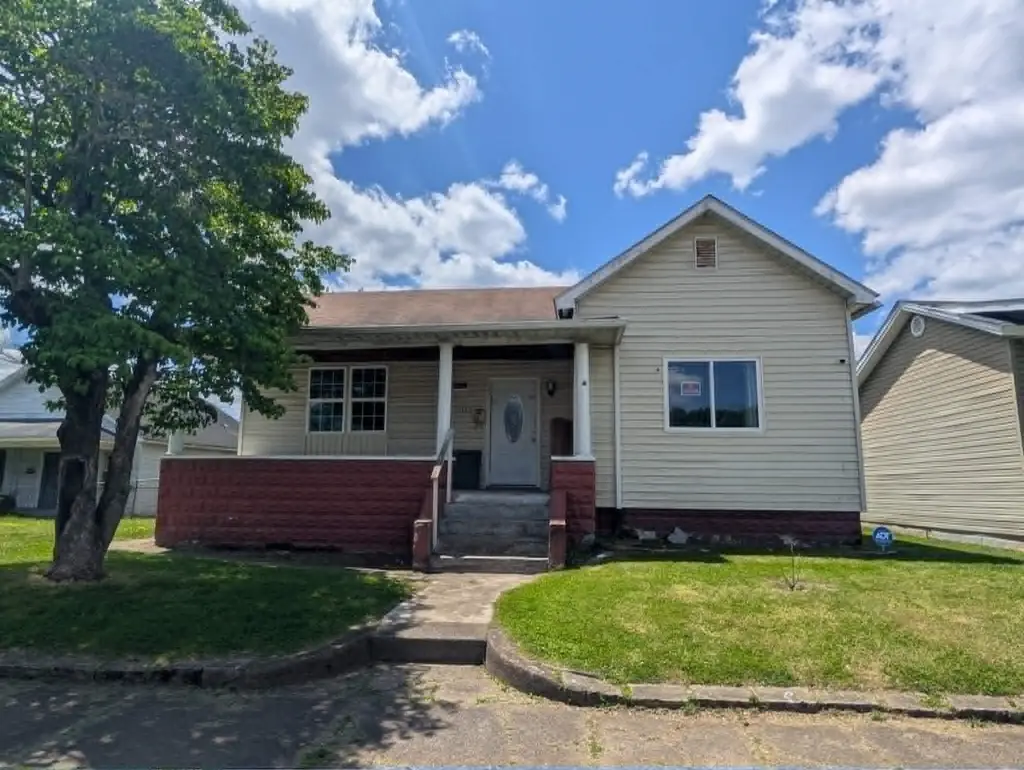
1312 S 7th St · Ironton, OH
Flood risk 1/10 · Minimal
- FEMA flood zone
- X
- Chance of flooding over 30 yrs
- 0.0%
- Est. flood insurance / yr
- $507 – $1,088
Fire risk 5/10 · Moderate
- Est. fire insurance / yr
- $713 – $1,323
Heat risk 5/10 · Moderate
- Hot days now (above 102°F)
- 7 days/yr
- Hot days in 30 yrs
- 19 days/yr
Wind risk 2/10 · Minimal
- Chance of severe wind over 30 yrs
- 2.0%
Air-quality risk 2/10 · Minimal
- Unhealthy air days now
- 0 days/yr
- Unhealthy air days in 30 yrs
- 2 days/yr
Risk factors via First Street. Map © Google.
Why this score? — see what drove the B+ grade
The composite is a weighted blend of 9 inputs, each scored 0–100. Each bar is that input's sub-score; the figure is the points it added to the 100-point composite (weight × sub-score).
- Cash flow +29.8/30.0
- ARV discount +15.0/15.0
- DSCR +10.0/10.0
- 1% rule +8.0/10.0
- Schools +4.6/10.0
- Livability +3.6/5.0
- Rent growth +2.5/5.0
- Condition / age +2.5/5.0
- Appreciation +0.0/10.0
$89,900
🖨 Deal sheet 📄 Offer letter ✓ Due diligence
Listing remarks MLS
This home offers a rare large double lot, 2 car carport off the alley, fenced back yard, and walking distance from Ironton High School and Ohio University. Home needs some TLC on interior, but home is a rare find with a double lot this close to the high school and University.
Key facts
- 2 car carport
- Fenced back yard
- Large double lot
Tags
Property features AI
Finance
- Other: Level lot/topography
Exterior
- Parking: Two-car garage; Carport
- Utilities: Public water; Public sewer
- Home design: Single-family residence; Residential property
- Construction: Vinyl siding; Block foundation; Composition roof; Above-grade finished area approximately 1,336
- Exterior features: Patio and porch; Fenced yard; Shed(s)
Interior
- Bathrooms: One full bathroom
- Heating & cooling: Central air conditioning; Forced air heating
- Interior features: Partial, unfinished basement; Six total rooms
Neighborhood map
What this means for you Summary
Snapshot
- This is a 3-bed/1.0-bath single-family listed at $90k.
Deal economics
- At list price, monthly cash flow is $330 ($4k/yr) — positive.
- The deal already cash-flows at list — no discount required.
- Meets the 1% rule at list price ($1k rent vs $90k).
- Recommended offer: $87k (3.0% below list) — sets the bar for market timing.
- Cap rate 10.7% vs local median 5.1% in Ironton — top-decile yield for the area; either an underpriced asset or a hidden risk that comps aren't pricing in. Stress-test before assuming the spread holds.
Location & tenants
- Location reads 72/100 on livability (#354 in OH) — a middle-class / working-renter tenant base. Strengths: cost of living A+, health & safety A+, housing A-; Watch: amenities F, commute F, employment D-.
- Ironton City School District (suburban): math 54% / reading 58% proficiency, ranked #382 of 656 in OH (top 58%) — acceptable for families but not a draw, mixed tenant base, ~2y average lease.
- Market conditions: 84 active listings in the ZIP; 18 units permitted in Lawrence County in 2024 (0 in 5+ unit buildings).
Forward outlook
- Local home prices are declining (-3.0%/yr); year-one equity from $622 of loan paydown is wiped out by about $3k of value loss. Plan a longer hold.
- Lawrence County population projected at -22% by 2050 — secular population decline; favor cash flow + early exit over multi-decade hold.
- At projected returns (-3.0% appreciation + 3.0% rent growth), your $25k cash investment doubles in ~8 years — after that, you're playing with house money.
Negotiation context
- It's been on market 42 days — a 3% lower offer ($87k) is reasonable based on typical stale-listing flexibility.
- 2 sale attempts with the ask held roughly flat each time — persistent listings suggest the price (not the market) is what's stuck; bring a comps-based counter.
- Current owner paid $28k; list at $90k implies a 221% gain — meaningful room to come down on a strong offer.
Risks & watch-outs
- Watch-outs: built in 1938 — expect roof / HVAC / electrical / plumbing capex.
- Climate carrying-cost: moderate wildfire risk; extreme-heat days projected 7→19/yr by 2055 (HVAC capex compounding) — expect insurance premiums to compound above CPI over the hold.
Questions for the listing agent
- It's been on market 42 days. Have you received any prior offers? Is the seller open to a 3% concession, seller financing, or rate buy-down credit?
- Built in 1938 — when were the roof, HVAC, electrical panel, plumbing, and water heater last replaced?
- Is there a deadline driving the sale (1031 exchange, divorce, estate, relocation)? That informs how much negotiation room exists.
- Schools are B-rated — typically a magnet for longer-tenancy family renters. What's the average tenant stay here, and is there a school-zone premium baked into asking?
- What's the average days-on-market for RENTAL listings here right now (not sales)? A rising rental-DOM trend means longer vacancies and softer asking-rent achievability than the comps imply.
- What's the recent tenant-quality profile in this submarket — average credit score on applications, eviction rate, late-payment / NSF rate, and stable-employment percentage? A property-management company in the area should have these aggregated.
- How much new for-sale + rental construction is in the pipeline within 1–3 miles? Heavy new supply typically softens prices + rents 12–24 months out; constrained supply supports both.
Investment metrics
- 1% rule
- 1.30% ✓
- Cap rate
- 10.70%
- Cash-on-cash
- 15.74%
- DSCR
- 1.70
- GRM
- 6.4
CMA / ARV
- ARV (median comp)
- $128,550
- List price
- $89,900
- Delta
- -30.07%
- Verdict
- UNDERPRICED
- Comps
- 20 within 1.0 mi
Show comp detail 12 sales within ~0.75 mi
| Address | Dist | Beds/Ba | Sqft | Sold | Price | $/sf | Match |
|---|---|---|---|---|---|---|---|
| 1116 South 8th St | 0.14mi | 3/2.0 | 1,358 (+2%) | 3mo | $170,000 | $125 | 84 |
| 914 S 8th Street St | 0.27mi | 3/1.0 | 1,315 (-2%) | 2mo | $62,500 | $48 | 83 |
| 1619 S 6th St | 0.26mi | 3/1.0 | 1,352 (+1%) | 4mo | $146,000 | $108 | 83 |
| 609 Spruce St | 0.05mi | 3/2.0 | 1,200 (-10%) | 1mo | $128,500 | $107 | 76 |
| 913 South 8th St | 0.28mi | 3/2.5 | 1,296 (-3%) | 1mo | $207,000 | $160 | 75 |
| 721 Chestnut St | 0.25mi | 3/1.0 | 1,410 (+6%) | 7mo | $1 | — | 73 |
| 1703 S 5th St | 0.31mi | 3/1.5 | 1,296 (-3%) | 8mo | $185,000 | $143 | 72 |
| 1530 S 5th Street St | 0.21mi | 3/1.0 | 1,500 (+12%) | 1mo | $112,500 | $75 | 69 |
| 1222 Osage Ct | 0.40mi | 3/2.0 | 1,374 (+3%) | 8mo | $180,000 | $131 | 66 |
| 1412 S 4th St | 0.21mi | 3/1.0 | 1,136 (-15%) | 1mo | $128,600 | $113 | 65 |
| 323 Neal Ave | 0.45mi | 2/1.0 (-1) | 1,273 (-5%) | 2mo | $101,000 | $79 | 64 |
| 707 Mastin Ave | 0.47mi | 3/2.0 | 1,200 (-10%) | 7mo | $165,000 | $138 | 51 |
Match score weights: distance 35% · size 25% · config 20% · recency 20%. Top-matched comps best support the ARV.
Projected returns pro-forma
-3.0% appreciation · 3.0% rent growth · sell at horizon
- IRR
- 6.6%
- Equity multiple
- 1.26×
- Total profit
- $6,460
- Equity at exit
- $13,404
- IRR
- 15.9%
- Equity multiple
- 2.30×
- Total profit
- $32,697
- Equity at exit
- $7,773
Cash invested: $25,172 (down + closing). Projections, not guarantees.
Landlord ↔ Tenant lean methodology
- Overall (STATE)
- 73 Landlord-Friendly
- State Ohio
- 73 Landlord-Friendly · R+6
- County
- — inherits STATE
- City
- — inherits STATE
ZIP-level market 45638
- Home prices YoY
- -19.6%
- Active inventory
- 84
- Price-to-rent
- 6.4×
Monthly cashflow live
- Estimated rent
- $1,165 medium interval (Pro) →
- Mortgage (P&I)
- −$471
- Tax from tax record
- −$81 /mo · $977/yr
- Insurance
- −$37
- HOA
- −$0
- Vacancy / Maint / Mgmt
- −$245
- Net cashflow
- $330
Break-even live
UW: 25.0% down · 7.5% · 30yr · 1.5% tax · 5.0% vac · 8.0% maint · 8.0% mgmt
Financing live
Cash to close
- Down payment
- $22,475
- Closing costs
- $2,697
- Reserves months
- —
- Total cash needed
- —
Loan-product check · same deal, 3 products live
Conventional
25% down · 7.5% · 30yr
- Down + closing
- —
- Monthly P&I
- —
- Monthly cashflow
- —
- DSCR
- —
- Eligible?
- —
Personal DTI + credit; lowest rate.
DSCR
20% down · 8.5% · 30yr
- Down + closing
- —
- Monthly P&I
- —
- Monthly cashflow
- —
- DSCR
- —
- Eligible?
- —
No personal income docs; deal must DSCR.
Hard money
10% down · 12.0% · 12mo
- Down + closing
- —
- Monthly P&I
- —
- Monthly cashflow
- —
- DSCR
- —
- Eligible?
- —
Short-term bridge; refi at stabilization.
Listing history 20 events
-
2026-06-18days on market $89,900 Active 42 DOM
-
2026-06-17days on market $89,900 Active 41 DOM
-
2026-06-16days on market $89,900 Active 40 DOM
Show marketing remark (276 chars)
This home offers a rare large double lot, 2 car carport off the alley, fenced back yard, and walking distance from Ironton High School and Ohio University. Home needs some TLC on interior, but home is a rare find with a double lot this close to the high school and University.
-
2026-06-15days on market $89,900 Active 39 DOM
-
2026-06-13days on market $89,900 Active 37 DOM
-
2026-06-12days on market $89,900 Active 36 DOM
-
2026-06-09days on market $89,900 Active 33 DOM
-
2026-06-08days on market $89,900 Active 32 DOM
-
2026-06-08days on market $89,900 Active 31 DOM
-
2026-06-07days on market $89,900 Active 30 DOM
-
2026-06-04days on market $89,900 Active 27 DOM
-
2026-06-02days on market $89,900 Active 26 DOM
-
2026-06-01days on market $89,900 Active 25 DOM
-
2026-05-31days on market $89,900 Active 24 DOM
-
2026-05-07$89,900 Active 276-char remark
Show marketing remark (276 chars)
This home offers a rare large double lot, 2 car carport off the alley, fenced back yard, and walking distance from Ironton High School and Ohio University. Home needs some TLC on interior, but home is a rare find with a double lot this close to the high school and University.
-
2016-11-29soldstatus $28,000
-
2016-04-07soldstatus $25,935
-
2010-08-13soldstatus $60,000
-
1997-06-09soldstatus $50,000
ⓘ Source: listings_history table (triggers on properties + properties_extension) + one-shot
backfill from property_details.listing_events for pre-trigger history.
Tax reassessment forecast OH · Partial reset (capped growth)
- Current annual tax
- $977 · $81/mo
- Projected year-2 tax
- $1,190 · $99/mo
- Expected delta
- +$213/yr (+$18/mo · 21.8%)
ⓘ Screening estimate from a state-policy table — verify with the county assessor before closing.
Climate risk First Street
- Flood 1/10 Low FEMA zone X · 0% chance over 30 yrs
- Wildfire 5/10 Major
- Heat 5/10 Major 7 d/yr ≥102°F today · 19 d/yr by 30 yrs out
- Wind 2/10 Low 2% chance of damaging wind over 30 yrs
- Air quality 2/10 Low 0 unhealthy d/yr today · 2 by 30 yrs out
Nearby sold comps map
Loading sold comps map…
Walkable amenities ~0.75 mi
Loading nearby amenities…
Taxation est. · year 1
- Rental income
- $13,982
- − Mortgage interest
- −$5,036
- − Property taxes
- −$977
- − Insurance
- −$450
- − Repairs & maintenance
- −$1,119
- − Management
- −$1,119
- − Depreciation
- −$2,615
- Taxable income
- $2,667
- Est. tax owed @ 24.0%
- −$640
- After-tax cash flow
- $3,322/yr
For passive investors: Depreciation is non-cash, so a rental often shows a tax loss while cash-flowing — sheltering income. Rental losses are passive: they offset passive income freely, and up to $25,000/yr can offset ordinary (W-2) income if you actively participate and your MAGI is under $100k (phasing out to $0 by $150k); unused losses carry forward. On sale, claimed depreciation is recaptured at up to 25%, and gains may owe capital-gains tax (a 1031 exchange can defer both). Figures are a year-1 estimate at your 24.0% rate — not tax advice; consult a CPA.
Schools (NCES district)
- District
- Ironton City School District
- NCES district ID
- 3904414
- Math proficiency
- 54% ▼ -10.00%
- Reading proficiency
- 58% ▼ -7.00%
- Median HH income
- $32,999
- Composite
- 46.13/100
- National rank
- #2505
- State rank
- #382 of 656 in OH
Livability — Ironton
- Score
- 72/100
- State rank
- #354
- US rank
- #5718
Category grades
Schools grade is shown separately in the Schools card above.
Census & demographics
- Census place
- Ironton, OH
- County
- Lawrence · 57,020 people
- Metro
- Huntington-Ashland, WV-KY-OH
- Population (ZIP)
- 19,921
- Household income
- $49,544
- Rent vs Own
- Severe rent burden
- 10.7
Population outlook (Lawrence County) Hauer SSP2
- Today (2025)
- 57,915 people
- By 2030
- 55,650 · -3.9%
- By 2040
- 50,523 · -12.8%
- By 2050
- 45,103 · -22.1%
- By 2075
- 32,441 · -44.0%
- By 2100
- 21,754 · -62.4%
Race, ethnicity, and origin ACS 2023
- Neighborhood character
- Predominantly White (95%)
- Race & ethnicity
- White 95% Two or more races 3% Black 1%
- Common ancestry
- Slovak 2% Iranian 2% Lithuanian 1%
- Foreign-born
- 0%
Political lean MEDSL · Lawrence
- 2024 margin
- Solid R (+50.5) · D 24.4% · R 74.9%
- 2008→2024 swing
- -35.2pp toward R · 2008: -15.3pp · 2024: -50.5pp
- All cycles
- 2024: R+50.5 2020: R+45.6 2016: R+43.9 2012: R+15.5 2008: R+15.3
Not yet ingested
- Civics
- —
Market trends
- HPI YoY
- ▼ -48.00%
- Current HPI
- 196.7459
- Rent YoY
- —
- Metro
- —
- State GDP YoY
- ▲ 1.98%
- F500 in state
- 48
Industry mix (Fortune 500 HQ in OH)
| Industry | F500 HQs | Revenue |
|---|---|---|
| Insurance | 3 | $145B |
|
||
| Industrial Machinery | 3 | $49B |
|
||
| Financial Services | 3 | $24B |
|
||
| Consumer Goods | 2 | $93B |
|
||
| Aerospace / Defense | 2 | $47B |
|
||
| Utilities | 2 | $33B |
|
||
Price history
+79.8% since first listed7 events — show timeline
- 2026-06-16 Pending — HBRMLS
- 2026-05-07 Listed $89,900 AABOR
- 2026-05-07 Listed $89,900 HBRMLS
- 2016-11-29 Sold (Public Records) $28,000 Public Records
- 2016-04-07 Sold (Public Records) $25,935 Public Records
- 2010-08-13 Sold (Public Records) $60,000 Public Records
- 1997-06-09 Sold (Public Records) $50,000 Public Records
Property tax history
+3.1%/yrLatest (2025): $977 · +14.6% YoY. Source: county tax records.
Cash-flow waterfall
monthlySold comps — $/sqft
last 12 mo · ≤1 miLoading sold comps…