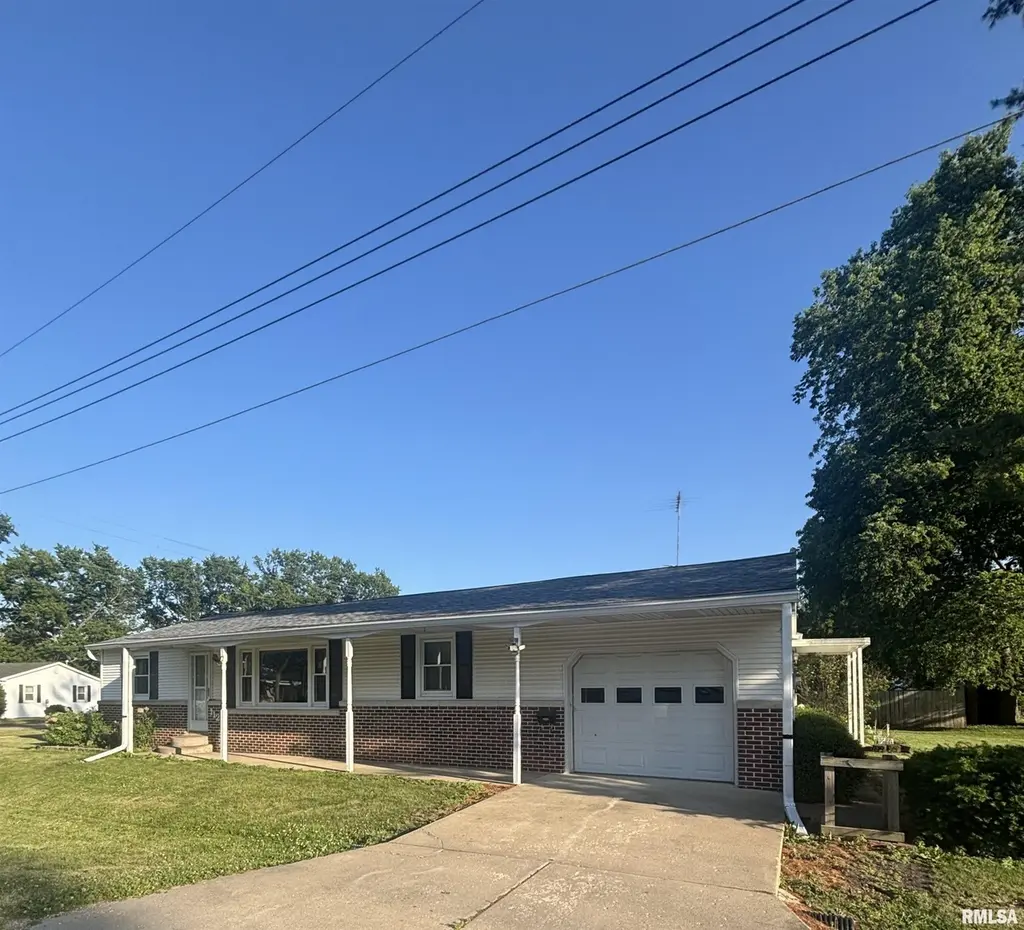
112 E Market St · Yates City, IL
Flood risk 1/10 · Minimal
- FEMA flood zone
- X (unshaded)
- Chance of flooding over 30 yrs
- 0.0%
- Est. flood insurance / yr
- $507 – $1,088
Fire risk 1/10 · Minimal
- Est. fire insurance / yr
- $804 – $1,492
Heat risk 3/10 · Minor
- Hot days now (above 104°F)
- 7 days/yr
- Hot days in 30 yrs
- 18 days/yr
Wind risk 2/10 · Minimal
- Chance of severe wind over 30 yrs
- 1.0%
Air-quality risk 2/10 · Minimal
- Unhealthy air days now
- 1 days/yr
- Unhealthy air days in 30 yrs
- 2 days/yr
Risk factors via First Street. Map © Google.
Why this score? — see what drove the B grade
The composite is a weighted blend of 9 inputs, each scored 0–100. Each bar is that input's sub-score; the figure is the points it added to the 100-point composite (weight × sub-score).
- Cash flow +24.3/30.0
- ARV discount +15.0/15.0
- Appreciation +8.9/10.0
- DSCR +7.8/10.0
- 1% rule +6.7/10.0
- Livability +3.0/5.0
- Rent growth +2.5/5.0
- Condition / age +2.5/5.0
- Schools +2.3/10.0
$104,000
🖨 Deal sheet (PDF) 📄 Offer letter ✓ Due diligence
Listing remarks
What a surprise. .. so much space with both a living room AND a family room which includes a wood burning fireplace plus sliders to the back yard. Large eat-in kitchen with cabinets galore & breakfast bar. Spacious attached garage has room to store all the extras. Main level utility closet is large enough for a full size washer/dryer. Enjoy the huge yard perfect for a fire pit and hanging out with friends. Home needs some updates and ready for your finishing touches. (Home sold AS IS-Appliances AS IS)
Key facts
- Living room
- Family room
- Eat-in kitchen
Tags
Property features AI
Finance
- HOA & community: No association fees
Exterior
- Parking: Attached 1-car garage
- Utilities: Public water; Public sewer
- Home design: Single-family residence; 1960 construction; One main living level with upper, lower and basement levels noted; Shingle roof; Crawl space basement
- Construction: Built in 1960
- Exterior features: Corner, level lot; Paved road access
Interior
- Kitchen: Dishwasher; Microwave; Refrigerator
- Bedrooms: Three bedrooms (all on the main level)
- Flooring: Carpet in bedrooms, living spaces, family room, dining room, and kitchen
- Bathrooms: One full bathroom
- Heating & cooling: Central air conditioning; Electric and forced air heating; Gas water heater
- Interior features: Ceiling fan(s); Family room fireplace with gas log; One fireplace total
- Laundry & utility: Main-level laundry room
Neighborhood map
What this means for you Summary
Snapshot
- This is a 3-bed/1.0-bath single-family listed at $104k.
Deal economics
- At list price, monthly cash flow is $210 ($3k/yr) — positive.
- The deal already cash-flows at list — no discount required.
- Meets the 1% rule at list price ($1k rent vs $104k).
Location & tenants
- Location reads 60/100 on livability (#949 in IL) — a middle-class / working-renter tenant base. Strengths: cost of living A+, housing A+; Watch: employment C-, crime D, amenities F.
- Farmington Central CUSD 265 (rural): math 23% / reading 29% proficiency, ranked #293 of 620 in IL (top 47%) — low school quality limits family demand, transient renter base, plan for 1-2y turnover.
- Zoned schools: Farmington Central Elem Sch (math 25% / reading 23%, grade F, #922 of 2,056 statewide, top 45%, 622 students, 0% FRL); Farmington Central Jr High Sch (math 24% / reading 36%, grade F, #246 of 665 statewide, top 38%, 262 students, 0% FRL); Farmington Central High Sch (math 17% / reading 17%, grade F, #430 of 693 statewide, top 66%, 375 students, 0% FRL) — zoned schools average 0% FRL vs 32% district-wide (32 pts lower); this property's tenant base skews higher-income than the district average.
- Market conditions: 7 active listings in the ZIP.
Forward outlook
- In year one you build about $9k of equity ($719 loan paydown + $8k appreciation (7.8% local appreciation)).
- Knox County population projected at -19% by 2050 — secular population decline; favor cash flow + early exit over multi-decade hold.
- At projected returns (7.8% appreciation + 3.0% rent growth), your $29k cash investment doubles in ~3 years — after that, you're playing with house money.
- By year 4, paydown + projected appreciation supports a ~$31k cash-out refi (75% LTV) — recoverable capital for the next deal without selling this one.
Negotiation context
- Only 12 days on market — expect competitive offers; lowballing is unlikely to land.
Questions for the listing agent
- Built in 1960 — when were the roof, HVAC, electrical panel, plumbing, and water heater last replaced?
- Is there a deadline driving the sale (1031 exchange, divorce, estate, relocation)? That informs how much negotiation room exists.
- Schools are F-rated, which usually means shorter tenancies and higher turnover. Who's the typical renter profile here, and what's been the actual vacancy rate?
- Crime grade is D in this area — have there been break-ins, vandalism, or insurance claims at this property in the last 3 years? What carrier currently insures it and at what premium?
- What's the average days-on-market for RENTAL listings here right now (not sales)? A rising rental-DOM trend means longer vacancies and softer asking-rent achievability than the comps imply.
- What's the recent tenant-quality profile in this submarket — average credit score on applications, eviction rate, late-payment / NSF rate, and stable-employment percentage? A property-management company in the area should have these aggregated.
- How much new for-sale + rental construction is in the pipeline within 1–3 miles? Heavy new supply typically softens prices + rents 12–24 months out; constrained supply supports both.
Investment metrics
- 1% rule
- 1.17% ✓
- Cap rate
- 8.71%
- Cash-on-cash
- 8.65%
- DSCR
- 1.38
- GRM
- 7.1
CMA / ARV
- ARV (on-the-fly)
- $153,920
- Comps found
- 4
Show comp detail 4 sales within ~0.75 mi
| Address | Dist | Beds/Ba | Sqft | Sold | Price | $/sf | Match |
|---|---|---|---|---|---|---|---|
| 404 S Kellogg St | 0.19mi | 3/1.0 | 1,296 (-12%) | 1mo | $123,500 | $95 | 70 |
| 111 E Ames St | 0.24mi | 3/1.0 | 1,304 (-12%) | 2mo | $136,000 | $104 | 67 |
| 496 Knox Hwy 18 | 0.47mi | 3/2.0 | 1,475 (-0%) | 21mo | $173,500 | $118 | 56 |
| 307 N Kellogg St | 0.29mi | 3/2.0 | 1,680 (+14%) | 16mo | $95,000 | $57 | 46 |
Match score weights: distance 35% · size 25% · config 20% · recency 20%. Top-matched comps best support the ARV.
Projected returns pro-forma
7.81% appreciation · 3.0% rent growth · sell at horizon
- IRR
- 26.3%
- Equity multiple
- 2.89×
- Total profit
- $54,953
- Equity at exit
- $77,636
- IRR
- 23.8%
- Equity multiple
- 6.14×
- Total profit
- $149,559
- Equity at exit
- $152,813
Cash invested: $29,120 (down + closing). Projections, not guarantees.
Landlord ↔ Tenant lean methodology
- Overall (STATE)
- 43 Moderately Tenant-Leaning
- State Illinois
- 43 Moderately Tenant-Leaning · D+7
- County
- — inherits STATE
- City
- — inherits STATE
ZIP-level market 61572
- Home prices YoY
- 5.2%
- Active inventory
- 7
- Price-to-rent
- 7.1×
Monthly cashflow live
- Estimated rent
- $1,220 medium interval (Pro) →
- Mortgage (P&I)
- −$545
- Tax from tax record
- −$165 /mo · $1,980/yr
- Insurance
- −$43
- HOA
- −$0
- Vacancy / Maint / Mgmt
- −$256
- Net cashflow
- $210
Break-even live
Sensitivity live
| Price | -10% $269 | -5% $239 | +0% $210 | +5% $180 | +10% $151 |
|---|---|---|---|---|---|
| Rent | -10% $113 | -5% $162 | +0% $210 | +5% $258 | +10% $306 |
| Rate | -1.0pp $262 | -0.5pp $236 | base $210 | +0.5pp $183 | +1.0pp $155 |
UW: 25.0% down · 7.5% · 30yr · 1.5% tax · 5.0% vac · 8.0% maint · 8.0% mgmt
Financing live
Cash to close
- Down payment
- $26,000
- Closing costs
- $3,120
- Reserves months
- —
- Total cash needed
- —
Loan-product check · same deal, 3 products live
Conventional
25% down · 7.5% · 30yr
- Down + closing
- —
- Monthly P&I
- —
- Monthly cashflow
- —
- DSCR
- —
- Eligible?
- —
Personal DTI + credit; lowest rate.
DSCR
20% down · 8.5% · 30yr
- Down + closing
- —
- Monthly P&I
- —
- Monthly cashflow
- —
- DSCR
- —
- Eligible?
- —
No personal income docs; deal must DSCR.
Hard money
10% down · 12.0% · 12mo
- Down + closing
- —
- Monthly P&I
- —
- Monthly cashflow
- —
- DSCR
- —
- Eligible?
- —
Short-term bridge; refi at stabilization.
Listing history 10 events
-
2026-06-21days on market $104,000 Active 12 DOM
-
2026-06-21days on market $104,000 Active 11 DOM
-
2026-06-18days on market $104,000 Active 9 DOM
-
2026-06-17days on market $104,000 Active 8 DOM
-
2026-06-16days on market $104,000 Active 7 DOM
-
2026-06-15days on market $104,000 Active 6 DOM
-
2026-06-13days on market $104,000 Active 4 DOM
-
2026-06-12days on market $104,000 Active 3 DOM
-
2026-06-09remarks 508-char remark
-
2026-06-09$104,000 Active 1 DOM
ⓘ Source: listings_history table (triggers on properties + properties_extension) + one-shot
backfill from property_details.listing_events for pre-trigger history.
Tax reassessment forecast IL · Partial reset (capped growth)
- Current annual tax
- $1,980 · $165/mo
- Projected year-2 tax
- $2,171 · $181/mo
- Expected delta
- +$190/yr (+$16/mo · 9.6%)
ⓘ Screening estimate from a state-policy table — verify with the county assessor before closing.
Climate risk First Street
- Flood 1/10 Low FEMA zone X (unshaded) · 0% chance over 30 yrs
- Wildfire 1/10 Low
- Heat 3/10 Moderate 7 d/yr ≥104°F today · 18 d/yr by 30 yrs out
- Wind 2/10 Low 100% chance of damaging wind over 30 yrs
- Air quality 2/10 Low 1 unhealthy d/yr today · 2 by 30 yrs out
Nearby sold comps map
Loading sold comps map…
Walkable amenities ~0.75 mi
Loading nearby amenities…
Taxation est. · year 1
- Rental income
- $14,637
- − Mortgage interest
- −$5,826
- − Property taxes
- −$1,980
- − Insurance
- −$520
- − Repairs & maintenance
- −$1,171
- − Management
- −$1,171
- − Depreciation
- −$3,025
- Taxable income
- $943
- Est. tax owed @ 24.0%
- −$226
- After-tax cash flow
- $2,292/yr
For passive investors: Depreciation is non-cash, so a rental often shows a tax loss while cash-flowing — sheltering income. Rental losses are passive: they offset passive income freely, and up to $25,000/yr can offset ordinary (W-2) income if you actively participate and your MAGI is under $100k (phasing out to $0 by $150k); unused losses carry forward. On sale, claimed depreciation is recaptured at up to 25%, and gains may owe capital-gains tax (a 1031 exchange can defer both). Figures are a year-1 estimate at your 24.0% rate — not tax advice; consult a CPA.
Schools (NCES district)
- District
- Farmington Central CUSD 265
- NCES district ID
- 1700044
- Math proficiency
- 23% ▼ -8.00%
- Reading proficiency
- 29% ▼ -11.00%
- Median HH income
- $54,785
- Composite
- 23.33/100
- National rank
- #7914
- State rank
- #293 of 620 in IL
Livability — Yates City
- Score
- 60/100
- State rank
- #949
- US rank
- #18574
Category grades
Schools grade is shown separately in the Schools card above.
Census & demographics
- Census place
- Yates City, IL
- Population (ZIP)
- 916
Population outlook (Knox County) Hauer SSP2
- Today (2025)
- 48,224 people
- By 2030
- 46,333 · -3.9%
- By 2040
- 42,424 · -12.0%
- By 2050
- 38,929 · -19.3%
- By 2075
- 31,523 · -34.6%
- By 2100
- 24,092 · -50.0%
Race, ethnicity, and origin ACS 2023
- Neighborhood character
- Predominantly White (94%)
- Race & ethnicity
- White 94% Black 2% Two or more races 2%
- Common ancestry
- Lithuanian 3% Slovak 3% Romanian 1%
- Foreign-born
- 0%
Political lean MEDSL · Knox
- 2024 margin
- Lean R (+9.4) · D 44.4% · R 53.7% · Other 1.9%
- 2008→2024 swing
- -29.3pp toward R · 2008: 19.9pp · 2024: -9.4pp
- All cycles
- 2024: R+9.4 2020: R+5.6 2016: R+3.3 2012: D+17.1 2008: D+19.9
Not yet ingested
- Civics
- —
Market trends
- HPI YoY
- ▲ 7.81%
- Current HPI
- 157.2979
- Rent YoY
- —
- Metro
- —
- State GDP YoY
- ▲ 1.59%
- F500 in state
- 60
Industry mix (Fortune 500 HQ in IL)
| Industry | F500 HQs | Revenue |
|---|---|---|
| Insurance | 4 | $201B |
|
||
| Consumer Goods | 4 | $87B |
|
||
| Industrial Machinery | 3 | $64B |
|
||
| Healthcare | 2 | $55B |
|
||
| Retail / Pharmacy | 1 | $148B |
|
||
| Agriculture / Food | 1 | $86B |
|
||
Price history
1 event — show timeline
- 2026-06-08 Listed $104,000 RMLSA as Distributed by MLS Grid
Property tax history
-0.8%/yrLatest (2025): $1,980 · -3.2% YoY. Source: county tax records.
Cash-flow waterfall
monthlySold comps — $/sqft
last 12 mo · ≤1 miLoading sold comps…